image

IoT in Smart Cities Market Size & Trends:

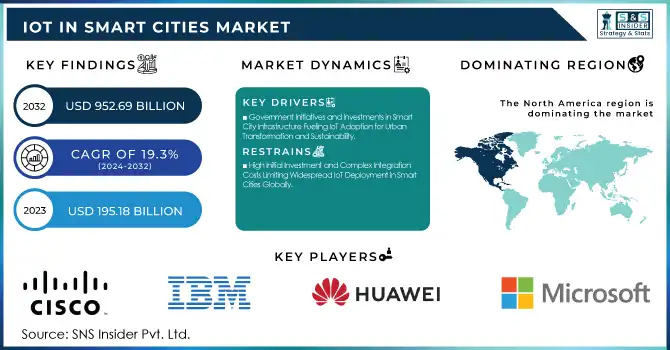
The IoT in Smart Cities Market Size was valued at USD 195.18 Billion in 2023 and is expected to reach USD 952.69 Billion by 2032 and grow at a CAGR of 19.3% over the forecast period 2024-2032.

IoT in Smart Cities Market Revenue Analysis

To get more information on IoT in Smart Cities Market - Request Free Sample Report

The market includes adoption rates, technology trends, investment patterns, and government initiatives. Data on infrastructure development, smart city projects, and partnerships between tech companies and municipalities can offer insights into market dynamics. Furthermore, the penetration of IoT in various sectors such as transportation, energy, healthcare, and public safety can be highlighted. Additionally, consumer behavior, sustainability initiatives, and security concerns related to IoT can provide a comprehensive overview of market opportunities and challenges.

IoT in Smart Cities Market Dynamics

Key Drivers:

  • Government Initiatives and Investments in Smart City Infrastructure Fueling IoT Adoption for Urban Transformation and Sustainability

Government initiatives and investments in smart city infrastructure have significantly driven the adoption of IoT technologies in urban settings. As cities worldwide seek to become more sustainable, efficient, and technologically advanced, governments are increasingly funding smart city projects to improve urban living. By promoting investments in IoT technologies, governments facilitate the growth of urban environments, offering solutions that enable more informed decision-making for city management. For instance, through intelligent traffic management systems, optimized public transportation networks, and energy-efficient systems, governments are helping to reduce environmental impacts while improving the quality of life. As this trend continues, the IoT in smart cities market is expected to see sustained growth, as public and private sector investments align to foster further IoT integration.

Restraint:

  • High Initial Investment and Complex Integration Costs Limiting Widespread IoT Deployment in Smart Cities Globally

Despite the promising potential of IoT in transforming smart cities, the high initial investment and integration costs serve as significant barriers. Deploying IoT infrastructure requires considerable upfront capital, particularly in terms of purchasing devices, sensors, communication networks, and other hardware components. These financial and technical barriers create resistance from governments and businesses, particularly in cities with limited budgets or a lack of technical expertise. Until solutions emerge that reduce the cost of IoT adoption and simplify integration, these financial constraints will continue to hamper the broader and faster adoption of IoT technologies across smart cities, slowing market expansion in certain regions.

Opportunity:

  • Growing Trend of Urbanization Creating Opportunities for IoT Solutions to Enhance Quality of Life and Urban Services

The rapid pace of urbanization presents a significant opportunity for the IoT in smart cities market, as cities seek innovative ways to accommodate growing populations and address emerging urban challenges. As urban areas expand, the demand for efficient transportation, waste management, water supply, and healthcare services rise, creating a substantial need for IoT-enabled solutions.

Additionally, IoT-enabled public health monitoring systems can ensure faster and more accurate responses to health crises. As urbanization accelerates globally, the integration of IoT systems offers an unprecedented opportunity to enhance the quality of life in cities, creating more sustainable and efficient urban environments. This growing need for urban transformation represents a valuable opportunity for both IoT providers and municipalities looking to modernize their infrastructure.

Challenge:

  • Data Security and Privacy Concerns Impeding Widespread Trust and Adoption of IoT Technologies in Smart Cities

One of the major challenges faced by the IoT in smart cities market is the issue of data security and privacy. As IoT devices collect and transmit vast amounts of data in real-time, they create vulnerabilities that can be exploited by cybercriminals. Sensitive information such as personal data, public infrastructure status, and transportation patterns is at risk of being intercepted, leading to potential misuse or breaches.

Additionally, the complexity of managing large volumes of data, ensuring its protection, and complying with privacy regulations creates significant challenges for municipalities. The lack of standardized security protocols across IoT devices only adds to the complexity. Overcoming these security and privacy challenges is essential for fostering widespread trust and ensuring the continued growth of IoT technologies in smart cities.

IoT in Smart Cities Market Segmentation Analysis

By Offering

In 2023, the Solutions segment accounted for the largest revenue share of 64%, driven by increasing investments in smart city infrastructure and advancements in technology. Companies like Cisco, Siemens, and Huawei have been leading the way in launching innovative solutions tailored for smart cities, including IoT-based smart traffic management, energy-efficient buildings, and public safety systems. Cisco's Digital Network Architecture and Siemens’ Smart Infrastructure solutions are prime examples of such developments, enabling cities to manage resources efficiently, enhance connectivity, and improve quality of life.

The Services segment is projected to grow at the highest CAGR of 20.29% during the forecast period, indicating an increasing reliance on services such as cloud computing, data analytics, and network management. Companies like IBM and Accenture have been focusing on delivering these services through strategic partnerships and cloud solutions tailored to smart cities. The expansion of IoT in smart cities relies heavily on services like data processing and analytics to turn raw data into actionable insights.

By Application

In 2023, the Smart Transportation segment led the market with the largest revenue share of 33%, reflecting the growing demand for connected transportation solutions that improve urban mobility and reduce congestion. Companies like Uber, Tesla, and Siemens have made significant strides in this sector, with innovations in autonomous vehicles, traffic management, and electric mobility.

Additionally, Siemens’ smart traffic management solutions, such as adaptive traffic signals and predictive analytics, enable cities to optimize traffic flow and reduce emissions. IoT plays a central role in the Smart Transportation sector by providing real-time data from sensors embedded in vehicles and infrastructure, enabling systems to communicate, respond dynamically to traffic conditions, and improve overall traffic safety.

the Smart Building segment is expected to grow at the highest CAGR of 21.36% during the forecast period. This growth is driven by the increasing demand for energy-efficient buildings, automation, and sustainability. Companies like Honeywell, Johnson Controls, and Schneider Electric are at the forefront of developing smart building solutions, including intelligent HVAC systems, lighting controls, and energy management systems. These innovations leverage IoT technology to monitor and control building environments, ensuring energy savings, improved comfort, and reduced operational costs.

IoT in Smart Cities Market Regional Outlook

In 2023, North America dominated the IoT in Smart Cities Market, accounting for the largest market share. The region is estimated to hold around 42% of the global market share. This dominance can be attributed to the significant investments in smart city projects, strong governmental support, and the presence of key technology companies driving innovation in IoT solutions.

For instance, the U.S. government’s commitment to smart infrastructure and sustainability, through initiatives like the Smart Cities Challenge, has encouraged cities such as New York and San Francisco to implement IoT-based solutions in areas like traffic management, energy efficiency, and public safety.

Asia Pacific is the fastest-growing region in the IoT in Smart Cities Market in 2023, with an estimated CAGR of around 21.51%. This rapid growth is fueled by rapid urbanization, government initiatives, and the adoption of advanced technologies in countries like China, India, and Japan.

For example, China's Smart Cities initiative and India’s "Smart Cities Mission" are major drivers of IoT adoption, focusing on improving urban living through intelligent transportation, waste management, and smart energy solutions.

IoT-in-Smart-Cities-Market-Regional-Share

Get Customized Report as per Your Business Requirement - Enquiry Now

Key Players

Some of the major players in the IoT in Smart Cities Market are:

  • Cisco Systems Inc (Cisco Kinetic for Cities, Cisco Connected Traffic Solutions)

  • IBM Corporation (IBM Watson IoT for Smart Cities, IBM Maximo)

  • Huawei Technologies Co. Ltd (Huawei Smart City Solution, Huawei OceanConnect IoT Platform)

  • Intel Corporation (Intel IoT Platform, Intel IoT Gateway)

  • Microsoft Corporation (Azure IoT, Azure Digital Twins)

  • Robert Bosch GmbH (Bosch IoT Suite, Bosch Smart City Mobility)

  • PTC (ThingWorx, Vuforia)

  • Siemens AG (Siemens City Performance Tool, Siemens Smart Infrastructure)

  • Verizon Communications (Verizon Smart Communities, Verizon Thingspace)

  • Honeywell International Inc. (Honeywell Smart Building Solutions, Honeywell Connected Services)

  • Hitachi Ltd. (Hitachi Smart City Solutions, Hitachi Visualization Suite)

  • Arm Ltd (Arm Mbed IoT Device Platform, Arm Pelion IoT Platform)

  • Schneider Electric (EcoStruxure Smart Cities, EcoStruxure IoT Platform)

  • Sierra Wireless (AirVantage IoT Platform, Smart City Solutions)

  • Quantela (Smart City Platform, Quantela City Cloud)

  • Youon Technology Co., Ltd. (Youon Smart Parking System, Youon Intelligent Transport System)

  • SAP SE (SAP Leonardo IoT, SAP Smart City Solutions)

  • Deutsche Telekom AG (T-Labs Smart City Solutions, Deutsche Telekom IoT Platform)

  • Confidex Ltd. (Confidex IoT Tags, Confidex Smart City Solutions)

  • AGT Group GmbH (AGT Smart City Platform, AGT Smart Parking)

Recent Trends

  • January 2025: IBM discussed how modern enterprises are leveraging IoT data for innovation. They highlighted the benefits of edge computing, enabling real-time data processing close to IoT devices. This reduces latency and bandwidth issues. Applications span across industries, from agriculture and industrial operations to healthcare and security, driving smarter decisions and enhancing customer experiences.

  • March 2024: Unilumin, in partnership with Huawei, unveiled their Smart Pole Site Joint Solution at MWC 2024. This solution aims to accelerate smart city transformations by offering secure, sustainable, intelligent, and efficient city operations. The system integrates advanced technologies such as 5G, ultra-high-resolution visualization, and smart poles to optimize urban governance.

IoT in Smart Cities Market Report Scope:

Report Attributes Details
Market Size in 2023 USD 195.18 Billion
Market Size by 2032 USD 952.69 Billion
CAGR CAGR of 19.3% From 2024 to 2032
Base Year 2023
Forecast Period 2024-2032
Historical Data 2020-2022
Report Scope & Coverage Market Size, Segments Analysis, Competitive  Landscape, Regional Analysis, DROC & SWOT Analysis, Forecast Outlook
Key Segments • By Offering (Solutions [Remote Monitoring, Real-time Location System, Data Management, Reporting and analytics, Security, Network Management] Services (Professional Services [Consulting, System Integration and Deployment, Support and Maintenance] Managed Services)
• By Application (Smart Transportation, Smart Building, Smart Utilities, Smart Citizen Services [Education, Healthcare, Public Safety])
Regional Analysis/Coverage North America (US, Canada, Mexico), Europe (Eastern Europe [Poland, Romania, Hungary, Turkey, Rest of Eastern Europe] Western Europe] Germany, France, UK, Italy, Spain, Netherlands, Switzerland, Austria, Rest of Western Europe]), Asia Pacific (China, India, Japan, South Korea, Vietnam, Singapore, Australia, Rest of Asia Pacific), Middle East & Africa (Middle East [UAE, Egypt, Saudi Arabia, Qatar, Rest of Middle East], Africa [Nigeria, South Africa, Rest of Africa], Latin America (Brazil, Argentina, Colombia, Rest of Latin America)
Company Profiles Cisco Systems Inc, IBM Corporation, Huawei Technologies Co. Ltd, Intel Corporation, Microsoft Corporation, Robert Bosch GmbH, PTC, Siemens AG, Verizon Communications, Honeywell International Inc., Hitachi Ltd., Arm Ltd, Schneider Electric, Sierra Wireless, Quantela, Youon Technology Co., Ltd., SAP SE, Deutsche Telekom AG, Confidex Ltd., AGT Group GmbH.

Frequently Asked Questions

Ans: The IoT in Smart Cities Market is expected to grow at a CAGR of 19.3% during 2024-2032.

Ans: The IoT in Smart Cities Market size was USD 195.18 billion in 2023 and is expected to Reach USD 952.69 billion by 2032.

Ans: The major growth factor of the IoT in Smart Cities Market is the increasing demand for efficient, sustainable urban management through connected devices and data-driven solutions.

Ans: Solution segment dominated the IoT in Smart Cities Market.

Ans: North America dominated the IoT in Smart Cities Market in 2023.

Table of Content

1. Introduction

1.1 Market Definition

1.2 Scope (Inclusion and Exclusions)

1.3 Research Assumptions

2. Executive Summary

2.1 Market Overview

2.2 Regional Synopsis

2.3 Competitive Summary

3. Research Methodology

3.1 Top-Down Approach

3.2 Bottom-up Approach

3.3. Data Validation

3.4 Primary Interviews

4. Market Dynamics Impact Analysis

4.1 Market Driving Factors Analysis

4.1.2 Drivers

4.1.2 Restraints

4.1.3 Opportunities

4.1.4 Challenges

4.2 PESTLE Analysis

4.3 Porter’s Five Forces Model

5. Statistical Insights and Trends Reporting

5.1 Investment and Funding Trends (2023)

5.2 Energy and Cost Savings

5.3 Infrastructure Deployment (2023)

6. Competitive Landscape

6.1 List of Major Companies, By Region

6.2 Market Share Analysis, By Region

6.3 Product Benchmarking

6.3.1 Product specifications and features

6.3.2 Pricing

6.4 Strategic Initiatives

6.4.1 Marketing and promotional activities

6.4.2 Distribution and supply chain strategies

6.4.3 Expansion plans and new product launches

6.4.4 Strategic partnerships and collaborations

6.5 Technological Advancements

6.6 Market Positioning and Branding

7. IoT in Smart Cities Market Segmentation, By Offering

7.1 Chapter Overview

7.2 Solutions

7.2.1 Solutions Market Trends Analysis (2020-2032)

7.2.2 Solutions Market Size Estimates and Forecasts to 2032 (USD Billion)

7.2.3 Remote Monitoring

7.2.3.1 Remote Monitoring Market Trends Analysis (2020-2032)

7.2.3.2 Remote Monitoring Market Size Estimates and Forecasts to 2032 (USD Billion)

7.2.4 Real-time Location System

7.2.4.1 Real-time Location System Market Trends Analysis (2020-2032)

7.2.4.2 Real-time Location System Market Size Estimates and Forecasts to 2032 (USD Billion)

7.2.5 Data Management

7.2.5.1 Data Management Market Trends Analysis (2020-2032)

7.2.5.2 Data Management Market Size Estimates and Forecasts to 2032 (USD Billion)

7.2.6 Reporting and analytics

7.2.6.1 Reporting and analytics Market Trends Analysis (2020-2032)

7.2.6.2 Reporting and analytics Market Size Estimates and Forecasts to 2032 (USD Billion)

7.2.7 Security

7.2.7.1 Security Market Trends Analysis (2020-2032)

7.2.7.2 Security Market Size Estimates and Forecasts to 2032 (USD Billion)

7.2.8 Network Management

7.2.8.1 Network Management Market Trends Analysis (2020-2032)

7.2.8.2 Network Management Market Size Estimates and Forecasts to 2032 (USD Billion)

7.3 Services

7.3.1 Services Market Trends Analysis (2020-2032)

7.3.2 Services Market Size Estimates and Forecasts to 2032 (USD Billion)

7.3.3 Professional Services

7.3.3.1 Professional Services Market Trends Analysis (2020-2032)

7.3.3.2 Professional Services Market Size Estimates and Forecasts to 2032 (USD Billion)

7.3.3.3 Consulting

7.3.3.3.1 Consulting Market Trends Analysis (2020-2032)

7.3.3.3.2 Consulting Market Size Estimates and Forecasts to 2032 (USD Billion)

7.3.3.4 System Integration and Deployment

7.3.3.4.1 System Integration and Deployment Market Trends Analysis (2020-2032)

7.3.3.4.2 System Integration and Deployment Market Size Estimates and Forecasts to 2032 (USD Billion)

7.3.3.5 Support and Maintenance

7.3.3.5.1 Support and Maintenance Market Trends Analysis (2020-2032)

7.3.3.5.2 Support and Maintenance Market Size Estimates and Forecasts to 2032 (USD Billion)

7.3.4 Managed Services

7.3.4.1 Managed Services Market Trends Analysis (2020-2032)

7.3.4.2 Managed Services Market Size Estimates and Forecasts to 2032 (USD Billion)

8. IoT in Smart Cities Market Segmentation, By Application

8.1 Chapter Overview

8.2 Smart Transportation

8.2.1 Smart Transportation Market Trends Analysis (2020-2032)

8.2.2 Smart Transportation Market Size Estimates and Forecasts to 2032 (USD Billion)

8.3 Smart Building

             8.3.1 Smart Building Market Trends Analysis (2020-2032)

8.3.2 Smart Building Market Size Estimates and Forecasts to 2032 (USD Billion)

8.4 Smart Utilities

8.2.1 Smart Utilities Market Trends Analysis (2020-2032)

8.4.2 Smart Utilities Market Size Estimates and Forecasts to 2032 (USD Billion)

8.5 Smart Citizen Services

8.5.1 Smart Citizen Services Market Trends Analysis (2020-2032)

8.5.2 Smart Citizen Services Market Size Estimates and Forecasts to 2032 (USD Billion)

8.5.3 Education

8.5.3.1 Education Market Trends Analysis (2020-2032)

8.5.3.2 Education Market Size Estimates and Forecasts to 2032 (USD Billion)

8.5.4 Healthcare

8.5.4.1 Healthcare Market Trends Analysis (2020-2032)

8.5.4.2 Healthcare Market Size Estimates and Forecasts to 2032 (USD Billion)

8.5.5 Public Safety

8.5.5.1 Public Safety Market Trends Analysis (2020-2032)

8.5.5.2 Public Safety Market Size Estimates and Forecasts to 2032 (USD Billion)

9. Regional Analysis

9.1 Chapter Overview

9.2 North America

9.2.1 Trends Analysis

9.2.2 North America IoT in Smart Cities Market Estimates and Forecasts, by Country (2020-2032) (USD Billion)

9.2.3 North America IoT in Smart Cities Market Estimates and Forecasts, By Offering (2020-2032) (USD Billion) 

9.2.4 North America IoT in Smart Cities Market Estimates and Forecasts, By Application (2020-2032) (USD Billion)

9.2.5 USA

9.2.5.1 USA IoT in Smart Cities Market Estimates and Forecasts, By Offering (2020-2032) (USD Billion)

9.2.5.2 USA IoT in Smart Cities Market Estimates and Forecasts, By Application (2020-2032) (USD Billion)

9.2.6 Canada

9.2.6.1 Canada IoT in Smart Cities Market Estimates and Forecasts, By Offering (2020-2032) (USD Billion)

9.2.6.2 Canada IoT in Smart Cities Market Estimates and Forecasts, By Application (2020-2032) (USD Billion)

9.2.7 Mexico

9.2.7.1 Mexico IoT in Smart Cities Market Estimates and Forecasts, By Offering (2020-2032) (USD Billion)

9.2.7.2 Mexico IoT in Smart Cities Market Estimates and Forecasts, By Application (2020-2032) (USD Billion)

9.3 Europe

9.3.1 Eastern Europe

9.3.1.1 Trends Analysis

9.3.1.2 Eastern Europe IoT in Smart Cities Market Estimates and Forecasts, by Country (2020-2032) (USD Billion)

9.3.1.3 Eastern Europe IoT in Smart Cities Market Estimates and Forecasts, By Offering (2020-2032) (USD Billion) 

9.3.1.4 Eastern Europe IoT in Smart Cities Market Estimates and Forecasts, By Application (2020-2032) (USD Billion)

9.3.1.5 Poland

9.3.1.5.1 Poland IoT in Smart Cities Market Estimates and Forecasts, By Offering (2020-2032) (USD Billion)

9.3.1.5.2 Poland IoT in Smart Cities Market Estimates and Forecasts, By Application (2020-2032) (USD Billion)

9.3.1.6 Romania

9.3.1.6.1 Romania IoT in Smart Cities Market Estimates and Forecasts, By Offering (2020-2032) (USD Billion)

9.3.1.6.2 Romania IoT in Smart Cities Market Estimates and Forecasts, By Application (2020-2032) (USD Billion)

9.3.1.7 Hungary

9.3.1.7.1 Hungary IoT in Smart Cities Market Estimates and Forecasts, By Offering (2020-2032) (USD Billion)

9.3.1.7.2 Hungary IoT in Smart Cities Market Estimates and Forecasts, By Application (2020-2032) (USD Billion)

9.3.1.8 Turkey

9.3.1.8.1 Turkey IoT in Smart Cities Market Estimates and Forecasts, By Offering (2020-2032) (USD Billion)

9.3.1.8.2 Turkey IoT in Smart Cities Market Estimates and Forecasts, By Application (2020-2032) (USD Billion)

9.3.1.9 Rest of Eastern Europe

9.3.1.9.1 Rest of Eastern Europe IoT in Smart Cities Market Estimates and Forecasts, By Offering (2020-2032) (USD Billion)

9.3.1.9.2 Rest of Eastern Europe IoT in Smart Cities Market Estimates and Forecasts, By Application (2020-2032) (USD Billion)

9.3.2 Western Europe

9.3.2.1 Trends Analysis

9.3.2.2 Western Europe IoT in Smart Cities Market Estimates and Forecasts, by Country (2020-2032) (USD Billion)

9.3.2.3 Western Europe IoT in Smart Cities Market Estimates and Forecasts, By Offering (2020-2032) (USD Billion) 

9.3.2.4 Western Europe IoT in Smart Cities Market Estimates and Forecasts, By Application (2020-2032) (USD Billion)

9.3.2.5 Germany

9.3.2.5.1 Germany IoT in Smart Cities Market Estimates and Forecasts, By Offering (2020-2032) (USD Billion)

9.3.2.5.2 Germany IoT in Smart Cities Market Estimates and Forecasts, By Application (2020-2032) (USD Billion)

9.3.2.6 France

9.3.2.6.1 France IoT in Smart Cities Market Estimates and Forecasts, By Offering (2020-2032) (USD Billion)

9.3.2.6.2 France IoT in Smart Cities Market Estimates and Forecasts, By Application (2020-2032) (USD Billion)

9.3.2.7 UK

9.3.2.7.1 UK IoT in Smart Cities Market Estimates and Forecasts, By Offering (2020-2032) (USD Billion)

9.3.2.7.2 UK IoT in Smart Cities Market Estimates and Forecasts, By Application (2020-2032) (USD Billion)

9.3.2.8 Italy

9.3.2.8.1 Italy IoT in Smart Cities Market Estimates and Forecasts, By Offering (2020-2032) (USD Billion)

9.3.2.8.2 Italy IoT in Smart Cities Market Estimates and Forecasts, By Application (2020-2032) (USD Billion)

9.3.2.9 Spain

9.3.2.9.1 Spain IoT in Smart Cities Market Estimates and Forecasts, By Offering (2020-2032) (USD Billion)

9.3.2.9.2 Spain IoT in Smart Cities Market Estimates and Forecasts, By Application (2020-2032) (USD Billion)

9.3.2.10 Netherlands

9.3.2.10.1 Netherlands IoT in Smart Cities Market Estimates and Forecasts, By Offering (2020-2032) (USD Billion)

9.3.2.10.2 Netherlands IoT in Smart Cities Market Estimates and Forecasts, By Application (2020-2032) (USD Billion)

9.3.2.11 Switzerland

9.3.2.11.1 Switzerland IoT in Smart Cities Market Estimates and Forecasts, By Offering (2020-2032) (USD Billion)

9.3.2.11.2 Switzerland IoT in Smart Cities Market Estimates and Forecasts, By Application (2020-2032) (USD Billion)

9.3.2.12 Austria

9.3.2.12.1 Austria IoT in Smart Cities Market Estimates and Forecasts, By Offering (2020-2032) (USD Billion)

9.3.2.12.2 Austria IoT in Smart Cities Market Estimates and Forecasts, By Application (2020-2032) (USD Billion)

9.3.2.13 Rest of Western Europe

9.3.2.13.1 Rest of Western Europe IoT in Smart Cities Market Estimates and Forecasts, By Offering (2020-2032) (USD Billion)

9.3.2.13.2 Rest of Western Europe IoT in Smart Cities Market Estimates and Forecasts, By Application (2020-2032) (USD Billion)

9.4 Asia Pacific

9.4.1 Trends Analysis

9.4.2 Asia Pacific IoT in Smart Cities Market Estimates and Forecasts, by Country (2020-2032) (USD Billion)

9.4.3 Asia Pacific IoT in Smart Cities Market Estimates and Forecasts, By Offering (2020-2032) (USD Billion) 

9.4.4 Asia Pacific IoT in Smart Cities Market Estimates and Forecasts, By Application (2020-2032) (USD Billion)

9.4.5 China

9.4.5.1 China IoT in Smart Cities Market Estimates and Forecasts, By Offering (2020-2032) (USD Billion)

9.4.5.2 China IoT in Smart Cities Market Estimates and Forecasts, By Application (2020-2032) (USD Billion)

9.4.6 India

9.4.5.1 India IoT in Smart Cities Market Estimates and Forecasts, By Offering (2020-2032) (USD Billion)

9.4.5.2 India IoT in Smart Cities Market Estimates and Forecasts, By Application (2020-2032) (USD Billion)

9.4.5 Japan

9.4.5.1 Japan IoT in Smart Cities Market Estimates and Forecasts, By Offering (2020-2032) (USD Billion)

9.4.5.2 Japan IoT in Smart Cities Market Estimates and Forecasts, By Application (2020-2032) (USD Billion)

9.4.6 South Korea

9.4.6.1 South Korea IoT in Smart Cities Market Estimates and Forecasts, By Offering (2020-2032) (USD Billion)

9.4.6.2 South Korea IoT in Smart Cities Market Estimates and Forecasts, By Application (2020-2032) (USD Billion)

9.4.7 Vietnam

9.4.7.1 Vietnam IoT in Smart Cities Market Estimates and Forecasts, By Offering (2020-2032) (USD Billion)

9.2.7.2 Vietnam IoT in Smart Cities Market Estimates and Forecasts, By Application (2020-2032) (USD Billion)

9.4.8 Singapore

9.4.8.1 Singapore IoT in Smart Cities Market Estimates and Forecasts, By Offering (2020-2032) (USD Billion)

9.4.8.2 Singapore IoT in Smart Cities Market Estimates and Forecasts, By Application (2020-2032) (USD Billion)

9.4.9 Australia

9.4.9.1 Australia IoT in Smart Cities Market Estimates and Forecasts, By Offering (2020-2032) (USD Billion)

9.4.9.2 Australia IoT in Smart Cities Market Estimates and Forecasts, By Application (2020-2032) (USD Billion)

9.4.10 Rest of Asia Pacific

9.4.10.1 Rest of Asia Pacific IoT in Smart Cities Market Estimates and Forecasts, By Offering (2020-2032) (USD Billion)

9.4.10.2 Rest of Asia Pacific IoT in Smart Cities Market Estimates and Forecasts, By Application (2020-2032) (USD Billion)

9.5 Middle East and Africa

9.5.1 Middle East

9.5.1.1 Trends Analysis

9.5.1.2 Middle East IoT in Smart Cities Market Estimates and Forecasts, by Country (2020-2032) (USD Billion)

9.5.1.3 Middle East IoT in Smart Cities Market Estimates and Forecasts, By Offering (2020-2032) (USD Billion) 

9.5.1.4 Middle East IoT in Smart Cities Market Estimates and Forecasts, By Application (2020-2032) (USD Billion)

9.5.1.5 UAE

9.5.1.5.1 UAE IoT in Smart Cities Market Estimates and Forecasts, By Offering (2020-2032) (USD Billion)

9.5.1.5.2 UAE IoT in Smart Cities Market Estimates and Forecasts, By Application (2020-2032) (USD Billion)

9.5.1.6 Egypt

9.5.1.6.1 Egypt IoT in Smart Cities Market Estimates and Forecasts, By Offering (2020-2032) (USD Billion)

9.5.1.6.2 Egypt IoT in Smart Cities Market Estimates and Forecasts, By Application (2020-2032) (USD Billion)

9.5.1.7 Saudi Arabia

9.5.1.7.1 Saudi Arabia IoT in Smart Cities Market Estimates and Forecasts, By Offering (2020-2032) (USD Billion)

9.5.1.7.2 Saudi Arabia IoT in Smart Cities Market Estimates and Forecasts, By Application (2020-2032) (USD Billion)

9.5.1.8 Qatar

9.5.1.8.1 Qatar IoT in Smart Cities Market Estimates and Forecasts, By Offering (2020-2032) (USD Billion)

9.5.1.8.2 Qatar IoT in Smart Cities Market Estimates and Forecasts, By Application (2020-2032) (USD Billion)

9.5.1.9 Rest of Middle East

9.5.1.9.1 Rest of Middle East IoT in Smart Cities Market Estimates and Forecasts, By Offering (2020-2032) (USD Billion)

9.5.1.9.2 Rest of Middle East IoT in Smart Cities Market Estimates and Forecasts, By Application (2020-2032) (USD Billion)

9.5.2 Africa

9.5.2.1 Trends Analysis

9.5.2.2 Africa IoT in Smart Cities Market Estimates and Forecasts, by Country (2020-2032) (USD Billion)

9.5.2.3 Africa IoT in Smart Cities Market Estimates and Forecasts, By Offering (2020-2032) (USD Billion) 

9.5.2.4 Africa IoT in Smart Cities Market Estimates and Forecasts, By Application (2020-2032) (USD Billion)

9.5.2.5 South Africa

9.5.2.5.1 South Africa IoT in Smart Cities Market Estimates and Forecasts, By Offering (2020-2032) (USD Billion)

9.5.2.5.2 South Africa IoT in Smart Cities Market Estimates and Forecasts, By Application (2020-2032) (USD Billion)

9.5.2.6 Nigeria

9.5.2.6.1 Nigeria IoT in Smart Cities Market Estimates and Forecasts, By Offering (2020-2032) (USD Billion)

9.5.2.6.2 Nigeria IoT in Smart Cities Market Estimates and Forecasts, By Application (2020-2032) (USD Billion)

9.5.2.7 Rest of Africa

9.5.2.7.1 Rest of Africa IoT in Smart Cities Market Estimates and Forecasts, By Offering (2020-2032) (USD Billion)

9.5.2.7.2 Rest of Africa IoT in Smart Cities Market Estimates and Forecasts, By Application (2020-2032) (USD Billion)

9.6 Latin America

9.6.1 Trends Analysis

9.6.2 Latin America IoT in Smart Cities Market Estimates and Forecasts, by Country (2020-2032) (USD Billion)

9.6.3 Latin America IoT in Smart Cities Market Estimates and Forecasts, By Offering (2020-2032) (USD Billion) 

9.6.4 Latin America IoT in Smart Cities Market Estimates and Forecasts, By Application (2020-2032) (USD Billion)

9.6.5 Brazil

9.6.5.1 Brazil IoT in Smart Cities Market Estimates and Forecasts, By Offering (2020-2032) (USD Billion)

9.6.5.2 Brazil IoT in Smart Cities Market Estimates and Forecasts, By Application (2020-2032) (USD Billion)

9.6.6 Argentina

9.6.6.1 Argentina IoT in Smart Cities Market Estimates and Forecasts, By Offering (2020-2032) (USD Billion)

9.6.6.2 Argentina IoT in Smart Cities Market Estimates and Forecasts, By Application (2020-2032) (USD Billion)

9.6.7 Colombia

9.6.7.1 Colombia IoT in Smart Cities Market Estimates and Forecasts, By Offering (2020-2032) (USD Billion)

9.6.7.2 Colombia IoT in Smart Cities Market Estimates and Forecasts, By Application (2020-2032) (USD Billion)

9.6.8 Rest of Latin America

9.6.8.1 Rest of Latin America IoT in Smart Cities Market Estimates and Forecasts, By Offering (2020-2032) (USD Billion)

9.6.8.2 Rest of Latin America IoT in Smart Cities Market Estimates and Forecasts, By Application (2020-2032) (USD Billion)

10. Company Profiles

10.1 Cisco Systems Inc

10.1.1 Company Overview

10.1.2 Financial

10.1.3 Products/ Services Offered

110.1.4 SWOT Analysis

10.2 IBM Corporation

10.2.1 Company Overview

10.2.2 Financial

10.2.3 Products/ Services Offered

10.2.4 SWOT Analysis

10.3 Huawei Technologies Co. Ltd

10.3.1 Company Overview

10.3.2 Financial

10.3.3 Products/ Services Offered

10.3.4 SWOT Analysis

10.4 Intel Corporation

10.4.1 Company Overview

10.4.2 Financial

10.4.3 Products/ Services Offered

10.4.4 SWOT Analysis

10.5 Microsoft Corporation

10.5.1 Company Overview

10.5.2 Financial

10.5.3 Products/ Services Offered

10.5.4 SWOT Analysis

10.6 Robert Bosch GmbH

10.6.1 Company Overview

10.6.2 Financial

10.6.3 Products/ Services Offered

10.6.4 SWOT Analysis

10.7 PTC

10.7.1 Company Overview

10.7.2 Financial

10.7.3 Products/ Services Offered

10.7.4 SWOT Analysis

10.8 Siemens AG

10.8.1 Company Overview

10.8.2 Financial

10.8.3 Products/ Services Offered

10.8.4 SWOT Analysis

10.9 Verizon Communications

             10.9.1 Company Overview

10.9.2 Financial

10.9.3 Products/ Services Offered

10.9.4 SWOT Analysis

10.10 Honeywell International Inc.

             10.9.1 Company Overview

10.9.2 Financial

10.9.3 Products/ Services Offered

10.9.4 SWOT Analysis

11. Use Cases and Best Practices

12. Conclusion

An accurate research report requires proper strategizing as well as implementation. There are multiple factors involved in the completion of good and accurate research report and selecting the best methodology to compete the research is the toughest part. Since the research reports we provide play a crucial role in any company’s decision-making process, therefore we at SNS Insider always believe that we should choose the best method which gives us results closer to reality. This allows us to reach at a stage wherein we can provide our clients best and accurate investment to output ratio.

Each report that we prepare takes a timeframe of 350-400 business hours for production. Starting from the selection of titles through a couple of in-depth brain storming session to the final QC process before uploading our titles on our website we dedicate around 350 working hours. The titles are selected based on their current market cap and the foreseen CAGR and growth.


The 5 steps process:

Step 1: Secondary Research:

Secondary Research or Desk Research is as the name suggests is a research process wherein, we collect data through the readily available information. In this process we use various paid and unpaid databases which our team has access to and gather data through the same. This includes examining of listed companies’ annual reports, Journals, SEC filling etc. Apart from this our team has access to various associations across the globe across different industries. Lastly, we have exchange relationships with various university as well as individual libraries.

Secondary Research

Step 2: Primary Research

When we talk about primary research, it is a type of study in which the researchers collect relevant data samples directly, rather than relying on previously collected data.  This type of research is focused on gaining content specific facts that can be sued to solve specific problems. Since the collected data is fresh and first hand therefore it makes the study more accurate and genuine.

We at SNS Insider have divided Primary Research into 2 parts.

Part 1 wherein we interview the KOLs of major players as well as the upcoming ones across various geographic regions. This allows us to have their view over the market scenario and acts as an important tool to come closer to the accurate market numbers. As many as 45 paid and unpaid primary interviews are taken from both the demand and supply side of the industry to make sure we land at an accurate judgement and analysis of the market.

This step involves the triangulation of data wherein our team analyses the interview transcripts, online survey responses and observation of on filed participants. The below mentioned chart should give a better understanding of the part 1 of the primary interview.

Primary Research

Part 2: In this part of primary research the data collected via secondary research and the part 1 of the primary research is validated with the interviews from individual consultants and subject matter experts.

Consultants are those set of people who have at least 12 years of experience and expertise within the industry whereas Subject Matter Experts are those with at least 15 years of experience behind their back within the same space. The data with the help of two main processes i.e., FGDs (Focused Group Discussions) and IDs (Individual Discussions). This gives us a 3rd party nonbiased primary view of the market scenario making it a more dependable one while collation of the data pointers.

Step 3: Data Bank Validation

Once all the information is collected via primary and secondary sources, we run that information for data validation. At our intelligence centre our research heads track a lot of information related to the market which includes the quarterly reports, the daily stock prices, and other relevant information. Our data bank server gets updated every fortnight and that is how the information which we collected using our primary and secondary information is revalidated in real time.

Data Bank Validation

Step 4: QA/QC Process

After all the data collection and validation our team does a final level of quality check and quality assurance to get rid of any unwanted or undesired mistakes. This might include but not limited to getting rid of the any typos, duplication of numbers or missing of any important information. The people involved in this process include technical content writers, research heads and graphics people. Once this process is completed the title gets uploader on our platform for our clients to read it.

Step 5: Final QC/QA Process:

This is the last process and comes when the client has ordered the study. In this process a final QA/QC is done before the study is emailed to the client. Since we believe in giving our clients a good experience of our research studies, therefore, to make sure that we do not lack at our end in any way humanly possible we do a final round of quality check and then dispatch the study to the client.

MARKET SEGMENTATION

By Offering

  • Solutions

    • Remote Monitoring

    • Real-time Location System

    • Data Management

    • Reporting and analytics

    • Security

    • Network Management

  • Services

    • Professional Services

      • Consulting

      • System Integration and Deployment

      • Support and Maintenance

    • Managed Services

By Application

  • Smart Transportation

  • Smart Building

  • Smart Utilities

  • Smart Citizen Services

    • Education

    • Healthcare

    • Public Safety

Request for Segment Customization as per your Business Requirement: Segment Customization Request

REGIONAL COVERAGE:

North America

  • US

  • Canada

  • Mexico

Europe

  • Eastern Europe

    • Poland

    • Romania

    • Hungary

    • Turkey

    • Rest of Eastern Europe

  • Western Europe

    • Germany

    • France

    • UK

    • Italy

    • Spain

    • Netherlands

    • Switzerland

    • Austria

    • Rest of Western Europe

Asia Pacific

  • China

  • India

  • Japan

  • South Korea

  • Vietnam

  • Singapore

  • Australia

  • Rest of Asia Pacific

Middle East & Africa

  • Middle East

    • UAE

    • Egypt

    • Saudi Arabia

    • Qatar

    • Rest of the Middle East

  • Africa

    • Nigeria

    • South Africa

    • Rest of Africa

Latin America

  • Brazil

  • Argentina

  • Colombia

  • Rest Of Latin America

Request for Country Level Research Report: Country Level Customization Request

Available Customization

With the given market data, SNS Insider offers customization as per the company’s specific needs. The following customization options are available for the report:

  • Product Analysis

  • Criss-Cross segment analysis (e.g. Product X Application)

  • Product Matrix which gives a detailed comparison of product portfolio of each company

  • Geographic Analysis

  • Additional countries in any of the regions

  • Company Information

  • Detailed analysis and profiling of additional market players


  •            5000 (33% Discount)


  •            8950 (40% Discount)


  •            3050 (23% Discount)

Start a Conversation

Hi! Click one of our member below to chat on Phone