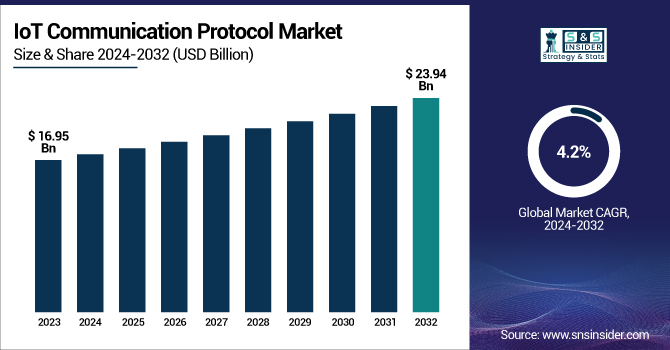
The IoT Communication Protocol Market Size was valued at USD 16.95 Billion in 2023 and is expected to reach USD 23.94 Billion by 2032 and grow at a CAGR of 4.2% over the forecast period 2024-2032.
The IoT Communication Protocol Market is witnessing rapid growth, driven by the surge in connected devices and the need for smooth data exchange. Protocols like Zigbee, NB-IoT, and Bluetooth Low Energy (BLE) are increasingly used in smart homes, healthcare, and industrial applications. BLE-enabled wearables now make up over 40% of healthcare devices, boosting real-time monitoring. LPWAN technologies such as LoRa have reduced smart city and agriculture costs by up to 25%. MQTT has enhanced mission-critical performance by lowering device-to-cloud latency by 15–20%. These advancements highlight the essential role of protocols in improving IoT efficiency, security, and scalability.
The U.S. IoT Communication Protocol Market size was USD 4.76 billion in 2023 and is expected to reach USD 6.0 billion by 2032, growing at a CAGR of 2.64% over the forecast period of 2024–2032.
The U.S. IoT Communication Protocol Market is witnessing rapid advancement, fueled by the growing number of connected devices and the rising need for smooth interoperability across diverse sectors. Progress in low-power wide-area networks (LPWANs) and the ongoing expansion of 5G infrastructure are significantly boosting communication efficiency, enabling broader adoption of IoT technologies in fields like healthcare, automotive, and smart home applications. The widespread use of smart devices and automation tools highlights the vital importance of reliable communication protocols to ensure fast, secure, and seamless data transmission across the expanding IoT ecosystem.
Key Drivers:
Rising Integration of IoT Devices Across Industries Drives IoT Communication Protocol Market Growth
The increasing use of IoT devices across industries such as healthcare, manufacturing, automotive, and smart homes is a major driver for the IoT Communication Protocol Market. As businesses and consumers demand real-time data and automated processes, the need for efficient communication between devices becomes critical. Protocols like Zigbee, NB-IoT, Bluetooth Low Energy (BLE), and MQTT are enabling seamless data exchange, energy efficiency, and low-latency communication across networks.
For example, in industrial settings, these protocols help reduce downtime through predictive maintenance, while in healthcare, they support continuous monitoring via connected wearables.
The ongoing rollout of 5G technology and the increasing popularity of edge computing further amplify this demand, allowing faster and more reliable connections. With the number of connected IoT devices expected to continue rising sharply, the communication protocol infrastructure supporting them becomes an essential pillar for ensuring smooth operation, thereby fueling market growth significantly.
Restrain:
Security Concerns and Data Privacy Issues Restrain IoT Communication Protocol Market Growth
Despite growing adoption, significant concerns around data privacy and security act as key restraints for the IoT Communication Protocol Market. As billions of connected devices share sensitive data, any vulnerability in communication protocols can lead to breaches, data theft, or system compromise. In sectors like healthcare and finance, where data sensitivity is paramount, this becomes even more critical. Many IoT devices have limited processing power, making it difficult to implement strong encryption and robust authentication protocols.
Additionally, inconsistent security standards across various communication technologies contribute to this issue, creating gaps that attackers can exploit. High-profile cyberattacks have already highlighted the risks of unsecured IoT networks, leading to stricter regulatory scrutiny. These challenges can delay adoption or increase implementation costs, especially for small and medium enterprises. Therefore, unless there is substantial improvement in protocol security standards, data protection remains a significant hurdle in the broader deployment of IoT communication solutions.
Opportunities:
Emerging Smart City and Infrastructure Projects Create New Opportunities in IoT Communication Protocol Market
The rise of smart cities and infrastructure modernization presents a significant growth opportunity for the IoT Communication Protocol Market. Governments and municipalities are increasingly deploying smart solutions for traffic management, energy optimization, public safety, and waste management, all of which rely heavily on interconnected devices. To ensure real-time communication and decision-making, these systems require robust and scalable communication protocols capable of handling large volumes of data with minimal latency. Protocols like LoRaWAN and NB-IoT are particularly valuable in this space due to their long-range capabilities and energy efficiency. The integration of AI and edge computing into these systems further necessitates precise, secure, and fast communication layers. With global investment in smart city initiatives rising, there is a growing need for communication infrastructures that can support large-scale deployments. As a result, protocol developers and IoT solution providers have a prime opportunity to innovate and offer solutions tailored to urban digital transformation.
Challenges:
Interoperability Challenges Among Diverse IoT Communication Protocols Pose Barriers in IoT Communication Protocol Market
The IoT Communication Protocol Market is achieving seamless interoperability among a wide range of devices and communication standards. With a multitude of protocols like Zigbee, Z-Wave, BLE, Wi-Fi, NB-IoT, and others in use, ensuring compatibility between them becomes complex and often requires additional hardware or middleware. This fragmentation can lead to increased system complexity, higher deployment costs, and reduced scalability. In industrial and commercial applications where multiple vendors and devices are involved, lack of standardization can delay integration and limit operational efficiency. Developers and integrators are often forced to choose between performance and compatibility, which can compromise the effectiveness of the overall IoT ecosystem. While some industry alliances are working toward unified frameworks, the slow pace of adoption and lack of consensus remain significant barriers. Overcoming these interoperability issues is crucial for unlocking the full potential of IoT and achieving truly interconnected environments.
By Type
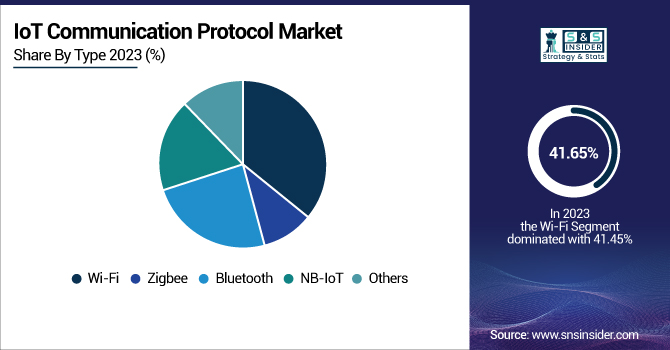
The Wi-Fi segment continues to dominate the IoT Communication Protocol Market due to its widespread availability, high data transfer rates, and increasing integration into smart devices. In 2023, Wi-Fi accounted for the largest share, particularly driven by its adoption in smart homes, consumer electronics, and enterprise IoT systems. The surge in smart home hubs, routers, and connected appliances has significantly increased the demand for robust and reliable Wi-Fi connectivity.
Additionally, Wi-Fi-based smart plugs, thermostats, and surveillance systems have seen rapid consumer adoption, reinforcing the protocol’s central role in the ecosystem. As more devices operate on higher frequencies and require stable broadband connections, Wi-Fi remains a cornerstone for seamless IoT communication across both residential and commercial environments.
Bluetooth technology, particularly Bluetooth Low Energy (BLE), is witnessing the fastest growth in the IoT Communication Protocol Market due to its low power consumption and seamless connectivity across short ranges. Its integration into wearable devices, health monitors, smart locks, and asset-tracking systems is expanding, fueling its high CAGR. With the rise in fitness trackers, smartwatches, and wireless medical sensors, Bluetooth is becoming essential for real-time data transmission with minimal battery usage.
Moreover, Bluetooth Mesh networking is being adopted in commercial buildings for smart lighting and HVAC systems, boosting efficiency in large-scale operations. As smart environments become more interconnected, the demand for scalable, secure, and lightweight communication protocols like Bluetooth continues to grow, establishing its role as a key driver in the evolving IoT landscape.
By Application
The Consumer Electronics segment holds the largest share in the IoT Communication Protocol Market due to the increasing use of connected devices in daily life. From smart TVs, speakers, and kitchen appliances to wearables and home security systems, the need for reliable communication protocols like Wi-Fi, Bluetooth, and Zigbee is more critical than ever. In 2023, the rapid deployment of voice assistants, smart thermostats, and IoT-enabled entertainment systems drove significant protocol integration to ensure real-time interaction and energy efficiency.
Additionally, the increasing preference for smart home ecosystems has boosted demand for devices that communicate seamlessly, strengthening the role of advanced protocols in the segment. As personalization, convenience, and automation become priorities for consumers, communication protocols remain the backbone enabling intuitive and responsive consumer electronics experiences.
The Automotive and Transportation segment is experiencing the fastest growth in the IoT Communication Protocol Market, fueled by the rising demand for connected vehicles, fleet management, and smart traffic systems. Advanced driver-assistance systems (ADAS), in-car infotainment, predictive maintenance, and real-time navigation rely heavily on efficient communication protocols like Bluetooth, Wi-Fi, and cellular-based solutions. Recent innovations in vehicle-to-everything (V2X) communication have encouraged automakers to integrate protocols that support rapid, secure, and low-latency data transmission between vehicles, infrastructure, and networks.
Moreover, commercial fleet operators are adopting IoT solutions for tracking, route optimization, and performance monitoring, boosting protocol utilization in logistics. As autonomous and electric vehicle adoption grows, the need for robust communication systems within and outside the vehicle will further accelerate, making the automotive sector a pivotal contributor to the expanding protocol market.
In 2023, North America accounted for the largest market share in the IoT Communication Protocol Market, estimated to be around 42%. This dominance is primarily attributed to the widespread adoption of connected technologies across industries such as healthcare, smart homes, manufacturing, and transportation. The region's early adoption of 5G infrastructure, along with the presence of leading tech companies and strong regulatory support for IoT security standards, has created a favorable environment for market growth.
For instance, the growing use of smart home devices like voice assistants, connected thermostats, and surveillance systems has amplified the need for reliable communication protocols such as Zigbee, Wi-Fi, and Bluetooth.
Additionally, industrial IoT (IIoT) solutions deployed in U.S. manufacturing plants and logistics operations rely heavily on robust and low-latency communication systems, further boosting the region's market dominance.
Asia Pacific is emerging as the fastest growing region in the IoT Communication Protocol Market, with an estimated CAGR of around 5.95% during the forecast period. The region's rapid urbanization, expanding smart city initiatives, and increasing industrial automation are key growth drivers. Countries like China, Japan, South Korea, and India are investing heavily in IoT infrastructure, leading to the widespread deployment of protocols such as NB-IoT, LoRa, and Zigbee.
For example, smart metering systems, traffic monitoring solutions, and agricultural IoT applications across the region are being equipped with low-power communication technologies to optimize energy usage and operational efficiency.
Moreover, the surge in smartphone penetration and wearable device usage in Asia Pacific is accelerating the demand for efficient, scalable communication standards. This dynamic market growth is further supported by government initiatives aimed at fostering digital transformation across sectors.
Huawei Technologies (OceanConnect IoT Platform, LiteOS)
Arm Holdings (Mbed OS, Cortex‑M33 Processor)
Texas Instruments (SimpleLink CC3220 Wi‑Fi MCU, SimpleLink CC2652 Multiprotocol Wireless MCU)
Intel (XMM 7115 NB‑IoT Modem, XMM 7315 LTE‑M/NB‑IoT Modem)
Cisco Systems (Catalyst IR1101 Rugged Router, IoT Control Center)
NXP Semiconductors (LPC55S6x Cortex‑M33 MCU, EdgeLock SE050 Secure Element)
STMicroelectronics (STM32WL5x LoRaWAN Wireless MCU, SPIRIT1 Sub‑GHz Transceiver)
Thales (Cinterion TX62 LTE‑M/NB‑IoT Module, Cinterion ENS22 NB‑IoT Module)
Zebra Technologies (Savanna IoT Platform, SmartLens for Retail Asset Visibility)
Wind River (Helix Virtualization Platform, Helix Device Cloud)
Ericsson (IoT Accelerator, Connected Vehicle Cloud)
Qualcomm (IoT Services Suite, AllJoyn Framework)
Samsung Electronics (ARTIK Secure IoT Modules, SmartThings Cloud)
IBM (Watson IoT Platform, Watson IoT Message Gateway)
March 2025: During MWC Barcelona 2025, Huawei unveiled a collaborative platform for the IEEE P2413.2 Power Distribution IoT (PDIoT) Reference Architecture Standards. This initiative aims to drive digital transformation in the power sector by promoting industry consensus and commercial deployment of a new core architecture in the 5G-Advanced era.
February 2025: Arm Holdings collaborated with Intel, Qualcomm, and other industry leaders to form the Ambient IoT Alliance (AIoTA). The alliance's mission is to promote and support the development of an open, harmonized, and aligned multi-standard ecosystem for ambient IoT solutions, enhancing interoperability and scalability in IoT communications.
February 2025: Intel joined forces with Qualcomm, Arm Holdings, and other companies to establish the Ambient IoT Alliance (AIoTA). This collaboration aims to scale up the ambient IoT ecosystem by developing an open and harmonized multi-standard framework, facilitating the seamless integration of IoT devices across various platforms.
Report Attributes | Details |
---|---|
Market Size in 2023 | US$ 16.59 Billion |
Market Size by 2032 | US$ 23.94 Billion |
CAGR | CAGR of 4.2 % From 2024 to 2032 |
Base Year | 2023 |
Forecast Period | 2024-2032 |
Historical Data | 2020-2022 |
Report Scope & Coverage | Market Size, Segments Analysis, Competitive Landscape, Regional Analysis, DROC & SWOT Analysis, Forecast Outlook |
Key Segments | • By Type (Wi-Fi, Bluetooth, Zigbee, NB-IoT, Others) • By Application (Consumer Electronics, Automotive & Transportation, Building Automation, Healthcare, Others) |
Regional Analysis/Coverage | North America (US, Canada, Mexico), Europe (Eastern Europe [Poland, Romania, Hungary, Turkey, Rest of Eastern Europe] Western Europe] Germany, France, UK, Italy, Spain, Netherlands, Switzerland, Austria, Rest of Western Europe]), Asia Pacific (China, India, Japan, South Korea, Vietnam, Singapore, Australia, Rest of Asia Pacific), Middle East & Africa (Middle East [UAE, Egypt, Saudi Arabia, Qatar, Rest of Middle East], Africa [Nigeria, South Africa, Rest of Africa], Latin America (Brazil, Argentina, Colombia, Rest of Latin America) |
Company Profiles | Huawei Technologies, Arm Holdings, Texas Instruments, Intel, Cisco Systems, NXP Semiconductors, STMicroelectronics, Thales, Zebra Technologies, Wind River, Ericsson, Qualcomm, Samsung Electronics, and IBM. |
Ans: The IoT Communication Protocol Market is expected to grow at a CAGR of 4.2% during 2024-2032.
Ans: The IoT Communication Protocol Market size was USD 16.95 billion in 2023 and is expected to reach USD 23.94 billion by 2032.
Ans: The major growth factor of the IoT Communication Protocol Market is the rising adoption of connected devices across industries requiring seamless and secure data exchange.
Ans: The Consumer Electronics segment dominated the IoT Communication Protocol Market.
Ans: North America dominated the IoT Communication Protocol Market in 2023.
Table of Contents
1. Introduction
1.1 Market Definition
1.2 Scope (Inclusion and Exclusions)
1.3 Research Assumptions
2. Executive Summary
2.1 Market Overview
2.2 Regional Synopsis
2.3 Competitive Summary
3. Research Methodology
3.1 Top-Down Approach
3.2 Bottom-up Approach
3.3. Data Validation
3.4 Primary Interviews
4. Market Dynamics Impact Analysis
4.1 Market Driving Factors Analysis
4.1.2 Drivers
4.1.2 Restraints
4.1.3 Opportunities
4.1.4 Challenges
4.2 PESTLE Analysis
4.3 Porter’s Five Forces Model
5. Statistical Insights and Trends Reporting
5.1 Protocol Efficiency Metrics (2023)
5.2 Security Enhancements
5.3 Infrastructure and Network Expansion (2023)
5.4 Device Connectivity Trends
6. Competitive Landscape
6.1 List of Major Companies, By Region
6.2 Market Share Analysis, By Region
6.3 Product Benchmarking
6.3.1 Product specifications and features
6.3.2 Pricing
6.4 Strategic Initiatives
6.4.1 Marketing and promotional activities
6.4.2 Distribution and supply chain strategies
6.4.3 Expansion plans and new product launches
6.4.4 Strategic partnerships and collaborations
6.5 Technological Advancements
6.6 Market Positioning and Branding
7. IoT Communication Protocol Market Segmentation, By Type
7.1 Chapter Overview
7.2 Wi-Fi
7.2.1 Wi-Fi Market Trends Analysis (2020-2032)
7.2.2 Wi-Fi Market Size Estimates and Forecasts to 2032 (USD Billion)
7.3 Bluetooth
7.3.1 Bluetooth Market Trends Analysis (2020-2032)
7.3.2 Bluetooth Market Size Estimates and Forecasts to 2032 (USD Billion)
7.4 Zigbee
7.4.1 Zigbee Market Trends Analysis (2020-2032)
7.4.2 Zigbee Market Size Estimates and Forecasts to 2032 (USD Billion)
7.5 NB-IoT
7.5.1 NB-IoT Market Trends Analysis (2020-2032)
7.5.2 NB-IoT Market Size Estimates and Forecasts to 2032 (USD Billion)
7.6 Others
7.6.1 Others Market Trends Analysis (2020-2032)
7.6.2 Others Market Size Estimates and Forecasts to 2032 (USD Billion)
8. IoT Communication Protocol Market Segmentation, By Application
8.1 Chapter Overview
8.2 Consumer Electronics
8.2.1 Consumer Electronics Market Trends Analysis (2020-2032)
8.2.2 Consumer Electronics Market Size Estimates and Forecasts to 2032 (USD Billion)
8.3 Automotive & Transportation
8.3.1 Automotive & Transportation Market Trends Analysis (2020-2032)
8.3.2 Automotive & Transportation Market Size Estimates and Forecasts to 2032 (USD Billion)
8.4 Building Automation
8.4.1 Building Automation Market Trends Analysis (2020-2032)
8.4.2 Building Automation Market Size Estimates and Forecasts to 2032 (USD Billion)
8.5 Healthcare
8.5.1 Healthcare Market Trends Analysis (2020-2032)
8.5.2 Healthcare Market Size Estimates and Forecasts to 2032 (USD Billion)
8.6 Others
8.6.1 Others Market Trends Analysis (2020-2032)
8.6.2 Others Market Size Estimates and Forecasts to 2032 (USD Billion)
9. Regional Analysis
9.1 Chapter Overview
9.2 North America
9.2.1 Trends Analysis
9.2.2 North America IoT Communication Protocol Market Estimates and Forecasts, by Country (2020-2032) (USD Billion)
9.2.3 North America IoT Communication Protocol Market Estimates and Forecasts, By Type (2020-2032) (USD Billion)
9.2.4 North America IoT Communication Protocol Market Estimates and Forecasts, By Application (2020-2032) (USD Billion)
9.2.5 USA
9.2.5.1 USA IoT Communication Protocol Market Estimates and Forecasts, By Type (2020-2032) (USD Billion)
9.2.5.2 USA IoT Communication Protocol Market Estimates and Forecasts, By Application (2020-2032) (USD Billion)
9.2.6 Canada
9.2.6.1 Canada IoT Communication Protocol Market Estimates and Forecasts, By Type (2020-2032) (USD Billion)
9.2.6.2 Canada IoT Communication Protocol Market Estimates and Forecasts, By Application (2020-2032) (USD Billion)
9.2.7 Mexico
9.2.7.1 Mexico IoT Communication Protocol Market Estimates and Forecasts, By Type (2020-2032) (USD Billion)
9.2.7.2 Mexico IoT Communication Protocol Market Estimates and Forecasts, By Application (2020-2032) (USD Billion)
9.3 Europe
9.3.1 Eastern Europe
9.3.1.1 Trends Analysis
9.3.1.2 Eastern Europe IoT Communication Protocol Market Estimates and Forecasts, by Country (2020-2032) (USD Billion)
9.3.1.3 Eastern Europe IoT Communication Protocol Market Estimates and Forecasts, By Type (2020-2032) (USD Billion)
9.3.1.4 Eastern Europe IoT Communication Protocol Market Estimates and Forecasts, By Application (2020-2032) (USD Billion)
9.3.1.5 Poland
9.3.1.5.1 Poland IoT Communication Protocol Market Estimates and Forecasts, By Type (2020-2032) (USD Billion)
9.3.1.5.2 Poland IoT Communication Protocol Market Estimates and Forecasts, By Application (2020-2032) (USD Billion)
9.3.1.6 Romania
9.3.1.6.1 Romania IoT Communication Protocol Market Estimates and Forecasts, By Type (2020-2032) (USD Billion)
9.3.1.6.2 Romania IoT Communication Protocol Market Estimates and Forecasts, By Application (2020-2032) (USD Billion)
9.3.1.7 Hungary
9.3.1.7.1 Hungary IoT Communication Protocol Market Estimates and Forecasts, By Type (2020-2032) (USD Billion)
9.3.1.7.2 Hungary IoT Communication Protocol Market Estimates and Forecasts, By Application (2020-2032) (USD Billion)
9.3.1.8 Turkey
9.3.1.8.1 Turkey IoT Communication Protocol Market Estimates and Forecasts, By Type (2020-2032) (USD Billion)
9.3.1.8.2 Turkey IoT Communication Protocol Market Estimates and Forecasts, By Application (2020-2032) (USD Billion)
9.3.1.9 Rest of Eastern Europe
9.3.1.9.1 Rest of Eastern Europe IoT Communication Protocol Market Estimates and Forecasts, By Type (2020-2032) (USD Billion)
9.3.1.9.2 Rest of Eastern Europe IoT Communication Protocol Market Estimates and Forecasts, By Application (2020-2032) (USD Billion)
9.3.2 Western Europe
9.3.2.1 Trends Analysis
9.3.2.2 Western Europe IoT Communication Protocol Market Estimates and Forecasts, by Country (2020-2032) (USD Billion)
9.3.2.3 Western Europe IoT Communication Protocol Market Estimates and Forecasts, By Type (2020-2032) (USD Billion)
9.3.2.4 Western Europe IoT Communication Protocol Market Estimates and Forecasts, By Application (2020-2032) (USD Billion)
9.3.2.5 Germany
9.3.2.5.1 Germany IoT Communication Protocol Market Estimates and Forecasts, By Type (2020-2032) (USD Billion)
9.3.2.5.2 Germany IoT Communication Protocol Market Estimates and Forecasts, By Application (2020-2032) (USD Billion)
9.3.2.6 France
9.3.2.6.1 France IoT Communication Protocol Market Estimates and Forecasts, By Type (2020-2032) (USD Billion)
9.3.2.6.2 France IoT Communication Protocol Market Estimates and Forecasts, By Application (2020-2032) (USD Billion)
9.3.2.7 UK
9.3.2.7.1 UK IoT Communication Protocol Market Estimates and Forecasts, By Type (2020-2032) (USD Billion)
9.3.2.7.2 UK IoT Communication Protocol Market Estimates and Forecasts, By Application (2020-2032) (USD Billion)
9.3.2.8 Italy
9.3.2.8.1 Italy IoT Communication Protocol Market Estimates and Forecasts, By Type (2020-2032) (USD Billion)
9.3.2.8.2 Italy IoT Communication Protocol Market Estimates and Forecasts, By Application (2020-2032) (USD Billion)
9.3.2.9 Spain
9.3.2.9.1 Spain IoT Communication Protocol Market Estimates and Forecasts, By Type (2020-2032) (USD Billion)
9.3.2.9.2 Spain IoT Communication Protocol Market Estimates and Forecasts, By Application (2020-2032) (USD Billion)
9.3.2.10 Netherlands
9.3.2.10.1 Netherlands IoT Communication Protocol Market Estimates and Forecasts, By Type (2020-2032) (USD Billion)
9.3.2.10.2 Netherlands IoT Communication Protocol Market Estimates and Forecasts, By Application (2020-2032) (USD Billion)
9.3.2.11 Switzerland
9.3.2.11.1 Switzerland IoT Communication Protocol Market Estimates and Forecasts, By Type (2020-2032) (USD Billion)
9.3.2.11.2 Switzerland IoT Communication Protocol Market Estimates and Forecasts, By Application (2020-2032) (USD Billion)
9.3.2.12 Austria
9.3.2.12.1 Austria IoT Communication Protocol Market Estimates and Forecasts, By Type (2020-2032) (USD Billion)
9.3.2.12.2 Austria IoT Communication Protocol Market Estimates and Forecasts, By Application (2020-2032) (USD Billion)
9.3.2.13 Rest of Western Europe
9.3.2.13.1 Rest of Western Europe IoT Communication Protocol Market Estimates and Forecasts, By Type (2020-2032) (USD Billion)
9.3.2.13.2 Rest of Western Europe IoT Communication Protocol Market Estimates and Forecasts, By Application (2020-2032) (USD Billion)
9.4 Asia Pacific
9.4.1 Trends Analysis
9.4.2 Asia Pacific IoT Communication Protocol Market Estimates and Forecasts, by Country (2020-2032) (USD Billion)
9.4.3 Asia Pacific IoT Communication Protocol Market Estimates and Forecasts, By Type (2020-2032) (USD Billion)
9.4.4 Asia Pacific IoT Communication Protocol Market Estimates and Forecasts, By Application (2020-2032) (USD Billion)
9.4.5 China
9.4.5.1 China IoT Communication Protocol Market Estimates and Forecasts, By Type (2020-2032) (USD Billion)
9.4.5.2 China IoT Communication Protocol Market Estimates and Forecasts, By Application (2020-2032) (USD Billion)
9.4.6 India
9.4.5.1 India IoT Communication Protocol Market Estimates and Forecasts, By Type (2020-2032) (USD Billion)
9.4.5.2 India IoT Communication Protocol Market Estimates and Forecasts, By Application (2020-2032) (USD Billion)
9.4.5 Japan
9.4.5.1 Japan IoT Communication Protocol Market Estimates and Forecasts, By Type (2020-2032) (USD Billion)
9.4.5.2 Japan IoT Communication Protocol Market Estimates and Forecasts, By Application (2020-2032) (USD Billion)
9.4.6 South Korea
9.4.6.1 South Korea IoT Communication Protocol Market Estimates and Forecasts, By Type (2020-2032) (USD Billion)
9.4.6.2 South Korea IoT Communication Protocol Market Estimates and Forecasts, By Application (2020-2032) (USD Billion)
9.4.7 Vietnam
9.4.7.1 Vietnam IoT Communication Protocol Market Estimates and Forecasts, By Type (2020-2032) (USD Billion)
9.2.7.2 Vietnam IoT Communication Protocol Market Estimates and Forecasts, By Application (2020-2032) (USD Billion)
9.4.8 Singapore
9.4.8.1 Singapore IoT Communication Protocol Market Estimates and Forecasts, By Type (2020-2032) (USD Billion)
9.4.8.2 Singapore IoT Communication Protocol Market Estimates and Forecasts, By Application (2020-2032) (USD Billion)
9.4.9 Australia
9.4.9.1 Australia IoT Communication Protocol Market Estimates and Forecasts, By Type (2020-2032) (USD Billion)
9.4.9.2 Australia IoT Communication Protocol Market Estimates and Forecasts, By Application (2020-2032) (USD Billion)
9.4.10 Rest of Asia Pacific
9.4.10.1 Rest of Asia Pacific IoT Communication Protocol Market Estimates and Forecasts, By Type (2020-2032) (USD Billion)
9.4.10.2 Rest of Asia Pacific IoT Communication Protocol Market Estimates and Forecasts, By Application (2020-2032) (USD Billion)
9.5 Middle East and Africa
9.5.1 Middle East
9.5.1.1 Trends Analysis
9.5.1.2 Middle East IoT Communication Protocol Market Estimates and Forecasts, by Country (2020-2032) (USD Billion)
9.5.1.3 Middle East IoT Communication Protocol Market Estimates and Forecasts, By Type (2020-2032) (USD Billion)
9.5.1.4 Middle East IoT Communication Protocol Market Estimates and Forecasts, By Application (2020-2032) (USD Billion)
9.5.1.5 UAE
9.5.1.5.1 UAE IoT Communication Protocol Market Estimates and Forecasts, By Type (2020-2032) (USD Billion)
9.5.1.5.2 UAE IoT Communication Protocol Market Estimates and Forecasts, By Application (2020-2032) (USD Billion)
9.5.1.6 Egypt
9.5.1.6.1 Egypt IoT Communication Protocol Market Estimates and Forecasts, By Type (2020-2032) (USD Billion)
9.5.1.6.2 Egypt IoT Communication Protocol Market Estimates and Forecasts, By Application (2020-2032) (USD Billion)
9.5.1.7 Saudi Arabia
9.5.1.7.1 Saudi Arabia IoT Communication Protocol Market Estimates and Forecasts, By Type (2020-2032) (USD Billion)
9.5.1.7.2 Saudi Arabia IoT Communication Protocol Market Estimates and Forecasts, By Application (2020-2032) (USD Billion)
9.5.1.8 Qatar
9.5.1.8.1 Qatar IoT Communication Protocol Market Estimates and Forecasts, By Type (2020-2032) (USD Billion)
9.5.1.8.2 Qatar IoT Communication Protocol Market Estimates and Forecasts, By Application (2020-2032) (USD Billion)
9.5.1.9 Rest of Middle East
9.5.1.9.1 Rest of Middle East IoT Communication Protocol Market Estimates and Forecasts, By Type (2020-2032) (USD Billion)
9.5.1.9.2 Rest of Middle East IoT Communication Protocol Market Estimates and Forecasts, By Application (2020-2032) (USD Billion)
9.5.2 Africa
9.5.2.1 Trends Analysis
9.5.2.2 Africa IoT Communication Protocol Market Estimates and Forecasts, by Country (2020-2032) (USD Billion)
9.5.2.3 Africa IoT Communication Protocol Market Estimates and Forecasts, By Type (2020-2032) (USD Billion)
9.5.2.4 Africa IoT Communication Protocol Market Estimates and Forecasts, By Application (2020-2032) (USD Billion)
9.5.2.5 South Africa
9.5.2.5.1 South Africa IoT Communication Protocol Market Estimates and Forecasts, By Type (2020-2032) (USD Billion)
9.5.2.5.2 South Africa IoT Communication Protocol Market Estimates and Forecasts, By Application (2020-2032) (USD Billion)
9.5.2.6 Nigeria
9.5.2.6.1 Nigeria IoT Communication Protocol Market Estimates and Forecasts, By Type (2020-2032) (USD Billion)
9.5.2.6.2 Nigeria IoT Communication Protocol Market Estimates and Forecasts, By Application (2020-2032) (USD Billion)
9.5.2.7 Rest of Africa
9.5.2.7.1 Rest of Africa IoT Communication Protocol Market Estimates and Forecasts, By Type (2020-2032) (USD Billion)
9.5.2.7.2 Rest of Africa IoT Communication Protocol Market Estimates and Forecasts, By Application (2020-2032) (USD Billion)
9.6 Latin America
9.6.1 Trends Analysis
9.6.2 Latin America IoT Communication Protocol Market Estimates and Forecasts, by Country (2020-2032) (USD Billion)
9.6.3 Latin America IoT Communication Protocol Market Estimates and Forecasts, By Type (2020-2032) (USD Billion)
9.6.4 Latin America IoT Communication Protocol Market Estimates and Forecasts, By Application (2020-2032) (USD Billion)
9.6.5 Brazil
9.6.5.1 Brazil IoT Communication Protocol Market Estimates and Forecasts, By Type (2020-2032) (USD Billion)
9.6.5.2 Brazil IoT Communication Protocol Market Estimates and Forecasts, By Application (2020-2032) (USD Billion)
9.6.6 Argentina
9.6.6.1 Argentina IoT Communication Protocol Market Estimates and Forecasts, By Type (2020-2032) (USD Billion)
9.6.6.2 Argentina IoT Communication Protocol Market Estimates and Forecasts, By Application (2020-2032) (USD Billion)
9.6.7 Colombia
9.6.7.1 Colombia IoT Communication Protocol Market Estimates and Forecasts, By Type (2020-2032) (USD Billion)
9.6.7.2 Colombia IoT Communication Protocol Market Estimates and Forecasts, By Application (2020-2032) (USD Billion)
9.6.8 Rest of Latin America
9.6.8.1 Rest of Latin America IoT Communication Protocol Market Estimates and Forecasts, By Type (2020-2032) (USD Billion)
9.6.8.2 Rest of Latin America IoT Communication Protocol Market Estimates and Forecasts, By Application (2020-2032) (USD Billion)
10. Company Profiles
10.1 Huawei Technologies
10.1.1 Company Overview
10.1.2 Financial
10.1.3 Products/ Services Offered
110.1.4 SWOT Analysis
10.2 Arm Holdings
10.2.1 Company Overview
10.2.2 Financial
10.2.3 Products/ Services Offered
10.2.4 SWOT Analysis
10.3 Texas Instruments
10.3.1 Company Overview
10.3.2 Financial
10.3.3 Products/ Services Offered
10.3.4 SWOT Analysis
10.4 Intel
10.4.1 Company Overview
10.4.2 Financial
10.4.3 Products/ Services Offered
10.4.4 SWOT Analysis
10.5 Cisco System
10.5.1 Company Overview
10.5.2 Financial
10.5.3 Products/ Services Offered
10.5.4 SWOT Analysis
10.6 IBM Corporation
10.6.1 Company Overview
10.6.2 Financial
10.6.3 Products/ Services Offered
10.6.4 SWOT Analysis
10.7 NXP Semiconductors
10.7.1 Company Overview
10.7.2 Financial
10.7.3 Products/ Services Offered
10.7.4 SWOT Analysis
10.8 STMicroelectronics
10.8.1 Company Overview
10.8.2 Financial
10.8.3 Products/ Services Offered
10.8.4 SWOT Analysis
10.9 Thales
10.9.1 Company Overview
10.9.2 Financial
10.9.3 Products/ Services Offered
10.9.4 SWOT Analysis
10.10 Zebra Technologies
10.9.1 Company Overview
10.9.2 Financial
10.9.3 Products/ Services Offered
10.9.4 SWOT Analysis
11. Use Cases and Best Practices
12. Conclusion
An accurate research report requires proper strategizing as well as implementation. There are multiple factors involved in the completion of good and accurate research report and selecting the best methodology to compete the research is the toughest part. Since the research reports we provide play a crucial role in any company’s decision-making process, therefore we at SNS Insider always believe that we should choose the best method which gives us results closer to reality. This allows us to reach at a stage wherein we can provide our clients best and accurate investment to output ratio.
Each report that we prepare takes a timeframe of 350-400 business hours for production. Starting from the selection of titles through a couple of in-depth brain storming session to the final QC process before uploading our titles on our website we dedicate around 350 working hours. The titles are selected based on their current market cap and the foreseen CAGR and growth.
The 5 steps process:
Step 1: Secondary Research:
Secondary Research or Desk Research is as the name suggests is a research process wherein, we collect data through the readily available information. In this process we use various paid and unpaid databases which our team has access to and gather data through the same. This includes examining of listed companies’ annual reports, Journals, SEC filling etc. Apart from this our team has access to various associations across the globe across different industries. Lastly, we have exchange relationships with various university as well as individual libraries.
Step 2: Primary Research
When we talk about primary research, it is a type of study in which the researchers collect relevant data samples directly, rather than relying on previously collected data. This type of research is focused on gaining content specific facts that can be sued to solve specific problems. Since the collected data is fresh and first hand therefore it makes the study more accurate and genuine.
We at SNS Insider have divided Primary Research into 2 parts.
Part 1 wherein we interview the KOLs of major players as well as the upcoming ones across various geographic regions. This allows us to have their view over the market scenario and acts as an important tool to come closer to the accurate market numbers. As many as 45 paid and unpaid primary interviews are taken from both the demand and supply side of the industry to make sure we land at an accurate judgement and analysis of the market.
This step involves the triangulation of data wherein our team analyses the interview transcripts, online survey responses and observation of on filed participants. The below mentioned chart should give a better understanding of the part 1 of the primary interview.
Part 2: In this part of primary research the data collected via secondary research and the part 1 of the primary research is validated with the interviews from individual consultants and subject matter experts.
Consultants are those set of people who have at least 12 years of experience and expertise within the industry whereas Subject Matter Experts are those with at least 15 years of experience behind their back within the same space. The data with the help of two main processes i.e., FGDs (Focused Group Discussions) and IDs (Individual Discussions). This gives us a 3rd party nonbiased primary view of the market scenario making it a more dependable one while collation of the data pointers.
Step 3: Data Bank Validation
Once all the information is collected via primary and secondary sources, we run that information for data validation. At our intelligence centre our research heads track a lot of information related to the market which includes the quarterly reports, the daily stock prices, and other relevant information. Our data bank server gets updated every fortnight and that is how the information which we collected using our primary and secondary information is revalidated in real time.
Step 4: QA/QC Process
After all the data collection and validation our team does a final level of quality check and quality assurance to get rid of any unwanted or undesired mistakes. This might include but not limited to getting rid of the any typos, duplication of numbers or missing of any important information. The people involved in this process include technical content writers, research heads and graphics people. Once this process is completed the title gets uploader on our platform for our clients to read it.
Step 5: Final QC/QA Process:
This is the last process and comes when the client has ordered the study. In this process a final QA/QC is done before the study is emailed to the client. Since we believe in giving our clients a good experience of our research studies, therefore, to make sure that we do not lack at our end in any way humanly possible we do a final round of quality check and then dispatch the study to the client.
Key Segments:
By Type
Wi-Fi
Bluetooth
Zigbee
NB-IoT
Others
By Application
Consumer Electronics
Automotive & Transportation
Building Automation
Healthcare
Others
Request for Segment Customization as per your Business Requirement: Segment Customization Request
Regional Coverage:
North America
US
Canada
Mexico
Europe
Eastern Europe
Poland
Romania
Hungary
Turkey
Rest of Eastern Europe
Western Europe
Germany
France
UK
Italy
Spain
Netherlands
Switzerland
Austria
Rest of Western Europe
Asia Pacific
China
India
Japan
South Korea
Vietnam
Singapore
Australia
Rest of Asia Pacific
Middle East & Africa
Middle East
UAE
Egypt
Saudi Arabia
Qatar
Rest of Middle East
Africa
Nigeria
South Africa
Rest of Africa
Latin America
Brazil
Argentina
Colombia
Rest of Latin America
Request for Country Level Research Report: Country Level Customization Request
Available Customization
With the given market data, SNS Insider offers customization as per the company’s specific needs. The following customization options are available for the report:
Detailed Volume Analysis
Criss-Cross segment analysis (e.g. Product X Application)
Competitive Product Benchmarking
Geographic Analysis
Additional countries in any of the regions
Customized Data Representation
Detailed analysis and profiling of additional market players
The Blockchain in the Manufacturing Market was valued at USD 3.9 billion in 2023 and is expected to reach USD 116.9 billion by 2032, growing at a CAGR of 45.93% from 2024-2032.
Risk Analytics Market was valued at USD 37.51 billion in 2023 and is expected to reach USD 109.35 billion by 2032, growing at a CAGR of 12.65% from 2024-2032.
The Push to Talk (PTT) Market was valued at USD 32.84 billion in 2023 and will reach USD 84.04 billion by 2032, growing at a CAGR of 11.02% by 2032.
The Digital Badges Market size was USD 208.05 Million in 2023 and is expected to reach USD 921.78 Mn by 2032 and grow at a CAGR of 18.01% by 2024-2032.
The Supply Chain Analytics Market was worth USD 8.02 billion in 2023 and is predicted to be worth USD 33.45 billion by 2032, growing at a CAGR of 17.2% between 2024 and 2032.
The Metaverse in Education Market was valued at USD 4.6 Billion in 2023 and will reach USD 85.6 Billion by 2032 and grow at a CAGR of 38.31% by 2032.
Hi! Click one of our member below to chat on Phone