image

Inventory Tags Market Report Scope & Overview:

Inventory Tags Market,Revenue Analysis

Get More Information on Inventory Tags Market - Request Sample Report

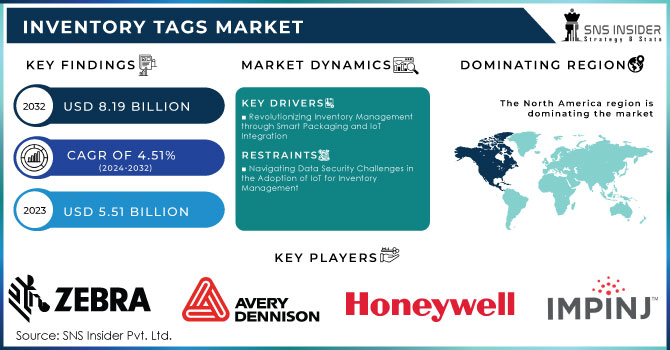
The Inventory Tags Market Share was valued at USD 5.51 billion in 2023 and is expected to grow to USD 8.19 billion by 2032 and grow at a CAGR of 4.51% over the forecast period of 2024-2032.

The inventory tags market is experiencing significant growth, primarily fueled by the integration of Internet of Things (IoT) technology and automation in inventory management systems. As businesses increasingly seek efficient asset management solutions, the demand for smart inventory tags capable of real-time tracking and data analysis is on the rise. This trend reflects the escalating need for automation across various sectors, including retail, manufacturing, and logistics.

In recent years, the trend of smart packaging has gained traction, playing a crucial role in the evolution of inventory management. Industry analyses indicate that IoT-enabled packaging solutions enhance supply chain transparency and efficiency, enabling businesses to monitor inventory levels and reduce waste. For example, integrating RFID tags with IoT platforms provides real-time visibility into product movements, facilitating timely decision-making and optimized inventory levels. This capability is particularly vital in sectors like food and beverage, where maintaining freshness and stock accuracy is essential. Reports suggest that the growing emphasis on supply chain digitization is set to improve the functionality of inventory tags, making them essential tools for businesses aiming to streamline operations.

The retail sector is a significant driver of the inventory tags market, with retailers adopting advanced tracking solutions to boost operational efficiency. The shift towards e-commerce has further intensified this trend, as retailers leverage smart inventory tags to effectively manage stock levels and enhance customer satisfaction. A recent report reveals that 67% of retailers are investing in IoT technologies to optimize inventory management, highlighting the sector's commitment to innovation. Additionally, as the demand for sustainable practices increases, businesses are exploring eco-friendly inventory tagging solutions that align with their corporate social responsibility objectives.

Automation plays a pivotal role in improving the accuracy of inventory management systems. Companies are increasingly adopting automated solutions powered by artificial intelligence (AI) and machine learning to analyze inventory data, forecast trends, and reduce human errors. In industries such as pharmaceuticals and life sciences, automation is transforming the supply chain by ensuring that the right products are available at the right time, thus lowering costs and enhancing service levels. The potential for integrating AI with inventory tags is vast, providing advanced analytics and insights into consumer behavior.

Despite these advancements, the inventory tags market encounters challenges, including high initial investment costs for implementing RFID systems and concerns regarding data security. However, as more businesses recognize the long-term benefits of smart inventory solutions, these obstacles are expected to lessen. Reports indicate that over 50% of companies utilizing IoT-enabled inventory solutions have experienced significant improvements in operational efficiency and reduced costs.

The inventory tags market is expected to continue its positive trajectory, driven by technological innovations that will redefine how businesses manage their inventory. As industries increasingly adopt IoT technologies and automation, the demand for smart inventory tags will remain strong, promoting growth and enhancing operational efficiency. This evolution towards automation and IoT integration in inventory management systems marks a shift towards a more connected, efficient and responsive supply chain ecosystem.In summary, the inventory tags market is set for substantial growth, bolstered by the ongoing integration of IoT technology and automation, particularly in sectors such as retail and logistics.

Inventory Tags Market Dynamics

Drivers

  • Revolutionizing Inventory Management through Smart Packaging and IoT Integration

The trend of smart packaging is significantly shaping the inventory tags market, as businesses increasingly adopt IoT-enabled packaging solutions to enhance operational efficiency. These solutions provide critical transparency in supply chain management, enabling businesses to monitor inventory levels effectively and minimize waste. Notably, 67% of consumers prefer products with smart packaging features, indicating a strong consumer inclination towards technology-driven solutions. Additionally, 40% of manufacturers are now utilizing smart labels to enhance tracking and compliance, while 30% of companies are implementing RFID systems to streamline their inventory management processes. Moreover, the implementation of smart packaging contributes to sustainability efforts, as companies strive to meet the growing consumer demand for eco-friendly practices. As the packaging industry evolves to meet modern consumer needs, the integration of smart inventory tags becomes indispensable, facilitating real-time tracking and data analysis. This shift is transforming how businesses manage their inventory while enhancing the overall customer experience by ensuring product freshness and availability. As a result, the adoption of smart packaging technologies is set to drive substantial growth in the inventory tags market, making it a vital component in today’s supply chain landscape.

  • Driving Efficiency through Supply Chain Digitization and Advanced Inventory Solutions

The focus on supply chain digitization is a significant driver for the inventory tags market, as businesses increasingly seek advanced inventory solutions for enhanced operational efficiency. In a recent survey, 75% of supply chain executives reported that digitization initiatives are a top priority for their organizations. This shift towards digital transformation facilitates real-time monitoring and data-driven decision-making, enabling companies to optimize inventory management processes. Furthermore, the adoption of technologies like digital twins is projected to enhance visibility and control, with 35% of organizations planning to implement this technology in their supply chains by 2025. The integration of IoT-enabled inventory tags is essential in this context, allowing businesses to track product movements accurately and respond swiftly to market demands. As digital solutions become more prevalent, companies are recognizing the value of investing in smart inventory systems, leading to a reduction in inventory carrying costs by 20-30%. Overall, the growing emphasis on supply chain digitization not only improves inventory accuracy but also enhances overall productivity, making it a vital driver for the inventory tags market in today's competitive landscape.

Restraints

  • Navigating Data Security Challenges in the Adoption of IoT for Inventory Management

The integration of IoT and digital technologies in inventory management brings about significant data security concerns that can hinder market growth. According to recent reports, 60% of organizations express anxiety over potential cyberattacks and data breaches, which may lead to reluctance in adopting advanced inventory tagging solutions. Furthermore, as highlighted in industry analyses, 50% of IT professionals believe that data privacy issues remain a major barrier to the full implementation of IoT technologies. This hesitation is compounded by the need for compliance with various regulations surrounding data management, which can add complexity and costs to the integration process. Moreover, 70% of companies are concerned about the return on investment (ROI) associated with these technologies, fearing that the costs may outweigh the benefits. As businesses strive to modernize their operations, addressing these data security concerns becomes crucial for fostering trust and encouraging the adoption of smart inventory solutions. The evolution of the inventory tags market hinges on balancing innovation with robust security measures, ensuring that companies can safely leverage the advantages of IoT technology while protecting sensitive data.

Inventory Tags Market Segment Overview
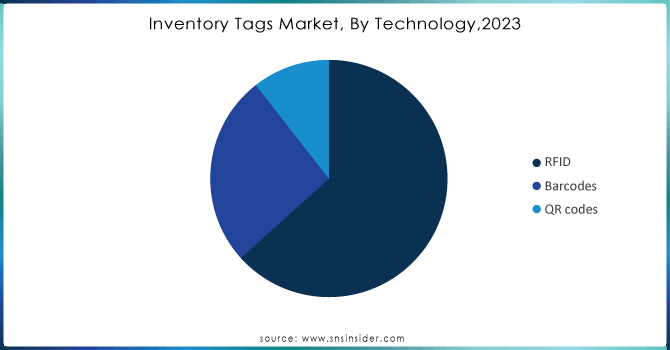
By Technology

The inventory tags market is primarily segmented by technology, with Radio Frequency Identification (RFID) technology holding a dominant share of approximately 64% of total revenue in 2023. This leadership is due to several advantages that RFID tags offer, such as real-time tracking capabilities, enhanced inventory accuracy, and reduced labor costs.RFID tags utilize electromagnetic fields to automatically identify and track attached items, allowing for efficient data collection without requiring line-of-sight scanning. This feature makes RFID particularly effective in settings like warehouses and retail environments. In 2023, companies such as Zebra Technologies launched innovative RFID solutions designed to improve inventory accuracy and boost supply chain efficiency. Additionally, Avery Dennison introduced RFID-enabled smart labels that have gained popularity in the retail and logistics sectors, significantly streamlining operational processes. The rapid adoption of RFID technology is largely attributed to its effectiveness in minimizing stock discrepancies and enhancing supply chain transparency. Moreover, ongoing advancements in RFID—such as the creation of low-cost tags and enhanced read ranges—further strengthen its market presence. Countries like China and the United States are at the forefront of RFID adoption, driven by substantial investments in automation and digital transformation across various industries.

Inventory-Tags-Market-By-Technology2023

Need Any Customization Research On Inventory Tags Market - Inquiry Now

By Material

The inventory tags market can be categorized by material, with plastic dominating the segment, holding approximately 69% market share in 2023. This prevalence is largely due to the lightweight, durable, and cost-effective characteristics of plastic. Plastic inventory tags are favored for their versatility and resistance to various environmental factors, including moisture, chemicals, and temperature variations. These features make them ideal for a range of applications across industries such as retail, logistics, and manufacturing. Furthermore, plastic tags can be easily printed and customized, with the capability to integrate technologies like barcodes and RFID, enhancing their overall functionality. Recently, manufacturers have been focusing on innovation within the plastic segment, introducing sustainable options like biodegradable and recyclable tags, which resonate with businesses increasingly committed to sustainability. Key players, such as Cimpress, have rolled out new product lines that leverage advanced printing technologies and cater to specific industry demands. Additionally, regions like North America and Asia-Pacific are leading the adoption of plastic inventory tags, bolstered by rising investments in retail and logistics infrastructure. The ongoing transition towards digital inventory management further boosts the appeal of plastic tags, reinforcing their dominant market position.

Inventory Tags Market Regional Analysis

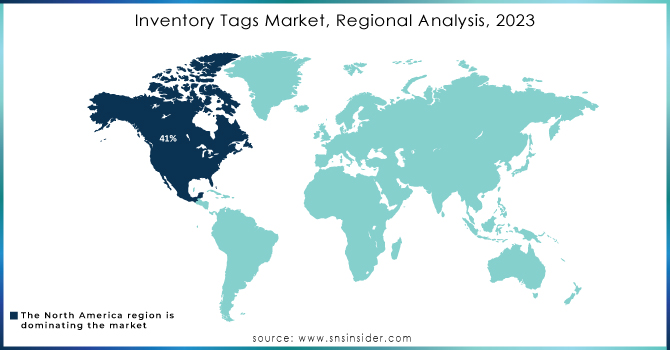
North America is a frontrunner in the inventory tags market, capturing around 41% of the total revenue in 2023. This robust market share can be attributed to several key factors, including significant technological advancements, a thriving retail sector, and an enhanced focus on supply chain efficiency. The United States plays a crucial role in this growth, driven by substantial investments in automation and digital transformation. Retailers and manufacturers across the U.S. are increasingly implementing advanced inventory management solutions, such as RFID and smart labels, to improve tracking capabilities and operational efficiency.

For example, Zebra Technologies has recently unveiled a new range of RFID solutions aimed at optimizing inventory accuracy and streamlining supply chain processes. In parallel, Avery Dennison has launched innovative smart labels designed to integrate smoothly with existing inventory systems, particularly benefiting sectors like retail and logistics.

North America boasts a well-established logistics and distribution network, which further supports the effective adoption of inventory management systems. Companies are increasingly recognizing the importance of incorporating IoT technology into their supply chain operations, resulting in a heightened demand for smart inventory tags that enhance automation and streamline processes.

In Canada, there is also a marked acceleration in the adoption of digital inventory solutions, as businesses invest in technologies that improve supply chain visibility. There is a growing emphasis on sustainable practices, with many companies seeking eco-friendly inventory tag options to align with corporate social responsibility objectives. Firms like Cimpress are developing biodegradable and recyclable plastic tags, underscoring the industry's commitment to sustainability. This focus on innovative materials and technologies is likely to drive further growth in the North American inventory tags market, reinforcing its leadership position.

The Asia Pacific region is swiftly emerging as the fastest-growing market for inventory tags in 2023, driven by industrialization, increasing consumer demand, and technological progress. The growth is predominantly fueled by the retail, logistics, and manufacturing sectors, which are progressively adopting inventory management solutions to improve efficiency and streamline processes. Leading this growth are countries like China and India. In China, substantial government investments in smart manufacturing and automation are accelerating the adoption of advanced inventory technologies, such as IoT and RFID. Major players like Hikvision have launched tailored RFID solutions that enhance tracking capabilities and inventory accuracy.

Meanwhile, India is experiencing a surge in e-commerce, prompting businesses to invest in innovative tracking solutions. Zebra Technologies has recently expanded its presence in India by introducing smart label products designed to meet local market demands. The region's young, tech-savvy population is driving the popularity of smart retail concepts and automated stores. Companies like Avery Dennison are introducing advanced plastic and RFID tags, emphasizing sustainability through recyclable options. Collaborations between key manufacturers and local partners, such as 3M's partnerships in Southeast Asia, further enhance supply chain efficiency. Overall, the Asia Pacific region's rapid growth offers numerous opportunities for innovation and expansion in the inventory tags market.

Inventory-Tags-Market-Regional-Analysis-2023

Key Players in Inventory Tags Market

Some of the Major Key Players in Inventory Tags Market who provide product and offering:

Manufacturers

  • Zebra Technologies (RFID tags, barcode labels, and RFID printers)

  • Avery Dennison (RFID tags, thermal transfer labels, and self-adhesive labels)

  • SATO Holdings (RFID tags, thermal transfer labels, and printing solutions)

  • Honeywell International (RFID tags, barcode scanners, and labeling solutions)

  • Impinj (RFID tags and readers, including the Monza® chip series)

  • Alien Technology (RFID tags, readers, and antennas)

  • NXP Semiconductors (RFID chips and solutions for inventory tracking)

  • Toshiba TEC (RFID printers, barcode printers, and labeling solutions)

  • Cognex Corporation (Machine vision systems and barcode readers)

  • Datalogic (Barcode scanners, RFID readers, and imaging solutions)

  • Checkpoints Systems (EAS (Electronic Article Surveillance) tags and labels)

  • RFID Global Solution (Custom RFID tags and solutions for asset tracking)

  • Smartrac (RFID inlays and tags for various applications)

  • Fujitsu (RFID solutions for inventory and asset management)

  • Mühlbauer Group (RFID inlays and tags, including smart labels)

  • Xerafy (RFID tags for industrial and supply chain applications)

Suppliers

  • Seagull Scientific Printo 

  • Barcoding, Inc

  • Labelmaster

Recent Development

  • AWS Resource Management Optimization (September 2024):Amazon Web Services (AWS) launched enhanced tag inventory reports to improve resource management, allowing organizations to optimize resource allocation and monitor costs effectively.

  • RFID in Real-Time Inventory Management (October 2024):RFID technology is increasingly being adopted in manufacturing and retail for seamless asset tracking and quality control, enhancing operational efficiency and accuracy.

  • Drones and RFID in Nursery Management (August 2024): Drones equipped with RFID readers are revolutionizing inventory management in nurseries, enabling quick aerial assessments of plant inventory and health.

  • Using Docker Tags for Image Version Management (July 2024): Docker tags are being utilized to manage image versions effectively, paralleling physical tagging systems in inventory management and ensuring correct software deployment.

Inventory Tags Market Report Scope:

Report Attributes Details
Market Size in 2023 USD 5.51   Billion 
Market Size by 2032 USD 8.19   Billion 
CAGR CAGR of 4.51%  From 2024 to 2032
Base Year 2023
Forecast Period 2024-2032
Historical Data 2020-2022
Report Scope & Coverage Market Size, Segments Analysis, Competitive  Landscape, Regional Analysis, DROC & SWOT Analysis, Forecast Outlook
Key Segments • By Technology (Barcodes, RFID & QR Codes)
• By Materials (Metal, Plastic, and Paper)
• By End-User (Industrial, Retail, Logistic and Others)

 
Regional Analysis/Coverage North America (US, Canada, Mexico), Europe (Eastern Europe [Poland, Romania, Hungary, Turkey, Rest of Eastern Europe] Western Europe] Germany, France, UK, Italy, Spain, Netherlands, Switzerland, Austria, Rest of Western Europe]), Asia-Pacific (China, India, Japan, South Korea, Vietnam, Singapore, Australia, Rest of Asia-Pacific), Middle East & Africa (Middle East [UAE, Egypt, Saudi Arabia, Qatar, Rest of Middle East], Africa [Nigeria, South Africa, Rest of Africa], Latin America (Brazil, Argentina, Colombia, Rest of Latin America)
Company Profiles Zebra Technologies, Avery Dennison, SATO Holdings, Honeywell International, Impinj, Alien Technology, NXP Semiconductors, Toshiba TEC, Cognex Corporation, Datalogic, Checkpoints Systems, RFID Global Solution, Smartrac, Fujitsu, Mühlbauer Group, and Xerafy 
Key Drivers • Revolutionizing Inventory Management through Smart Packaging and IoT Integration
• Driving Efficiency through Supply Chain Digitization and Advanced Inventory Solutions
RESTRAINTS • Navigating Data Security Challenges in the Adoption of IoT for Inventory Management

Frequently Asked Questions

Ans: The Inventory Tags Market grow at a CAGR of 4.51% over the forecast period of 2024-2032.

Ans: Inventory Tags Market size was valued at USD 5.51 billion in 2023 and is expected to grow to USD 8.19 billion by 2032.

Ans: The major growth factor of the Inventory Tags Market is the increasing demand for real-time data analytics and insights to enhance operational efficiency and decision-making in manufacturing processes.

Ans: The Embedded segment dominated the Inventory Tags Market.

Ans: North America dominated the Inventory Tags Market in 2023.

Table of Content

1. Introduction

1.1 Market Definition

1.2 Scope (Inclusion and Exclusions)

1.3 Research Assumptions

2. Executive Summary

2.1 Market Overview

2.2 Regional Synopsis

2.3 Competitive Summary

3. Research Methodology

3.1 Top-Down Approach

3.2 Bottom-up Approach

3.3. Data Validation

3.4 Primary Interviews

4. Market Dynamics Impact Analysis

4.1 Market Driving Factors Analysis

4.1.1 Drivers

4.1.2 Restraints

4.1.3 Opportunities

4.1.4 Challenges

4.2 PESTLE Analysis

4.3 Porter’s Five Forces Model

5. Statistical Insights and Trends Reporting

5.1 Material Usage Trends, by Material Type, by Region, 2023

5.2 Upcoming Projects, by Region, by Type (Residential, Commercial, Industrial)

5.3 Building Permit Issuances, by Region, 2023

5.4 Labor Market Statistics, by Region, 2023

5.5 Technology Adoption, by Technology Type

6. Competitive Landscape

6.1 List of Major Companies, By Region

6.2 Market Share Analysis, By Region

6.3 Product Benchmarking

6.3.1 Product specifications and features

6.3.2 Pricing

6.4 Strategic Initiatives

6.4.1 Marketing and promotional activities

6.4.2 Distribution and supply chain strategies

6.4.3 Expansion plans and new product launches

6.4.4 Strategic partnerships and collaborations

6.5 Technological Advancements

6.6 Market Positioning and Branding

7. Inventory Tags Market Segmentation, by Technology

7.1 Chapter Overview

7.2 RFID

7.2.1 RFID Market Trends Analysis (2020-2032)

7.2.2 RFID Market Size Estimates and Forecasts to 2032 (USD Billion)

7.3 Barcodes

7.3.1 Barcodes Market Trends Analysis (2020-2032)

7.3.2 Barcodes Market Size Estimates and Forecasts to 2032 (USD Billion)

7.4 QR codes

7.4.1 QR codes Market Trends Analysis (2020-2032)

7.4.2 QR codes Market Size Estimates and Forecasts to 2032 (USD Billion)

8. Inventory Tags Market Segmentation, by Material

8.1 Chapter Overview

8.2 Plastic

8.2.1 Plastic Market Trends Analysis (2020-2032)

8.2.2 Plastic Market Size Estimates and Forecasts to 2032 (USD Billion)

8.3 Metal

8.3.1 Metal Market Trends Analysis (2020-2032)

8.3.2 Metal Market Size Estimates and Forecasts to 2032 (USD Billion)

8.4 Paper

8.4.1 Paper Market Trends Analysis (2020-2032)

8.4.2 Paper Market Size Estimates and Forecasts to 2032 (USD Billion)

9. Inventory Tags Market Segmentation, by End User

9.1 Chapter Overview

9.2 Retail

9.2.1 Retail Market Trends Analysis (2020-2032)

9.2.2 Retail Market Size Estimates and Forecasts to 2032 (USD Billion)

9.3 Industrial

9.3.1 Industrial Market Trends Analysis (2020-2032)

9.3.2 Industrial Market Size Estimates and Forecasts to 2032 (USD Billion)

9.4 Logistics

9.4.1 Logistics Market Trends Analysis (2020-2032)

9.4.2 Logistics Market Size Estimates and Forecasts to 2032 (USD Billion)

9.5 Other

9.5.1 Other Market Trends Analysis (2020-2032)

9.5.2 Other Market Size Estimates and Forecasts to 2032 (USD Billion)

10. Regional Analysis

10.1 Chapter Overview

10.2 North America

10.2.1 Trends Analysis

10.2.2 North America Inventory Tags Market Estimates and Forecasts, by Country (2020-2032) (USD Billion)

10.2.3 North America Inventory Tags Market Estimates and Forecasts, by Technology (2020-2032) (USD Billion)  

10.2.4 North America Inventory Tags Market Estimates and Forecasts, by Material (2020-2032) (USD Billion)

10.2.5 North America Inventory Tags Market Estimates and Forecasts, by End User (2020-2032) (USD Billion)

10.2.6 USA

10.2.6.1 USA Inventory Tags Market Estimates and Forecasts, by Technology (2020-2032) (USD Billion)

10.2.6.2 USA Inventory Tags Market Estimates and Forecasts, by Material (2020-2032) (USD Billion)

10.2.6.3 USA Inventory Tags Market Estimates and Forecasts, by End User (2020-2032) (USD Billion)

10.2.7 Canada

10.2.7.1 Canada Inventory Tags Market Estimates and Forecasts, by Technology  (2020-2032) (USD Billion)

10.2.7.2 Canada Inventory Tags Market Estimates and Forecasts, by Material  (2020-2032) (USD Billion)

10.2.7.3 Canada Inventory Tags Market Estimates and Forecasts, by End User (2020-2032) (USD Billion)

10.2.8 Mexico

10.2.8.1 Mexico Inventory Tags Market Estimates and Forecasts, by Technology  (2020-2032) (USD Billion)

10.2.8.2 Mexico Inventory Tags Market Estimates and Forecasts, by Material  (2020-2032) (USD Billion)

10.2.8.3 Mexico Inventory Tags Market Estimates and Forecasts, by End User (2020-2032) (USD Billion)

10.3 Europe

10.3.1 Eastern Europe

10.3.1.1 Trends Analysis

10.3.1.2 Eastern Europe Inventory Tags Market Estimates and Forecasts, by Country (2020-2032) (USD Billion)

10.3.1.3 Eastern Europe Inventory Tags Market Estimates and Forecasts, by Technology  (2020-2032) (USD Billion)  

10.3.1.4 Eastern Europe Inventory Tags Market Estimates and Forecasts, by Material  (2020-2032) (USD Billion)

10.3.1.5 Eastern Europe Inventory Tags Market Estimates and Forecasts, by End User (2020-2032) (USD Billion)

10.3.1.6 Poland

10.3.1.6.1 Poland Inventory Tags Market Estimates and Forecasts, by Technology  (2020-2032) (USD Billion)

10.3.1.6.2 Poland Inventory Tags Market Estimates and Forecasts, by Material  (2020-2032) (USD Billion)

10.3.1.6.3 Poland Inventory Tags Market Estimates and Forecasts, by End User (2020-2032) (USD Billion)

10.3.1.7 Romania

10.3.1.7.1 Romania Inventory Tags Market Estimates and Forecasts, by Technology  (2020-2032) (USD Billion)

10.3.1.7.2 Romania Inventory Tags Market Estimates and Forecasts, by Material  (2020-2032) (USD Billion)

10.3.1.7.3 Romania Inventory Tags Market Estimates and Forecasts, by End User (2020-2032) (USD Billion)

10.3.1.8 Hungary

10.3.1.8.1 Hungary Inventory Tags Market Estimates and Forecasts, by Technology  (2020-2032) (USD Billion)

10.3.1.8.2 Hungary Inventory Tags Market Estimates and Forecasts, by Material  (2020-2032) (USD Billion)

10.3.1.8.3 Hungary Inventory Tags Market Estimates and Forecasts, by End User (2020-2032) (USD Billion)

10.3.1.9 Turkey

10.3.1.9.1 Turkey Inventory Tags Market Estimates and Forecasts, by Technology  (2020-2032) (USD Billion)

10.3.1.9.2 Turkey Inventory Tags Market Estimates and Forecasts, by Material  (2020-2032) (USD Billion)

10.3.1.9.3 Turkey Inventory Tags Market Estimates and Forecasts, by End User (2020-2032) (USD Billion)

10.3.1.10 Rest of Eastern Europe

10.3.1.10.1 Rest of Eastern Europe Inventory Tags Market Estimates and Forecasts, by Technology  (2020-2032) (USD Billion)

10.3.1.10.2 Rest of Eastern Europe Inventory Tags Market Estimates and Forecasts, by Material  (2020-2032) (USD Billion)

10.3.1.10.3 Rest of Eastern Europe Inventory Tags Market Estimates and Forecasts, by End User (2020-2032) (USD Billion)

10.3.2 Western Europe

10.3.2.1 Trends Analysis

10.3.2.2 Western Europe Inventory Tags Market Estimates and Forecasts, by Country (2020-2032) (USD Billion)

10.3.2.3 Western Europe Inventory Tags Market Estimates and Forecasts, by Technology  (2020-2032) (USD Billion)  

10.3.2.4 Western Europe Inventory Tags Market Estimates and Forecasts, by Material  (2020-2032) (USD Billion)

10.3.2.5 Western Europe Inventory Tags Market Estimates and Forecasts, by End User (2020-2032) (USD Billion)

10.3.2.6 Germany

10.3.2.6.1 Germany Inventory Tags Market Estimates and Forecasts, by Technology  (2020-2032) (USD Billion)

10.3.2.6.2 Germany Inventory Tags Market Estimates and Forecasts, by Material  (2020-2032) (USD Billion)

10.3.2.6.3 Germany Inventory Tags Market Estimates and Forecasts, by End User (2020-2032) (USD Billion)

10.3.2.7 France

10.3.2.7.1 France Inventory Tags Market Estimates and Forecasts, by Technology  (2020-2032) (USD Billion)

10.3.2.7.2 France Inventory Tags Market Estimates and Forecasts, by Material  (2020-2032) (USD Billion)

10.3.2.7.3 France Inventory Tags Market Estimates and Forecasts, by End User (2020-2032) (USD Billion)

10.3.2.8 UK

10.3.2.8.1 UK Inventory Tags Market Estimates and Forecasts, by Technology  (2020-2032) (USD Billion)

10.3.2.8.2 UK Inventory Tags Market Estimates and Forecasts, by Material  (2020-2032) (USD Billion)

10.3.2.8.3 UK Inventory Tags Market Estimates and Forecasts, by End User (2020-2032) (USD Billion)

10.3.2.9 Italy

10.3.2.9.1 Italy Inventory Tags Market Estimates and Forecasts, by Technology  (2020-2032) (USD Billion)

10.3.2.9.2 Italy Inventory Tags Market Estimates and Forecasts, by Material  (2020-2032) (USD Billion)

10.3.2.9.3 Italy Inventory Tags Market Estimates and Forecasts, by End User (2020-2032) (USD Billion)

10.3.2.10 Spain

10.3.2.10.1 Spain Inventory Tags Market Estimates and Forecasts, by Technology  (2020-2032) (USD Billion)

10.3.2.10.2 Spain Inventory Tags Market Estimates and Forecasts, by Material  (2020-2032) (USD Billion)

10.3.2.10.3 Spain Inventory Tags Market Estimates and Forecasts, by End User (2020-2032) (USD Billion)

10.3.2.11 Netherlands

10.3.2.11.1 Netherlands Inventory Tags Market Estimates and Forecasts, by Technology  (2020-2032) (USD Billion)

10.3.2.11.2 Netherlands Inventory Tags Market Estimates and Forecasts, by Material  (2020-2032) (USD Billion)

10.3.2.11.3 Netherlands Inventory Tags Market Estimates and Forecasts, by End User (2020-2032) (USD Billion)

10.3.2.12 Switzerland

10.3.2.12.1 Switzerland Inventory Tags Market Estimates and Forecasts, by Technology  (2020-2032) (USD Billion)

10.3.2.12.2 Switzerland Inventory Tags Market Estimates and Forecasts, by Material  (2020-2032) (USD Billion)

10.3.2.12.3 Switzerland Inventory Tags Market Estimates and Forecasts, by End User (2020-2032) (USD Billion)

10.3.2.13 Austria

10.3.2.13.1 Austria Inventory Tags Market Estimates and Forecasts, by Technology  (2020-2032) (USD Billion)

10.3.2.13.2 Austria Inventory Tags Market Estimates and Forecasts, by Material  (2020-2032) (USD Billion)

10.3.2.13.3 Austria Inventory Tags Market Estimates and Forecasts, by End User (2020-2032) (USD Billion)

10.3.2.14 Rest of Western Europe

10.3.2.14.1 Rest of Western Europe Inventory Tags Market Estimates and Forecasts, by Technology  (2020-2032) (USD Billion)

10.3.2.14.2 Rest of Western Europe Inventory Tags Market Estimates and Forecasts, by Material  (2020-2032) (USD Billion)

10.3.2.14.3 Rest of Western Europe Inventory Tags Market Estimates and Forecasts, by End User (2020-2032) (USD Billion)

10.4 Asia-Pacific

10.4.1 Trends Analysis

10.4.2 Asia-Pacific Inventory Tags Market Estimates and Forecasts, by Country (2020-2032) (USD Billion)

10.4.3 Asia-Pacific Inventory Tags Market Estimates and Forecasts, by Technology  (2020-2032) (USD Billion)  

10.4.4 Asia-Pacific Inventory Tags Market Estimates and Forecasts, by Material  (2020-2032) (USD Billion)

10.4.5 Asia-Pacific Inventory Tags Market Estimates and Forecasts, by End User (2020-2032) (USD Billion)

10.4.6 China

10.4.6.1 China Inventory Tags Market Estimates and Forecasts, by Technology  (2020-2032) (USD Billion)

10.4.6.2 China Inventory Tags Market Estimates and Forecasts, by Material  (2020-2032) (USD Billion)

10.4.6.3 China Inventory Tags Market Estimates and Forecasts, by End User (2020-2032) (USD Billion)

10.4.7 India

10.4.7.1 India Inventory Tags Market Estimates and Forecasts, by Technology  (2020-2032) (USD Billion)

10.4.7.2 India Inventory Tags Market Estimates and Forecasts, by Material  (2020-2032) (USD Billion)

10.4.7.3 India Inventory Tags Market Estimates and Forecasts, by End User (2020-2032) (USD Billion)

10.4.8 Japan

10.4.8.1 Japan Inventory Tags Market Estimates and Forecasts, by Technology  (2020-2032) (USD Billion)

10.4.8.2 Japan Inventory Tags Market Estimates and Forecasts, by Material  (2020-2032) (USD Billion)

10.4.8.3 Japan Inventory Tags Market Estimates and Forecasts, by End User (2020-2032) (USD Billion)

10.4.9 South Korea

10.4.9.1 South Korea Inventory Tags Market Estimates and Forecasts, by Technology  (2020-2032) (USD Billion)

10.4.9.2 South Korea Inventory Tags Market Estimates and Forecasts, by Material  (2020-2032) (USD Billion)

10.4.9.3 South Korea Inventory Tags Market Estimates and Forecasts, by End User (2020-2032) (USD Billion)

10.4.10 Vietnam

10.4.10.1 Vietnam Inventory Tags Market Estimates and Forecasts, by Technology  (2020-2032) (USD Billion)

10.4.10.2 Vietnam Inventory Tags Market Estimates and Forecasts, by Material  (2020-2032) (USD Billion)

10.4.10.3 Vietnam Inventory Tags Market Estimates and Forecasts, by End User (2020-2032) (USD Billion)

10.4.11 Singapore

10.4.11.1 Singapore Inventory Tags Market Estimates and Forecasts, by Technology  (2020-2032) (USD Billion)

10.4.11.2 Singapore Inventory Tags Market Estimates and Forecasts, by Material  (2020-2032) (USD Billion)

10.4.11.3 Singapore Inventory Tags Market Estimates and Forecasts, by End User (2020-2032) (USD Billion)

10.4.12 Australia

10.4.12.1 Australia Inventory Tags Market Estimates and Forecasts, by Technology  (2020-2032) (USD Billion)

10.4.12.2 Australia Inventory Tags Market Estimates and Forecasts, by Material  (2020-2032) (USD Billion)

10.4.12.3 Australia Inventory Tags Market Estimates and Forecasts, by End User (2020-2032) (USD Billion)

10.4.13 Rest of Asia-Pacific

10.4.13.1 Rest of Asia-Pacific Inventory Tags Market Estimates and Forecasts, by Technology  (2020-2032) (USD Billion)

10.4.13.2 Rest of Asia-Pacific Inventory Tags Market Estimates and Forecasts, by Material  (2020-2032) (USD Billion)

10.4.13.3 Rest of Asia-Pacific Inventory Tags Market Estimates and Forecasts, by End User (2020-2032) (USD Billion)

10.5 Middle East and Africa

10.5.1 Middle East

10.5.1.1 Trends Analysis

10.5.1.2 Middle East Inventory Tags Market Estimates and Forecasts, by Country (2020-2032) (USD Billion)

10.5.1.3 Middle East Inventory Tags Market Estimates and Forecasts, by Technology  (2020-2032) (USD Billion)  

10.5.1.4 Middle East Inventory Tags Market Estimates and Forecasts, by Material  (2020-2032) (USD Billion)

10.5.1.5 Middle East Inventory Tags Market Estimates and Forecasts, by End User (2020-2032) (USD Billion)

10.5.1.6 UAE

10.5.1.6.1 UAE Inventory Tags Market Estimates and Forecasts, by Technology  (2020-2032) (USD Billion)

10.5.1.6.2 UAE Inventory Tags Market Estimates and Forecasts, by Material  (2020-2032) (USD Billion)

10.5.1.6.3 UAE Inventory Tags Market Estimates and Forecasts, by End User (2020-2032) (USD Billion)

10.5.1.7 Egypt

10.5.1.7.1 Egypt Inventory Tags Market Estimates and Forecasts, by Technology  (2020-2032) (USD Billion)

10.5.1.7.2 Egypt Inventory Tags Market Estimates and Forecasts, by Material  (2020-2032) (USD Billion)

10.5.1.7.3 Egypt Inventory Tags Market Estimates and Forecasts, by End User (2020-2032) (USD Billion)

10.5.1.8 Saudi Arabia

10.5.1.8.1 Saudi Arabia Inventory Tags Market Estimates and Forecasts, by Technology  (2020-2032) (USD Billion)

10.5.1.8.2 Saudi Arabia Inventory Tags Market Estimates and Forecasts, by Material  (2020-2032) (USD Billion)

10.5.1.8.3 Saudi Arabia Inventory Tags Market Estimates and Forecasts, by End User (2020-2032) (USD Billion)

10.5.1.9 Qatar

10.5.1.9.1 Qatar Inventory Tags Market Estimates and Forecasts, by Technology  (2020-2032) (USD Billion)

10.5.1.9.2 Qatar Inventory Tags Market Estimates and Forecasts, by Material  (2020-2032) (USD Billion)

10.5.1.9.3 Qatar Inventory Tags Market Estimates and Forecasts, by End User (2020-2032) (USD Billion)

10.5.1.10 Rest of Middle East

10.5.1.10.1 Rest of Middle East Inventory Tags Market Estimates and Forecasts, by Technology  (2020-2032) (USD Billion)

10.5.1.10.2 Rest of Middle East Inventory Tags Market Estimates and Forecasts, by Material  (2020-2032) (USD Billion)

10.5.1.10.3 Rest of Middle East Inventory Tags Market Estimates and Forecasts, by End User (2020-2032) (USD Billion)

10.5.2 Africa

10.5.2.1 Trends Analysis

10.5.2.2 Africa Inventory Tags Market Estimates and Forecasts, by Country (2020-2032) (USD Billion)

10.5.2.3 Africa Inventory Tags Market Estimates and Forecasts, by Technology  (2020-2032) (USD Billion)  

10.5.2.4 Africa Inventory Tags Market Estimates and Forecasts, by Material  (2020-2032) (USD Billion)

10.5.2.5 Africa Inventory Tags Market Estimates and Forecasts, by End User (2020-2032) (USD Billion)

10.5.2.6 South Africa

10.5.2.6.1 South Africa Inventory Tags Market Estimates and Forecasts, by Technology  (2020-2032) (USD Billion)

10.5.2.6.2 South Africa Inventory Tags Market Estimates and Forecasts, by Material  (2020-2032) (USD Billion)

10.5.2.6.3 South Africa Inventory Tags Market Estimates and Forecasts, by End User (2020-2032) (USD Billion)

10.5.2.7 Nigeria

10.5.2.7.1 Nigeria Inventory Tags Market Estimates and Forecasts, by Technology  (2020-2032) (USD Billion)

10.5.2.7.2 Nigeria Inventory Tags Market Estimates and Forecasts, by Material  (2020-2032) (USD Billion)

10.5.2.7.3 Nigeria Inventory Tags Market Estimates and Forecasts, by End User (2020-2032) (USD Billion)

10.5.2.8 Rest of Africa

10.5.2.8.1 Rest of Africa Inventory Tags Market Estimates and Forecasts, by Technology  (2020-2032) (USD Billion)

10.5.2.8.2 Rest of Africa Inventory Tags Market Estimates and Forecasts, by Material  (2020-2032) (USD Billion)

10.5.2.8.3 Rest of Africa Inventory Tags Market Estimates and Forecasts, by End User (2020-2032) (USD Billion)

10.6 Latin America

10.6.1 Trends Analysis

10.6.2 Latin America Inventory Tags Market Estimates and Forecasts, by Country (2020-2032) (USD Billion)

10.6.3 Latin America Inventory Tags Market Estimates and Forecasts, by Technology  (2020-2032) (USD Billion)  

10.6.4 Latin America Inventory Tags Market Estimates and Forecasts, by Material  (2020-2032) (USD Billion)

10.6.5 Latin America Inventory Tags Market Estimates and Forecasts, by End User (2020-2032) (USD Billion)

10.6.6 Brazil

10.6.6.1 Brazil Inventory Tags Market Estimates and Forecasts, by Technology  (2020-2032) (USD Billion)

10.6.6.2 Brazil Inventory Tags Market Estimates and Forecasts, by Material  (2020-2032) (USD Billion)

10.6.6.3 Brazil Inventory Tags Market Estimates and Forecasts, by End User (2020-2032) (USD Billion)

10.6.7 Argentina

10.6.7.1 Argentina Inventory Tags Market Estimates and Forecasts, by Technology  (2020-2032) (USD Billion)

10.6.7.2 Argentina Inventory Tags Market Estimates and Forecasts, by Material  (2020-2032) (USD Billion)

10.6.7.3 Argentina Inventory Tags Market Estimates and Forecasts, by End User (2020-2032) (USD Billion)

10.6.8 Colombia

10.6.8.1 Colombia Inventory Tags Market Estimates and Forecasts, by Technology  (2020-2032) (USD Billion)

10.6.8.2 Colombia Inventory Tags Market Estimates and Forecasts, by Material  (2020-2032) (USD Billion)

10.6.8.3 Colombia Inventory Tags Market Estimates and Forecasts, by End User (2020-2032) (USD Billion)

10.6.9 Rest of Latin America

10.6.9.1 Rest of Latin America Inventory Tags Market Estimates and Forecasts, by Technology  (2020-2032) (USD Billion)

10.6.9.2 Rest of Latin America Inventory Tags Market Estimates and Forecasts, by Material  (2020-2032) (USD Billion)

10.6.9.3 Rest of Latin America Inventory Tags Market Estimates and Forecasts, by End User (2020-2032) (USD Billion)

11. Company Profiles

11.1 Zebra Technologies

11.1.1 Company Overview

11.1.2 Financial

11.1.3 Products/ Services Offered

11.1.4 SWOT Analysis

11.2 Avery Dennison

11.2.1 Company Overview

11.2.2 Financial

11.2.3 Products/ Services Offered

11.2.4 SWOT Analysis

11.3 SATO Holdings

11.3.1 Company Overview

11.3.2 Financial

11.3.3 Products/ Services Offered

11.3.4 SWOT Analysis

11.4 Honeywell International

11.4.1 Company Overview

11.4.2 Financial

11.4.3 Products/ Services Offered

11.4.4 SWOT Analysis

11.5 Impinj

11.5.1 Company Overview

11.5.2 Financial

11.5.3 Products/ Services Offered

11.5.4 SWOT Analysis

11.6 Alien Technology

11.6.1 Company Overview

11.6.2 Financial

11.6.3 Products/ Services Offered

11.6.4 SWOT Analysis

11.7 NXP Semiconductors

11.7.1 Company Overview

11.7.2 Financial

11.7.3 Products/ Services Offered

11.7.4 SWOT Analysis

11.8 Toshiba TEC

11.8.1 Company Overview

11.8.2 Financial

11.8.3 Products/ Services Offered

11.8.4 SWOT Analysis

11.9 Cognex Corporation

11.9.1 Company Overview

11.9.2 Financial

11.9.3 Products/ Services Offered

11.9.4 SWOT Analysis

11.10 Datalogic

11.10.1 Company Overview

11.10.2 Financial

11.10.3 Products/ Services Offered

11.10.4 SWOT Analysis


12. Use Cases and Best Practices

13. Conclusion

An accurate research report requires proper strategizing as well as implementation. There are multiple factors involved in the completion of good and accurate research report and selecting the best methodology to compete the research is the toughest part. Since the research reports we provide play a crucial role in any company’s decision-making process, therefore we at SNS Insider always believe that we should choose the best method which gives us results closer to reality. This allows us to reach at a stage wherein we can provide our clients best and accurate investment to output ratio.

Each report that we prepare takes a timeframe of 350-400 business hours for production. Starting from the selection of titles through a couple of in-depth brain storming session to the final QC process before uploading our titles on our website we dedicate around 350 working hours. The titles are selected based on their current market cap and the foreseen CAGR and growth.


The 5 steps process:

Step 1: Secondary Research:

Secondary Research or Desk Research is as the name suggests is a research process wherein, we collect data through the readily available information. In this process we use various paid and unpaid databases which our team has access to and gather data through the same. This includes examining of listed companies’ annual reports, Journals, SEC filling etc. Apart from this our team has access to various associations across the globe across different industries. Lastly, we have exchange relationships with various university as well as individual libraries.

Secondary Research

Step 2: Primary Research

When we talk about primary research, it is a type of study in which the researchers collect relevant data samples directly, rather than relying on previously collected data.  This type of research is focused on gaining content specific facts that can be sued to solve specific problems. Since the collected data is fresh and first hand therefore it makes the study more accurate and genuine.

We at SNS Insider have divided Primary Research into 2 parts.

Part 1 wherein we interview the KOLs of major players as well as the upcoming ones across various geographic regions. This allows us to have their view over the market scenario and acts as an important tool to come closer to the accurate market numbers. As many as 45 paid and unpaid primary interviews are taken from both the demand and supply side of the industry to make sure we land at an accurate judgement and analysis of the market.

This step involves the triangulation of data wherein our team analyses the interview transcripts, online survey responses and observation of on filed participants. The below mentioned chart should give a better understanding of the part 1 of the primary interview.

Primary Research

Part 2: In this part of primary research the data collected via secondary research and the part 1 of the primary research is validated with the interviews from individual consultants and subject matter experts.

Consultants are those set of people who have at least 12 years of experience and expertise within the industry whereas Subject Matter Experts are those with at least 15 years of experience behind their back within the same space. The data with the help of two main processes i.e., FGDs (Focused Group Discussions) and IDs (Individual Discussions). This gives us a 3rd party nonbiased primary view of the market scenario making it a more dependable one while collation of the data pointers.

Step 3: Data Bank Validation

Once all the information is collected via primary and secondary sources, we run that information for data validation. At our intelligence centre our research heads track a lot of information related to the market which includes the quarterly reports, the daily stock prices, and other relevant information. Our data bank server gets updated every fortnight and that is how the information which we collected using our primary and secondary information is revalidated in real time.

Data Bank Validation

Step 4: QA/QC Process

After all the data collection and validation our team does a final level of quality check and quality assurance to get rid of any unwanted or undesired mistakes. This might include but not limited to getting rid of the any typos, duplication of numbers or missing of any important information. The people involved in this process include technical content writers, research heads and graphics people. Once this process is completed the title gets uploader on our platform for our clients to read it.

Step 5: Final QC/QA Process:

This is the last process and comes when the client has ordered the study. In this process a final QA/QC is done before the study is emailed to the client. Since we believe in giving our clients a good experience of our research studies, therefore, to make sure that we do not lack at our end in any way humanly possible we do a final round of quality check and then dispatch the study to the client.

Key Segments:

By Technology

  • RFID

  • Barcodes

  • QR codes

By Materials

  • Plastic

  • Metal

  • Paper

By End User

  • Retail

  • Industrial

  • Logistics

  • Other

 Request for Segment Customization as per your Business Requirement: Segment Customization Request

REGIONAL COVERAGE:

North America

  • US

  • Canada

  • Mexico

Europe

  • Eastern Europe

    • Poland

    • Romania

    • Hungary

    • Turkey

    • Rest of Eastern Europe

  • Western Europe

    • Germany

    • France

    • UK

    • Italy

    • Spain

    • Netherlands

    • Switzerland

    • Austria

    • Rest of Western Europe

Asia-Pacific

  • China

  • India

  • Japan

  • South Korea

  • Vietnam

  • Singapore

  • Australia

  • Rest of Asia Pacific

Middle East & Africa

  • Middle East

    • UAE

    • Egypt

    • Saudi Arabia

    • Qatar

    • Rest of the Middle East

  • Africa

    • Nigeria

    • South Africa

    • Rest of Africa

Latin America

  • Brazil

  • Argentina

  • Colombia

  • Rest of Latin America

Request for Country Level Research Report: Country Level Customization Request

Available Customization

With the given market data, SNS Insider offers customization as per the company’s specific needs. The following customization options are available for the report:

  • Product Analysis

  • Criss-Cross segment analysis (e.g. Product X Application)

  • Product Matrix which gives a detailed comparison of the product portfolio of each company

  • Geographic Analysis

  • Additional countries in any of the regions

  • Company Information

  • Detailed analysis and profiling of additional market players (Up to five)


  •            5000 (33% Discount)


  •            8950 (40% Discount)


  •            3050 (23% Discount)

Start a Conversation

Hi! Click one of our member below to chat on Phone