Get More Information on Intraoral Cameras Market - Request Sample Report
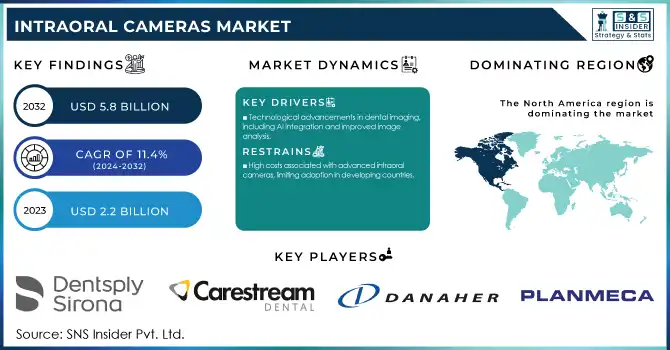
The Intraoral Cameras Market size was valued at USD 2.2 billion in 2023 and is expected to reach USD 5.8 billion by 2032 and grow at a CAGR of 11.4% over the forecast period 2024-2032.
The demand for intraoral cameras is rising drastically across the globe, which is primarily fueled by improving awareness regarding oral health, advancements in imaging technologies in dentistry, and a surge in the incidence of dental disorders. Oral diseases are regarded to be the most widespread diseases in the world, affecting nearly 3.5 billion people worldwide with untreated dental caries the most prevalent condition according to the World Health Organization (WHO). According to the CDC, over 1 in 4 (26%) adults in the United States have untreated tooth decay. As these statistics highlight, this could cause an increasing demand for complicated dental diagnostic tools like intraoral cameras. Government programs for oral healthcare awareness and the effects of digital technologies in dentistry also propel the demand in the market. An excellent example of this through public health is the U.S. Department of Health and Human Services Healthy People 2030 initiative, which seeks to address oral health through access to dental care and reducing barriers to dental care provision by promoting preventive services. The European Union's Horizon Europe program also supports research and innovation in dental technologies.
The importance of oral health and the intraoral camera market continues to be emphasized by government statistics and initiatives. In India, the National Oral Health Programme (NOHP) was launched to provide integrated, comprehensive oral health care in existing healthcare facilities. Considering the high treatment burden of oro-dental diseases in India, wherein only about 27.4% of the population receives professional dental care, the proposed program seeks to provide relief from the agonies of oro-dental diseases as more than 72.6% of the population remains deprived of oral health care facilities. According to the National Health Service (NHS) in the United Kingdom, there are roughly 10 million people waiting for routine dental treatment. This backlog in dental care services underscores the need for efficient diagnostic tools like intraoral cameras to streamline dental procedures and reduce waiting times.
The U.S. HRSA (Health Resources and Services Administration) offers grants designed to support the expansion of dental services in underserved areas, which may lead to the adoption of advanced dental technologies such as intraoral cameras. In addition, NIDCR of the U.S. has also funded several research projects on intraoral cameras through its grant funding program. The Healthy China 2030 plan issued by the government set goals for oral health at the national level, which may spur the demand for high-end dental technology in the world's most populous country. Similarly, in Japan, the government has been promoting preventive dental care through its national health insurance system, potentially creating opportunities for the intraoral camera market.
Drivers
Increasing prevalence of dental disorders and growing awareness related to oral health.
Technological advancements in dental imaging, including AI integration and improved image analysis.
Growing adoption of teledentistry, especially post-COVID-19 pandemic and Integration with digital dentistry and electronic health records (EHR) systems.
Increasing focus on patient-centered care models and enhanced diagnostic precision
The intraoral camera market is primarily driven by the increasing prevalence of dental disorders and growing awareness about oral health. Oral diseases impact approximately 3.5 billion people globally, making untreated dental caries the most prevalent condition according to the World Health Organization (WHO). In the United States, nearly 3 percent of children 6 to 11 years old had untreated decay in one or more permanent teeth, and about 10 percent of adolescents 12 to 19 years old were affected. The overall prevalence of dental caries was found to be 60% in participants when a study was conducted in India in 2024 and it was revealed that girls had a slightly higher prevalence than boys. A cross-sectional study done in Tamil Nadu-India reported that the overall prevalence of dental caries was 64.8% in both rural (73.39%) and urban (56.59%) areas. The high prevalence of dental disorders along with the growing awareness regarding oral health is increasing the adoption of intraoral cameras as advanced diagnostics tools. These devices allow for early diagnosis and enhanced communication between the patient and the dentist, ensuring better oral health outcomes, and the growing need for preventive dental care.
Restraints:
High costs associated with advanced intraoral cameras, limiting adoption in developing countries.
Shortage of skilled dental professionals to operate sophisticated imaging devices.
Technical challenges in integrating intraoral camera images with existing dental systems.
The lack of skilled dental professionals who know how to operate complex imaging devices is a key restraint in the market for intraoral cameras. In less developed parts of the world including countryside places, this is a major challenge. The recent data from the World Health Organization (WHO) states that shortage of dentists worldwide, with a ratio as low as 1:150,000 in some African countries compared to 1:2,000 in most industrialized nations.
Today, Intraoral cameras are very complex as they are often coupled to AI and sophisticated imaging software which requires specialized training. Older dentists or those in geographical areas with limited access to continuing education may be slower to incorporate these new technologies into their practices. Such resistance is often due to unfamiliarity with digital systems or apprehension of the learning curve required for new technologies. Furthermore, dental schools in many countries are struggling to keep pace with rapidly evolving dental technologies, resulting in newly graduated dentists lacking the necessary skills to operate advanced intraoral cameras effectively.
By Product
The intraoral wand segment held the majority share of 70% of revenue in 2023. The reasons behind this dominance include better imaging resolution, ease of usage, and flexibility offered by intraoral wands. Over 90 percent of dental practices in the U.S. already use some form of digital imaging technologies, including intraoral cameras, according to the American Dental Association (ADA). Thanks to its high-definition capturing of difficult-to-reach parts of the oral cavity, the intraoral wand has become central to any accurate diagnosis and treatment strategies. The U.S. Food and Drug Administration (FDA) has approved numerous intraoral wand devices, recognizing their importance in dental care. Additionally, growing segment growth is due to governmental efforts promoting the adoption of digital dental technologies. Examples include funded research projects at the National Institute of Dental and Craniofacial Research (NIDCR) in the U.S. which have worked to develop advanced dental imaging technologies such as intraoral cameras. In its guidelines for modern dentistry, the European Dental Association (EDA) has also stressed the use of digital imaging. Compatibility with dental practice management software as well as the importance of intraoral wand in patient education have reaffirmed its position in the market.
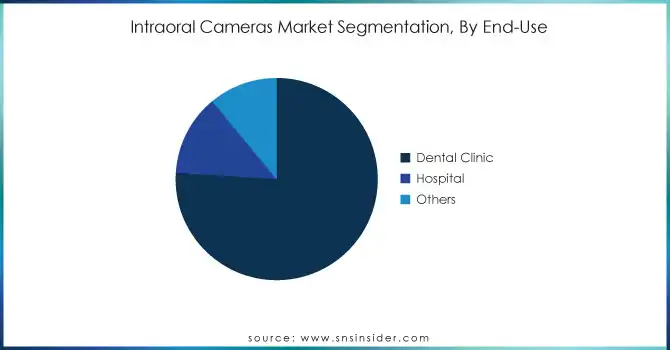
By End-use
In 2023, the dental clinics segment dominated the intraoral cameras market and held the largest revenue share of 76% in 2023. The number of dental clinics across the globe is increasing and the adoption of advanced dental technologies in these workstations is on the rise which is why the market share is majorly held by this segment. As of 2023, according to the American Dental Association (ADA), there were about 200,000 practicing dentists in the United States, and most of them around 83 percent worked in private practice. According to the Bureau of Labor Statistics, employment for dentists is expected to grow 6% from 2021 to 2031, which is faster than average for all occupations. This increase in dental professionals has also aroused a demand for advanced dental equipment such as intraoral cameras. According to the Council of European Dentists, Europe has more than 340,000 active dentists within EU member states and a general movement towards digitalization in dental practices. The expansion of clinics has also been helped by government campaigns to promote oral health and improve access to dental services. For instance, The U.S. Health Resources and Services Administration (HRSA) awards grants to assist in the expansion of dental services to areas lacking service capacity. Intraoral cameras allow effective communication between dentists and patients, treatment acceptance, and overall patient satisfaction, further driving their adoption in this end-use segment.
By Technology
The fiber optic camera segment dominated the market with the largest revenue share of 38% in 2023. The reason behind such domination is due to better image quality, durability, and reliability of the fiber optic technology over the other imaging modalities. According to data from the National Institute of Dental and Craniofacial Research (NIDCR) on trends over the past few decades, the use of fiber optic in dentistry has gradually increased since the introduction of fiber optic technology in the 1990s, More than 50 percent of U.S. dental practices had fiber optic intraoral cameras as part of their arsenal of diagnostic tools in 2010. The U.S. FDA has approved rubber optic intraoral cameras with consistent safety and efficacy in dental diagnostics. The standards of periodontal examination from the European Federation of Periodontology (EFP), have been a great stimulus to adopt fiber optic cameras as high-quality imaging is mandatory. This has made the technology especially useful in dental applications due to its power transmission of light, allowing for high-resolution imaging with more clarity at lower light levels. And, this progress has been indirectly facilitated by more government-funded research programs like the National Science Foundation (NSF) which has helped in the advancements of fiber optics as well as the dental imaging systems.
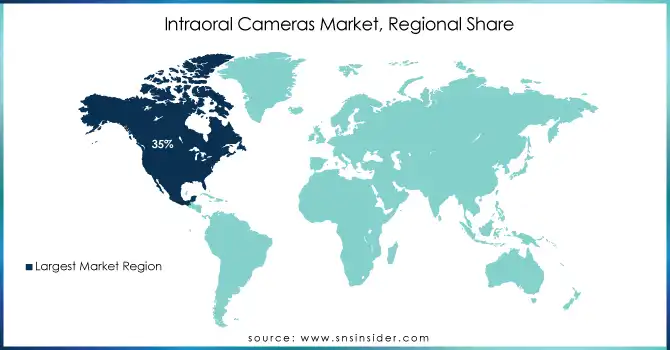
In 2023, the intraoral cameras market has been dominated by North America with a market share of 35%. The dominance of North America is due to advanced healthcare infrastructure in this region, and the high adoption rate of dental technologies, along with significant investment in research and development. Over 90% of dental practices in the US utilize digital imaging technologies, including intraoral cameras, as per the American Dental Association (ADA). According to the U.S. Centers for Medicare & Medicaid Services (CMS), dental services spending totaled $142.4 billion in 2020, indicating a large market for the dental technologies.
On the other hand, the Asia-Pacific region is witnessing the highest CAGR during the forecast period of 2024–2032. The rapid growth is due to growing consciousness of oral health, increasing disposable income, and government initiatives to provide better access to dental care. For example, the National Health Commission of the People's Republic of China has adopted the Healthy China 2030 plan with oral health goals throughout the country. Integrated, comprehensive oral health care is provided by the National Oral Health Program, India. Similarly, the Japanese government has been working to promote preventive dental care with its national health insurance coverage. The willingness to adopt advanced dental technologies like intraoral cameras, supported by the large population base and burgeoning middle class in the region, is driving the growth of the intraoral camera market across the Asia Pacific.
Get Customized Report as per Your Business Requirement - Enquiry Now
In February 2023, Sirona Dental Systems introduced the CEREC Omnicam, an intraoral camera featuring a laser scanner for creating digital teeth models.
In May 2024, Danaher partnered with Johns Hopkins University to advance diagnostic methods for mild traumatic brain injuries (TBI).
Manufacturers/Service Providers:
Dentsply Sirona (CEREC Primescan, Schick USBCam4)
Carestream Dental (CS 1500, CS 1200)
Danaher Corporation (Gendex GXDP-700, Gendex GXC-700)
KaVo Dental (KaVo ProXam iCam, KaVo DIAGNOcam Vision Full HD)
Planmeca (Planmeca Somia, Planmeca Emerald S)
Acteon Group (Soprocare, Sopro 617)
MouthWatch (MouthWatch Intraoral Camera, MouthWatch Plus+ HD Intraoral Camera)
Digital Doc LLC (IRIS X90, PXL)
Air Techniques (CamX Elara Intraoral Camera, CamX Triton HD)
Durr Dental (VistaCam iX HD Smart, VistaCam iX)
Gendex Corp. (GXC-300, GXS-700)
Owandy Radiology (Owandy-Cam HD, OPTEO)
Polaroid Corporation (Polaroid P31, Polaroid P1080)
Flight Dental Systems (Whicam Story 3 Intraoral Camera)
Rolence Enterprise Inc. (ZoomCam LD-10X)
Shofu Dental Corporation (EyeSpecial C-II, EyeSpecial C-IV)
Midmark Corporation (Midmark Intraoral Digital Sensor System, Vivid Intraoral Video Camera)
Yoshida Dental Mfg. Co. Ltd. (Mielscope, Pict Cam)
ASAHI ROENTGEN INDUSTRIES Co. Ltd.
ProDent
| Report Attributes | Details |
|---|---|
| Market Size in 2023 | USD 2.2 Billion |
| Market Size by 2032 | USD 5.8 Billion |
| CAGR | CAGR of 11.4% From 2024 to 2032 |
| Base Year | 2023 |
| Forecast Period | 2024-2032 |
| Historical Data | 2020-2022 |
| Report Scope & Coverage | Market Size, Segments Analysis, Competitive Landscape, Regional Analysis, DROC & SWOT Analysis, Forecast Outlook |
| Key Segments | • By Product (Intraoral Wand, Single Lens Reflex) • By Technology (USB Camera, Fiber Optic Camera, Wireless Cameras, Others) • By End Use (Hospital, Dental Clinic, Others) |
| Regional Analysis/Coverage | North America (US, Canada, Mexico), Europe (Eastern Europe [Poland, Romania, Hungary, Turkey, Rest of Eastern Europe] Western Europe] Germany, France, UK, Italy, Spain, Netherlands, Switzerland, Austria, Rest of Western Europe]), Asia Pacific (China, India, Japan, South Korea, Vietnam, Singapore, Australia, Rest of Asia Pacific), Middle East & Africa (Middle East [UAE, Egypt, Saudi Arabia, Qatar, Rest of Middle East], Africa [Nigeria, South Africa, Rest of Africa], Latin America (Brazil, Argentina, Colombia, Rest of Latin America) |
| Company Profiles | Dentsply Sirona, Carestream Dental, Danaher Corporation, KaVo Dental, Planmeca, Acteon Group, MouthWatch, Digital Doc LLC, Air Techniques, Durr Dental, Gendex Corp., Owandy Radiology, Polaroid Corporation, Flight Dental Systems, Rolence Enterprise Inc., Shofu Dental Corporation, Midmark Corporation, Yoshida Dental Mfg. Co. Ltd., ASAHI ROENTGEN INDUSTRIES Co. Ltd., ProDent |
| Key Drivers | • Increasing prevalence of dental disorders and growing awareness related to oral health. • Technological advancements in dental imaging, including AI integration and improved image analysis. |
| Restraints | • High costs associated with advanced intraoral cameras, limiting adoption in developing countries. • Shortage of skilled dental professionals to operate sophisticated imaging devices. |
Ans: The projected market size for the Intraoral Cameras Market is USD 5.8 Billion by 2032.
Ans: The North American region dominated the Intraoral Cameras Market in 2023.
Ans: The CAGR of the Intraoral Cameras Market is 11.4% During the forecast period of 2024-2032.
Ans: The dental clinics segment dominated the intraoral cameras market in 2023.
Ans:
Table of Contents
1. Introduction
1.1 Market Definition
1.2 Scope (Inclusion and Exclusions)
1.3 Research Assumptions
2. Executive Summary
2.1 Market Overview
2.2 Regional Synopsis
2.3 Competitive Summary
3. Research Methodology
3.1 Top-Down Approach
3.2 Bottom-up Approach
3.3. Data Validation
3.4 Primary Interviews
4. Market Dynamics Impact Analysis
4.1 Market Driving Factors Analysis
4.1.1 Drivers
4.1.2 Restraints
4.1.3 Opportunities
4.1.4 Challenges
4.2 PESTLE Analysis
4.3 Porter’s Five Forces Model
5. Statistical Insights and Trends Reporting
5.1 Incidence and Prevalence (2023)
5.2 Prescription Trends, (2023), by Region
5.3 Device Volume, by Region (2020-2032)
5.4 Healthcare Spending, by region, (Government, Commercial, Private, Out-of-Pocket), 2023
6. Competitive Landscape
6.1 List of Major Companies, By Region
6.2 Market Share Analysis, By Region
6.3 Product Benchmarking
6.3.1 Product specifications and features
6.3.2 Pricing
6.4 Strategic Initiatives
6.4.1 Marketing and promotional activities
6.4.2 Distribution and Supply Chain Strategies
6.4.3 Expansion plans and new product launches
6.4.4 Strategic partnerships and collaborations
6.5 Technological Advancements
6.6 Market Positioning and Branding
7. Intraoral Cameras Market Segmentation, By Product
7.1 Chapter Overview
7.2 Intraoral Wand
7.2.1 Intraoral Wand Market Trends Analysis (2020-2032)
7.2.2 Intraoral Wand Market Size Estimates and Forecasts to 2032 (USD Billion)
7.3 Single Lens Reflex
7.3.1 Single Lens Reflex Market Trends Analysis (2020-2032)
7.3.2 Single Lens Reflex Market Size Estimates and Forecasts to 2032 (USD Billion)
8. Intraoral Cameras Market Segmentation, By Technology
8.1 Chapter Overview
8.2 USB Camera
8.2.1 USB Camera Market Trends Analysis (2020-2032)
8.2.2 USB Camera Market Size Estimates and Forecasts to 2032 (USD Billion)
8.3 Fiber Optic Camera
8.3.1 Fiber Optic Camera Market Trends Analysis (2020-2032)
8.3.2 Fiber Optic Camera Market Size Estimates and Forecasts to 2032 (USD Billion)
8.4 Wireless Cameras
8.4.1 Wireless Cameras Market Trends Analysis (2020-2032)
8.4.2 Wireless Cameras Market Size Estimates and Forecasts to 2032 (USD Billion)
8.6 Others
8.6.1 Others Market Trends Analysis (2020-2032)
8.6.2 Others Market Size Estimates and Forecasts to 2032 (USD Billion)
9. Intraoral Cameras Market Segmentation, By End Use
9.1 Chapter Overview
9.2 Hospital
9.2.1 Hospital Market Trends Analysis (2020-2032)
9.2.2 Hospital Market Size Estimates and Forecasts to 2032 (USD Billion)
9.3 Dental Clinic
9.3.1 Dental Clinic Market Trends Analysis (2020-2032)
9.3.2 Dental Clinic Market Size Estimates and Forecasts to 2032 (USD Billion)
9.4 Others
9.4.1 Others Market Trends Analysis (2020-2032)
9.4.2 Others Market Size Estimates and Forecasts to 2032 (USD Billion)
10. Regional Analysis
10.1 Chapter Overview
10.2 North America
10.2.1 Trends Analysis
10.2.2 North America Intraoral Cameras Market Estimates and Forecasts, by Country (2020-2032) (USD Billion)
10.2.3 North America Intraoral Cameras Market Estimates and Forecasts, By Product (2020-2032) (USD Billion)
10.2.4 North America Intraoral Cameras Market Estimates and Forecasts, By Technology (2020-2032) (USD Billion)
10.2.5 North America Intraoral Cameras Market Estimates and Forecasts, By End Use (2020-2032) (USD Billion)
10.2.6 USA
10.2.6.1 USA Intraoral Cameras Market Estimates and Forecasts, By Product (2020-2032) (USD Billion)
10.2.6.2 USA Intraoral Cameras Market Estimates and Forecasts, By Technology (2020-2032) (USD Billion)
10.2.6.3 USA Intraoral Cameras Market Estimates and Forecasts, By End Use (2020-2032) (USD Billion)
10.2.7 Canada
10.2.7.1 Canada Intraoral Cameras Market Estimates and Forecasts, By Product (2020-2032) (USD Billion)
10.2.7.2 Canada Intraoral Cameras Market Estimates and Forecasts, By Technology (2020-2032) (USD Billion)
10.2.7.3 Canada Intraoral Cameras Market Estimates and Forecasts, By End Use (2020-2032) (USD Billion)
10.2.8 Mexico
10.2.8.1 Mexico Intraoral Cameras Market Estimates and Forecasts, By Product (2020-2032) (USD Billion)
10.2.8.2 Mexico Intraoral Cameras Market Estimates and Forecasts, By Technology (2020-2032) (USD Billion)
10.2.8.3 Mexico Intraoral Cameras Market Estimates and Forecasts, By End Use (2020-2032) (USD Billion)
10.3 Europe
10.3.1 Eastern Europe
10.3.1.1 Trends Analysis
10.3.1.2 Eastern Europe Intraoral Cameras Market Estimates and Forecasts, by Country (2020-2032) (USD Billion)
10.3.1.3 Eastern Europe Intraoral Cameras Market Estimates and Forecasts, By Product (2020-2032) (USD Billion)
10.3.1.4 Eastern Europe Intraoral Cameras Market Estimates and Forecasts, By Technology (2020-2032) (USD Billion)
10.3.1.5 Eastern Europe Intraoral Cameras Market Estimates and Forecasts, By End Use (2020-2032) (USD Billion)
10.3.1.6 Poland
10.3.1.6.1 Poland Intraoral Cameras Market Estimates and Forecasts, By Product (2020-2032) (USD Billion)
10.3.1.6.2 Poland Intraoral Cameras Market Estimates and Forecasts, By Technology (2020-2032) (USD Billion)
10.3.1.6.3 Poland Intraoral Cameras Market Estimates and Forecasts, By End Use (2020-2032) (USD Billion)
10.3.1.7 Romania
10.3.1.7.1 Romania Intraoral Cameras Market Estimates and Forecasts, By Product (2020-2032) (USD Billion)
10.3.1.7.2 Romania Intraoral Cameras Market Estimates and Forecasts, By Technology (2020-2032) (USD Billion)
10.3.1.7.3 Romania Intraoral Cameras Market Estimates and Forecasts, By End Use (2020-2032) (USD Billion)
10.3.1.8 Hungary
10.3.1.8.1 Hungary Intraoral Cameras Market Estimates and Forecasts, By Product (2020-2032) (USD Billion)
10.3.1.8.2 Hungary Intraoral Cameras Market Estimates and Forecasts, By Technology (2020-2032) (USD Billion)
10.3.1.8.3 Hungary Intraoral Cameras Market Estimates and Forecasts, By End Use (2020-2032) (USD Billion)
10.3.1.9 Turkey
10.3.1.9.1 Turkey Intraoral Cameras Market Estimates and Forecasts, By Product (2020-2032) (USD Billion)
10.3.1.9.2 Turkey Intraoral Cameras Market Estimates and Forecasts, By Technology (2020-2032) (USD Billion)
10.3.1.9.3 Turkey Intraoral Cameras Market Estimates and Forecasts, By End Use (2020-2032) (USD Billion)
10.3.1.10 Rest of Eastern Europe
10.3.1.10.1 Rest of Eastern Europe Intraoral Cameras Market Estimates and Forecasts, By Product (2020-2032) (USD Billion)
10.3.1.10.2 Rest of Eastern Europe Intraoral Cameras Market Estimates and Forecasts, By Technology (2020-2032) (USD Billion)
10.3.1.10.3 Rest of Eastern Europe Intraoral Cameras Market Estimates and Forecasts, By End Use (2020-2032) (USD Billion)
10.3.2 Western Europe
10.3.2.1 Trends Analysis
10.3.2.2 Western Europe Intraoral Cameras Market Estimates and Forecasts, by Country (2020-2032) (USD Billion)
10.3.2.3 Western Europe Intraoral Cameras Market Estimates and Forecasts, By Product (2020-2032) (USD Billion)
10.3.2.4 Western Europe Intraoral Cameras Market Estimates and Forecasts, By Technology (2020-2032) (USD Billion)
10.3.2.5 Western Europe Intraoral Cameras Market Estimates and Forecasts, By End Use (2020-2032) (USD Billion)
10.3.2.6 Germany
10.3.2.6.1 Germany Intraoral Cameras Market Estimates and Forecasts, By Product (2020-2032) (USD Billion)
10.3.2.6.2 Germany Intraoral Cameras Market Estimates and Forecasts, By Technology (2020-2032) (USD Billion)
10.3.2.6.3 Germany Intraoral Cameras Market Estimates and Forecasts, By End Use (2020-2032) (USD Billion)
10.3.2.7 France
10.3.2.7.1 France Intraoral Cameras Market Estimates and Forecasts, By Product (2020-2032) (USD Billion)
10.3.2.7.2 France Intraoral Cameras Market Estimates and Forecasts, By Technology (2020-2032) (USD Billion)
10.3.2.7.3 France Intraoral Cameras Market Estimates and Forecasts, By End Use (2020-2032) (USD Billion)
10.3.2.8 UK
10.3.2.8.1 UK Intraoral Cameras Market Estimates and Forecasts, By Product (2020-2032) (USD Billion)
10.3.2.8.2 UK Intraoral Cameras Market Estimates and Forecasts, By Technology (2020-2032) (USD Billion)
10.3.2.8.3 UK Intraoral Cameras Market Estimates and Forecasts, By End Use (2020-2032) (USD Billion)
10.3.2.9 Italy
10.3.2.9.1 Italy Intraoral Cameras Market Estimates and Forecasts, By Product (2020-2032) (USD Billion)
10.3.2.9.2 Italy Intraoral Cameras Market Estimates and Forecasts, By Technology (2020-2032) (USD Billion)
10.3.2.9.3 Italy Intraoral Cameras Market Estimates and Forecasts, By End Use (2020-2032) (USD Billion)
10.3.2.10 Spain
10.3.2.10.1 Spain Intraoral Cameras Market Estimates and Forecasts, By Product (2020-2032) (USD Billion)
10.3.2.10.2 Spain Intraoral Cameras Market Estimates and Forecasts, By Technology (2020-2032) (USD Billion)
10.3.2.10.3 Spain Intraoral Cameras Market Estimates and Forecasts, By End Use (2020-2032) (USD Billion)
10.3.2.11 Netherlands
10.3.2.11.1 Netherlands Intraoral Cameras Market Estimates and Forecasts, By Product (2020-2032) (USD Billion)
10.3.2.11.2 Netherlands Intraoral Cameras Market Estimates and Forecasts, By Technology (2020-2032) (USD Billion)
10.3.2.11.3 Netherlands Intraoral Cameras Market Estimates and Forecasts, By End Use (2020-2032) (USD Billion)
10.3.2.12 Switzerland
10.3.2.12.1 Switzerland Intraoral Cameras Market Estimates and Forecasts, By Product (2020-2032) (USD Billion)
10.3.2.12.2 Switzerland Intraoral Cameras Market Estimates and Forecasts, By Technology (2020-2032) (USD Billion)
10.3.2.12.3 Switzerland Intraoral Cameras Market Estimates and Forecasts, By End Use (2020-2032) (USD Billion)
10.3.2.13 Austria
10.3.2.13.1 Austria Intraoral Cameras Market Estimates and Forecasts, By Product (2020-2032) (USD Billion)
10.3.2.13.2 Austria Intraoral Cameras Market Estimates and Forecasts, By Technology (2020-2032) (USD Billion)
10.3.2.13.3 Austria Intraoral Cameras Market Estimates and Forecasts, By End Use (2020-2032) (USD Billion)
10.3.2.14 Rest of Western Europe
10.3.2.14.1 Rest of Western Europe Intraoral Cameras Market Estimates and Forecasts, By Product (2020-2032) (USD Billion)
10.3.2.14.2 Rest of Western Europe Intraoral Cameras Market Estimates and Forecasts, By Technology (2020-2032) (USD Billion)
10.3.2.14.3 Rest of Western Europe Intraoral Cameras Market Estimates and Forecasts, By End Use (2020-2032) (USD Billion)
10.4 Asia Pacific
10.4.1 Trends Analysis
10.4.2 Asia Pacific Intraoral Cameras Market Estimates and Forecasts, by Country (2020-2032) (USD Billion)
10.4.3 Asia Pacific Intraoral Cameras Market Estimates and Forecasts, By Product (2020-2032) (USD Billion)
10.4.4 Asia Pacific Intraoral Cameras Market Estimates and Forecasts, By Technology (2020-2032) (USD Billion)
10.4.5 Asia Pacific Intraoral Cameras Market Estimates and Forecasts, By End Use (2020-2032) (USD Billion)
10.4.6 China
10.4.6.1 China Intraoral Cameras Market Estimates and Forecasts, By Product (2020-2032) (USD Billion)
10.4.6.2 China Intraoral Cameras Market Estimates and Forecasts, By Technology (2020-2032) (USD Billion)
10.4.6.3 China Intraoral Cameras Market Estimates and Forecasts, By End Use (2020-2032) (USD Billion)
10.4.7 India
10.4.7.1 India Intraoral Cameras Market Estimates and Forecasts, By Product (2020-2032) (USD Billion)
10.4.7.2 India Intraoral Cameras Market Estimates and Forecasts, By Technology (2020-2032) (USD Billion)
10.4.7.3 India Intraoral Cameras Market Estimates and Forecasts, By End Use (2020-2032) (USD Billion)
10.4.8 Japan
10.4.8.1 Japan Intraoral Cameras Market Estimates and Forecasts, By Product (2020-2032) (USD Billion)
10.4.8.2 Japan Intraoral Cameras Market Estimates and Forecasts, By Technology (2020-2032) (USD Billion)
10.4.8.3 Japan Intraoral Cameras Market Estimates and Forecasts, By End Use (2020-2032) (USD Billion)
10.4.9 South Korea
10.4.9.1 South Korea Intraoral Cameras Market Estimates and Forecasts, By Product (2020-2032) (USD Billion)
10.4.9.2 South Korea Intraoral Cameras Market Estimates and Forecasts, By Technology (2020-2032) (USD Billion)
10.4.9.3 South Korea Intraoral Cameras Market Estimates and Forecasts, By End Use (2020-2032) (USD Billion)
10.4.10 Vietnam
10.4.10.1 Vietnam Intraoral Cameras Market Estimates and Forecasts, By Product (2020-2032) (USD Billion)
10.4.10.2 Vietnam Intraoral Cameras Market Estimates and Forecasts, By Technology (2020-2032) (USD Billion)
10.4.10.3 Vietnam Intraoral Cameras Market Estimates and Forecasts, By End Use (2020-2032) (USD Billion)
10.4.11 Singapore
10.4.11.1 Singapore Intraoral Cameras Market Estimates and Forecasts, By Product (2020-2032) (USD Billion)
10.4.11.2 Singapore Intraoral Cameras Market Estimates and Forecasts, By Technology (2020-2032) (USD Billion)
10.4.11.3 Singapore Intraoral Cameras Market Estimates and Forecasts, By End Use (2020-2032) (USD Billion)
10.4.12 Australia
10.4.12.1 Australia Intraoral Cameras Market Estimates and Forecasts, By Product (2020-2032) (USD Billion)
10.4.12.2 Australia Intraoral Cameras Market Estimates and Forecasts, By Technology (2020-2032) (USD Billion)
10.4.12.3 Australia Intraoral Cameras Market Estimates and Forecasts, By End Use (2020-2032) (USD Billion)
10.4.13 Rest of Asia Pacific
10.4.13.1 Rest of Asia Pacific Intraoral Cameras Market Estimates and Forecasts, By Product (2020-2032) (USD Billion)
10.4.13.2 Rest of Asia Pacific Intraoral Cameras Market Estimates and Forecasts, By Technology (2020-2032) (USD Billion)
10.4.13.3 Rest of Asia Pacific Intraoral Cameras Market Estimates and Forecasts, By End Use (2020-2032) (USD Billion)
10.5 Middle East and Africa
10.5.1 Middle East
10.5.1.1 Trends Analysis
10.5.1.2 Middle East Intraoral Cameras Market Estimates and Forecasts, by Country (2020-2032) (USD Billion)
10.5.1.3 Middle East Intraoral Cameras Market Estimates and Forecasts, By Product (2020-2032) (USD Billion)
10.5.1.4 Middle East Intraoral Cameras Market Estimates and Forecasts, By Technology (2020-2032) (USD Billion)
10.5.1.5 Middle East Intraoral Cameras Market Estimates and Forecasts, By End Use (2020-2032) (USD Billion)
10.5.1.6 UAE
10.5.1.6.1 UAE Intraoral Cameras Market Estimates and Forecasts, By Product (2020-2032) (USD Billion)
10.5.1.6.2 UAE Intraoral Cameras Market Estimates and Forecasts, By Technology (2020-2032) (USD Billion)
10.5.1.6.3 UAE Intraoral Cameras Market Estimates and Forecasts, By End Use (2020-2032) (USD Billion)
10.5.1.7 Egypt
10.5.1.7.1 Egypt Intraoral Cameras Market Estimates and Forecasts, By Product (2020-2032) (USD Billion)
10.5.1.7.2 Egypt Intraoral Cameras Market Estimates and Forecasts, By Technology (2020-2032) (USD Billion)
10.5.1.7.3 Egypt Intraoral Cameras Market Estimates and Forecasts, By End Use (2020-2032) (USD Billion)
10.5.1.8 Saudi Arabia
10.5.1.8.1 Saudi Arabia Intraoral Cameras Market Estimates and Forecasts, By Product (2020-2032) (USD Billion)
10.5.1.8.2 Saudi Arabia Intraoral Cameras Market Estimates and Forecasts, By Technology (2020-2032) (USD Billion)
10.5.1.8.3 Saudi Arabia Intraoral Cameras Market Estimates and Forecasts, By End Use (2020-2032) (USD Billion)
10.5.1.9 Qatar
10.5.1.9.1 Qatar Intraoral Cameras Market Estimates and Forecasts, By Product (2020-2032) (USD Billion)
10.5.1.9.2 Qatar Intraoral Cameras Market Estimates and Forecasts, By Technology (2020-2032) (USD Billion)
10.5.1.9.3 Qatar Intraoral Cameras Market Estimates and Forecasts, By End Use (2020-2032) (USD Billion)
10.5.1.10 Rest of Middle East
10.5.1.10.1 Rest of Middle East Intraoral Cameras Market Estimates and Forecasts, By Product (2020-2032) (USD Billion)
10.5.1.10.2 Rest of Middle East Intraoral Cameras Market Estimates and Forecasts, By Technology (2020-2032) (USD Billion)
10.5.1.10.3 Rest of Middle East Intraoral Cameras Market Estimates and Forecasts, By End Use (2020-2032) (USD Billion)
10.5.2 Africa
10.5.2.1 Trends Analysis
10.5.2.2 Africa Intraoral Cameras Market Estimates and Forecasts, by Country (2020-2032) (USD Billion)
10.5.2.3 Africa Intraoral Cameras Market Estimates and Forecasts, By Product (2020-2032) (USD Billion)
10.5.2.4 Africa Intraoral Cameras Market Estimates and Forecasts, By Technology (2020-2032) (USD Billion)
10.5.2.5 Africa Intraoral Cameras Market Estimates and Forecasts, By End Use (2020-2032) (USD Billion)
10.5.2.6 South Africa
10.5.2.6.1 South Africa Intraoral Cameras Market Estimates and Forecasts, By Product (2020-2032) (USD Billion)
10.5.2.6.2 South Africa Intraoral Cameras Market Estimates and Forecasts, By Technology (2020-2032) (USD Billion)
10.5.2.6.3 South Africa Intraoral Cameras Market Estimates and Forecasts, By End Use (2020-2032) (USD Billion)
10.5.2.7 Nigeria
10.5.2.7.1 Nigeria Intraoral Cameras Market Estimates and Forecasts, By Product (2020-2032) (USD Billion)
10.5.2.7.2 Nigeria Intraoral Cameras Market Estimates and Forecasts, By Technology (2020-2032) (USD Billion)
10.5.2.7.3 Nigeria Intraoral Cameras Market Estimates and Forecasts, By End Use (2020-2032) (USD Billion)
10.5.2.8 Rest of Africa
10.5.2.8.1 Rest of Africa Intraoral Cameras Market Estimates and Forecasts, By Product (2020-2032) (USD Billion)
10.5.2.8.2 Rest of Africa Intraoral Cameras Market Estimates and Forecasts, By Technology (2020-2032) (USD Billion)
10.5.2.8.3 Rest of Africa Intraoral Cameras Market Estimates and Forecasts, By End Use (2020-2032) (USD Billion)
10.6 Latin America
10.6.1 Trends Analysis
10.6.2 Latin America Intraoral Cameras Market Estimates and Forecasts, by Country (2020-2032) (USD Billion)
10.6.3 Latin America Intraoral Cameras Market Estimates and Forecasts, By Product (2020-2032) (USD Billion)
10.6.4 Latin America Intraoral Cameras Market Estimates and Forecasts, By Technology (2020-2032) (USD Billion)
10.6.5 Latin America Intraoral Cameras Market Estimates and Forecasts, By End Use (2020-2032) (USD Billion)
10.6.6 Brazil
10.6.6.1 Brazil Intraoral Cameras Market Estimates and Forecasts, By Product (2020-2032) (USD Billion)
10.6.6.2 Brazil Intraoral Cameras Market Estimates and Forecasts, By Technology (2020-2032) (USD Billion)
10.6.6.3 Brazil Intraoral Cameras Market Estimates and Forecasts, By End Use (2020-2032) (USD Billion)
10.6.7 Argentina
10.6.7.1 Argentina Intraoral Cameras Market Estimates and Forecasts, By Product (2020-2032) (USD Billion)
10.6.7.2 Argentina Intraoral Cameras Market Estimates and Forecasts, By Technology (2020-2032) (USD Billion)
10.6.7.3 Argentina Intraoral Cameras Market Estimates and Forecasts, By End Use (2020-2032) (USD Billion)
10.6.8 Colombia
10.6.8.1 Colombia Intraoral Cameras Market Estimates and Forecasts, By Product (2020-2032) (USD Billion)
10.6.8.2 Colombia Intraoral Cameras Market Estimates and Forecasts, By Technology (2020-2032) (USD Billion)
10.6.8.3 Colombia Intraoral Cameras Market Estimates and Forecasts, By End Use (2020-2032) (USD Billion)
10.6.9 Rest of Latin America
10.6.9.1 Rest of Latin America Intraoral Cameras Market Estimates and Forecasts, By Product (2020-2032) (USD Billion)
10.6.9.2 Rest of Latin America Intraoral Cameras Market Estimates and Forecasts, By Technology (2020-2032) (USD Billion)
10.6.9.3 Rest of Latin America Intraoral Cameras Market Estimates and Forecasts, By End Use (2020-2032) (USD Billion)
11. Company Profiles
11.1 Dentsply Sirona
11.1.1 Company Overview
11.1.2 Financial
11.1.3 Products/ Services Offered
11.1.4 SWOT Analysis
11.2 Carestream Dental
11.2.1 Company Overview
11.2.2 Financial
11.2.3 Products/ Services Offered
11.2.4 SWOT Analysis
11.3 Danaher Corporation
11.3.1 Company Overview
11.3.2 Financial
11.3.3 Products/ Services Offered
11.3.4 SWOT Analysis
11.4 KaVo Dental
11.4.1 Company Overview
11.4.2 Financial
11.4.3 Products/ Services Offered
11.4.4 SWOT Analysis
11.5 Planmeca
11.5.1 Company Overview
11.5.2 Financial
11.5.3 Products/ Services Offered
11.5.4 SWOT Analysis
11.6 Acteon Group
11.6.1 Company Overview
11.6.2 Financial
11.6.3 Products/ Services Offered
11.6.4 SWOT Analysis
11.7 MouthWatch
11.7.1 Company Overview
11.7.2 Financial
11.7.3 Products/ Services Offered
11.7.4 SWOT Analysis
11.8 Digital Doc LLC
11.8.1 Company Overview
11.8.2 Financial
11.8.3 Products/ Services Offered
11.8.4 SWOT Analysis
11.9 Air Techniques
11.9.1 Company Overview
11.9.2 Financial
11.9.3 Products/ Services Offered
11.9.4 SWOT Analysis
11.10 Durr Dental
11.10.1 Company Overview
11.10.2 Financial
11.10.3 Products/ Services Offered
11.10.4 SWOT Analysis
12. Use Cases and Best Practices
13. Conclusion
An accurate research report requires proper strategizing as well as implementation. There are multiple factors involved in the completion of good and accurate research report and selecting the best methodology to compete the research is the toughest part. Since the research reports we provide play a crucial role in any company’s decision-making process, therefore we at SNS Insider always believe that we should choose the best method which gives us results closer to reality. This allows us to reach at a stage wherein we can provide our clients best and accurate investment to output ratio.
Each report that we prepare takes a timeframe of 350-400 business hours for production. Starting from the selection of titles through a couple of in-depth brain storming session to the final QC process before uploading our titles on our website we dedicate around 350 working hours. The titles are selected based on their current market cap and the foreseen CAGR and growth.
The 5 steps process:
Step 1: Secondary Research:
Secondary Research or Desk Research is as the name suggests is a research process wherein, we collect data through the readily available information. In this process we use various paid and unpaid databases which our team has access to and gather data through the same. This includes examining of listed companies’ annual reports, Journals, SEC filling etc. Apart from this our team has access to various associations across the globe across different industries. Lastly, we have exchange relationships with various university as well as individual libraries.

Step 2: Primary Research
When we talk about primary research, it is a type of study in which the researchers collect relevant data samples directly, rather than relying on previously collected data. This type of research is focused on gaining content specific facts that can be sued to solve specific problems. Since the collected data is fresh and first hand therefore it makes the study more accurate and genuine.
We at SNS Insider have divided Primary Research into 2 parts.
Part 1 wherein we interview the KOLs of major players as well as the upcoming ones across various geographic regions. This allows us to have their view over the market scenario and acts as an important tool to come closer to the accurate market numbers. As many as 45 paid and unpaid primary interviews are taken from both the demand and supply side of the industry to make sure we land at an accurate judgement and analysis of the market.
This step involves the triangulation of data wherein our team analyses the interview transcripts, online survey responses and observation of on filed participants. The below mentioned chart should give a better understanding of the part 1 of the primary interview.

Part 2: In this part of primary research the data collected via secondary research and the part 1 of the primary research is validated with the interviews from individual consultants and subject matter experts.
Consultants are those set of people who have at least 12 years of experience and expertise within the industry whereas Subject Matter Experts are those with at least 15 years of experience behind their back within the same space. The data with the help of two main processes i.e., FGDs (Focused Group Discussions) and IDs (Individual Discussions). This gives us a 3rd party nonbiased primary view of the market scenario making it a more dependable one while collation of the data pointers.
Step 3: Data Bank Validation
Once all the information is collected via primary and secondary sources, we run that information for data validation. At our intelligence centre our research heads track a lot of information related to the market which includes the quarterly reports, the daily stock prices, and other relevant information. Our data bank server gets updated every fortnight and that is how the information which we collected using our primary and secondary information is revalidated in real time.

Step 4: QA/QC Process
After all the data collection and validation our team does a final level of quality check and quality assurance to get rid of any unwanted or undesired mistakes. This might include but not limited to getting rid of the any typos, duplication of numbers or missing of any important information. The people involved in this process include technical content writers, research heads and graphics people. Once this process is completed the title gets uploader on our platform for our clients to read it.
Step 5: Final QC/QA Process:
This is the last process and comes when the client has ordered the study. In this process a final QA/QC is done before the study is emailed to the client. Since we believe in giving our clients a good experience of our research studies, therefore, to make sure that we do not lack at our end in any way humanly possible we do a final round of quality check and then dispatch the study to the client.
By Product
Intraoral Wand
Single Lens Reflex
By Technology
USB Camera
Fiber Optic Camera
Wireless Cameras
Others
By End Use
Hospital
Dental Clinic
Others
Request for Segment Customization as per your Business Requirement: Segment Customization Request
REGIONAL COVERAGE:
North America
US
Canada
Mexico
Europe
Eastern Europe
Poland
Romania
Hungary
Turkey
Rest of Eastern Europe
Western Europe
Germany
France
UK
Italy
Spain
Netherlands
Switzerland
Austria
Rest of Western Europe
Asia Pacific
China
India
Japan
South Korea
Vietnam
Singapore
Australia
Rest of Asia Pacific
Middle East & Africa
Middle East
UAE
Egypt
Saudi Arabia
Qatar
Rest of the Middle East
Africa
Nigeria
South Africa
Rest of Africa
Latin America
Brazil
Argentina
Colombia
Rest of Latin America
Request for Country Level Research Report: Country Level Customization Request
Available Customization
With the given market data, SNS Insider offers customization as per the company’s specific needs. The following customization options are available for the report:
Product Analysis
Criss-Cross segment analysis (e.g. Product X Application)
Product Matrix which gives a detailed comparison of product portfolio of each company
Geographic Analysis
Additional countries in any of the regions
Company Information
Detailed analysis and profiling of additional market players (Up to five)
The Military Wearable Medical Device Market Size was valued at USD 7.84 billion in 2023 and is expected to reach USD 64.47 billion by 2032, and grow at a CAGR of 26.40% over the forecast period 2024-2032.
The Venous Thromboembolism Treatment Market Size was valued at USD 1.05 Bn in 2023, and is expected to reach USD 2.13 Bn by 2032, and grow at a CAGR of 8.50% Over the Forecast Period of 2024-2032.
The Oncology-Based Molecular Diagnostics Market was valued at USD 2.76 billion in 2023 and is expected to reach USD 7.71 billion by 2032, growing at a CAGR of 12.12% over the forecast period of 2024-2032.
Medical Waste Containers Market Size was valued at USD 2.0 Billion in 2023 and is expected to reach USD 3.91 Billion by 2032, growing at a CAGR of 7.7% over the forecast period 2024-2032.
The Teleradiology Market Size was valued at USD 12.67 Billion in 2023 and is expected to reach USD 96.72 billion by 2032, growing at a CAGR of 25.36% over the forecast period 2024-2032.
The Blood Processing Devices and Consumables Market was valued at USD 48.3 billion in 2023 and is expected to reach USD 89.41 billion by 2032, growing at a CAGR of 7.11% over the forecast period of 2024-2032.

Hi! Click one of our member below to chat on Phone
© 2025 All Rights Reserved by SNS Insider Pvt Ltd


