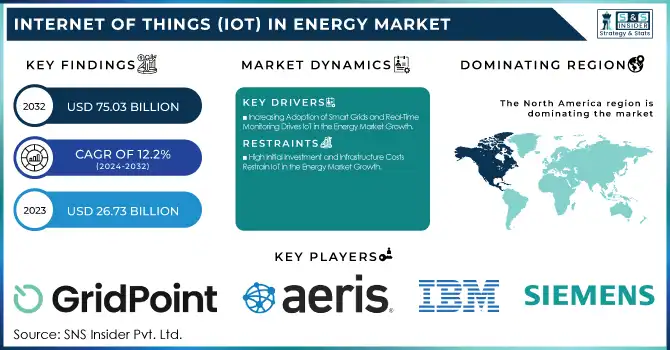
The Internet Of Things (IoT) In Energy Market Size was valued at USD 26.73 Billion in 2023 and is expected to reach USD 75.03 Billion by 2032 and grow at a CAGR of 12.2% over the forecast period 2024-2032.
To Get more information on Internet Of Things (IoT) In Energy Market - Request Free Sample Report
The IoT in the Energy Market is revolutionizing the industry by improving efficiency, optimizing resources, and enabling predictive maintenance. Key applications include real-time monitoring, smart grids, and remote asset management, driving cost savings and sustainability. IoT adoption has led to 30% energy waste reduction, 25% lower maintenance costs, and 17% shorter outage durations. Additionally, IoT enhances solar and wind energy efficiency by 10%. The integration of AI and machine learning further boosts energy analytics and automation. With increasing IoT deployments and a push for carbon reduction, the market is set for significant growth and transformation.
Key Drivers:
Increasing Adoption of Smart Grids and Real-Time Monitoring Drives IoT in the Energy Market Growth
Smart grids leverage IoT sensors, connected devices, and AI-driven analytics to enhance power distribution efficiency, minimize energy losses, and improve grid resilience. Real-time monitoring enables energy providers to track power consumption, detect faults, and optimize electricity distribution, leading to significant cost savings and enhanced sustainability.
Moreover, IoT-based energy management systems help industries and residential consumers reduce their energy consumption by identifying inefficiencies and automating power usage. Governments worldwide are also investing in smart grid infrastructure to modernize aging power systems, enhance renewable energy integration, and improve demand-side energy management. The rising need for reliable power supply and sustainable energy solutions further accelerates IoT adoption in the energy sector.
Additionally, the increasing penetration of AI, machine learning, and cloud computing further strengthens IoT capabilities, enabling enhanced automation and decision-making in the energy market. As energy companies seek to improve efficiency and sustainability, the adoption of IoT-enabled smart grids and monitoring systems is expected to surge significantly in the coming years.
Restrain:
High Initial Investment and Infrastructure Costs Restrain IoT in the Energy Market Growth
Despite its benefits, the IoT in the energy market faces a major restraint due to high initial investment and infrastructure costs. Deploying IoT-based energy solutions requires substantial financial investment in hardware, software, and network infrastructure, making it challenging for small and medium-sized enterprises (SMEs) and developing regions to adopt such technologies. The cost of implementing IoT-enabled smart grids, connected sensors, and real-time monitoring systems can be prohibitively expensive, particularly in areas with aging power infrastructure.
Additionally, integrating IoT with existing energy management systems demands specialized expertise and customized solutions, further escalating operational costs. The high cost of data storage and cybersecurity measures also adds to the overall expenditure, making large-scale IoT adoption financially daunting. Energy companies must ensure robust cybersecurity protocols to prevent data breaches, increasing compliance costs.
Opportunities:
Growing Integration of IoT with Renewable Energy Creates Significant Market Opportunities
As the global focus shifts towards sustainability and carbon footprint reduction, renewable energy sources such as solar, wind, and hydroelectric power are gaining traction. IoT solutions play a crucial role in optimizing renewable energy generation, storage, and distribution by providing real-time data insights, predictive analytics, and automated controls. Smart IoT sensors and AI-driven analytics help monitor weather conditions, predict energy output, and optimize energy distribution.
IoT enables smart energy storage systems, allowing for better energy management and grid stability by storing surplus renewable energy and distributing it during peak demand periods. Governments and private investors are increasingly funding IoT-enabled renewable energy projects, further boosting market growth. The development of smart microgrids and decentralized energy systems also benefits from IoT adoption, allowing energy providers and consumers to efficiently manage power flow. As renewable energy adoption continues to expand globally, IoT solutions will play a pivotal role in improving efficiency, reducing costs, and accelerating the transition toward a sustainable energy future.
Challenges:
Cybersecurity Threats and Data Privacy Concerns Pose Challenges to IoT in the Energy Market Growth
The IoT in the energy market faces significant challenges due to cybersecurity threats and data privacy concerns. As IoT-connected devices generate and transmit vast amounts of real-time energy data, they become prime targets for cyberattacks, hacking, and data breaches. Critical infrastructure vulnerabilities can lead to severe consequences, including power outages, operational disruptions, and financial losses. The lack of standardized security protocols across IoT energy systems further increases the risk of cyber threats. Many legacy energy infrastructures were not designed with IoT security in mind, making them susceptible to hacking and unauthorized access.
Additionally, IoT-based energy management solutions rely heavily on cloud computing and data analytics, raising concerns about data ownership, regulatory compliance, and privacy protection. Governments and regulatory bodies are enforcing stricter cybersecurity laws and compliance measures to mitigate these risks, but energy companies still struggle with implementing comprehensive security frameworks. Ensuring end-to-end encryption, secure authentication, and real-time threat monitoring is crucial to safeguarding IoT-driven energy networks.
By Component
In 2023, the Solution segment dominated the IoT in the energy market, accounting for 82% of revenue. This segment encompasses hardware and software components that facilitate real-time monitoring, data analytics, and automation within energy systems. The substantial revenue share reflects the energy sector's increasing investment in IoT solutions to enhance operational efficiency and sustainability. Notable developments include Schneider Electric's launch of the EcoStruxure IoT platform, designed to provide comprehensive energy management solutions through advanced analytics and automation. Similarly, Siemens introduced the MindSphere IoT operating system, enabling seamless integration and analysis of energy data to optimize performance.
The Services segment is projected to experience the Fastest CAGR of 13.4% during the forecast period. This segment includes consulting, implementation, and managed services that support the deployment and maintenance of IoT technologies in the energy sector. The anticipated growth is driven by the increasing complexity of IoT ecosystems, necessitating specialized expertise for effective implementation and management. Companies like IBM have expanded their IoT services offerings, providing comprehensive consulting and integration services tailored to the energy industry.
Additionally, Accenture has developed specialized IoT services to assist energy companies in digital transformation initiatives, focusing on enhancing efficiency and sustainability. The rising demand for these services highlights the importance of expert guidance in navigating the complexities of IoT adoption, ensuring secure and efficient integration into existing energy infrastructures.
By Application
In 2023, the Smart Grid segment emerged as the leading revenue contributor in the IoT in Energy Market. Smart grids utilize IoT technologies to enhance the efficiency, reliability, and sustainability of electricity distribution. This platform exemplifies how IoT solutions are being deployed to modernize grid infrastructures, improve operational efficiency, and support decarbonization efforts. The integration of IoT into smart grids enables real-time monitoring, predictive maintenance, and efficient energy management, thereby reducing operational costs and enhancing service reliability. The dominance of the Smart Grid segment underscores the critical role of IoT technologies in transforming traditional energy infrastructures into more intelligent and responsive systems, aligning with global sustainability goals.
The Coal Mining segment is projected to experience the highest compound annual growth rate (CAGR) within the forecasted period. The adoption of IoT in coal mining operations aims to enhance safety, optimize production processes, and reduce operational costs. IoT applications in this sector include real-time monitoring of equipment, environmental conditions, and worker safety, which collectively contribute to more efficient and secure mining operations. While specific company launches and product developments in the coal mining IoT segment were not highlighted in the provided sources, the anticipated growth indicates a significant trend toward digital transformation in the industry. The integration of IoT technologies in coal mining reflects a broader movement toward leveraging advanced technologies to improve operational efficiency and safety standards in traditional energy sectors.
By Connectivity
In 2023, Wi-Fi emerged as the dominant connectivity technology in the IoT energy market, capturing 35% of the revenue share. Wi-Fi's widespread adoption is attributed to its robust data transmission capabilities, established infrastructure, and seamless integration with existing networks, making it ideal for energy applications requiring high data throughput and reliable communication. A notable development in this space is Morse Micro's recognition at the 2023 Wi-Fi NOW Awards, where it won the Best Wi-Fi IoT Product award for its innovative Wi-Fi HaLow solutions. These solutions are tailored for IoT applications, offering extended range and lower power consumption, which are crucial for energy sector deployments. The integration of advanced Wi-Fi technologies facilitates real-time monitoring, predictive maintenance, and efficient energy management, thereby enhancing operational efficiency and reducing costs.
The Z-Wave segment is projected to experience the highest CAGR of 13.0% during the forecasted period. Z-Wave's growth is driven by its reliable, low-power, and secure mesh networking capabilities, which are particularly suited for energy management applications. In April 2024, Trident IoT launched the Taurus Z-Wave Series, encompassing system-on-chip (SoC) solutions and modules that support the latest advancements in Z-Wave technology, including Z-Wave Long Range (ZWLR). This innovation enables extended connectivity, supporting up to 4,000 devices on a single network, which is beneficial for large-scale energy management systems. Additionally, Shelly Group unveiled an upgraded Z-Wave lineup featuring ZWLR technology, offering up to a 1-mile connectivity range and enhanced energy efficiency, making it ideal for extensive energy infrastructures. The rapid adoption of Z-Wave technology reflects a growing trend toward implementing scalable and efficient IoT solutions in the energy sector, facilitating improved monitoring, control, and optimization of energy resources.
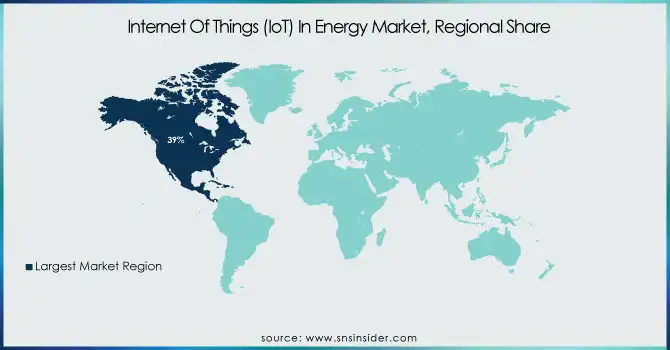
In 2023, North America led the Internet of Things (IoT) in the energy market, accounting for approximately 39% of the global revenue share. This dominance is attributed to the region's robust technological infrastructure and strong policy support for smart energy solutions. For example, the integration of IoT technologies has enabled efficient management of renewable energy sources, enhanced grid reliability, and provided consumers with real-time energy usage data, thereby optimizing energy production and consumption.
Meanwhile, the Asia Pacific region is experiencing rapid growth in the IoT energy sector, with an anticipated CAGR of 13.3% from 2024 to 2032. This surge is driven by rapid urbanization and the rising need for efficient energy management systems. Investments in smart grid technologies and the expansion of renewable energy sources are complemented by IoT innovations, allowing for enhanced energy distribution and monitoring, catering to the region's escalating energy demands. For instance, countries like China and Japan are focusing on reducing their carbon footprints and investing heavily in smart city projects, which include the deployment of IoT solutions in energy management.
Get Customized Report as per Your Business Requirement - Enquiry Now
Some of the major players in the Internet Of Things (IoT) In Energy Market are:
GridPoint, Inc. (GridPoint Energy Management System, GridPoint Smart Building Platform)
Aeris Communications, Inc. (Aeris Fusion IoT Network, Aeris Intelligent IoT Connectivity)
IBM Corporation (IBM Maximo Asset Monitor, IBM Watson IoT Platform)
Siemens AG (MindSphere IoT Platform, Siemens Spectrum Power)
Johnson Controls International PLC (OpenBlue Enterprise Manager, Johnson Controls Metasys)
AGT International SpA (IoTA Industrial IoT Platform, AGT Predictive Energy Analytics)
Cisco Systems, Inc. (Cisco Kinetic for Cities, Cisco IoT Control Center)
Davra Networks Limited (Davra IoT Platform, Davra Energy Optimization Suite)
Intel Corporation (Intel IoT Gateway, Intel Edge Insights for Industrial)
SAP SE (SAP Leonardo IoT, SAP Predictive Maintenance and Service)
September 2023: Aeris Communications, an IoT and telematics solutions provider based in Noida, India, reported that over 75% of its revenue originated from the domestic electric vehicle (EV) industry, particularly from electric two- and three-wheeler original equipment manufacturers (OEMs) and last-mile delivery and logistics service providers.
January 2025: IBM highlighted the transformative role of IoT data in driving innovation across industries. The proliferation of 5G technology facilitated the widespread deployment of IoT devices, from vehicles and household appliances to drones and manufacturing plants. These devices collected and shared data over high-speed networks, enabling advancements in artificial intelligence and cloud computing.
Report Attributes | Details |
---|---|
Market Size in 2023 | US$ 26.73 Billion |
Market Size by 2032 | US$ 75.03 Billion |
CAGR | CAGR of 12.2 % From 2024 to 2032 |
Base Year | 2023 |
Forecast Period | 2024-2032 |
Historical Data | 2020-2022 |
Report Scope & Coverage | Market Size, Segments Analysis, Competitive Landscape, Regional Analysis, DROC & SWOT Analysis, Forecast Outlook |
Key Segments | •By Component type (Solution [Asset Management, Energy Management, Safety Solution, Connected Logistics, Compliance & Risk Management, Data Management & Analytics, Others], Service [Professional Services, Managed Services]) •By Application (Oil & Gas, Coal Mine, Smart Grid) •By Deployment Mode (On-premise, Cloud) •By Connectivity (Zigbee, Wi-Fi, Bluetooth, Z-Wave, Others) |
Regional Analysis/Coverage | North America (US, Canada, Mexico), Europe (Eastern Europe [Poland, Romania, Hungary, Turkey, Rest of Eastern Europe] Western Europe] Germany, France, UK, Italy, Spain, Netherlands, Switzerland, Austria, Rest of Western Europe]), Asia Pacific (China, India, Japan, South Korea, Vietnam, Singapore, Australia, Rest of Asia Pacific), Middle East & Africa (Middle East [UAE, Egypt, Saudi Arabia, Qatar, Rest of Middle East], Africa [Nigeria, South Africa, Rest of Africa], Latin America (Brazil, Argentina, Colombia, Rest of Latin America) |
Company Profiles | GridPoint, Inc., Aeris Communications, Inc., IBM Corporation, Siemens AG, Johnson Controls International PLC, AGT International SpA, Cisco Systems, Inc., Davra Networks Limited, Intel Corporation, SAP SE. |
Ans: The Internet Of Things (IoT) In Energy Market is expected to grow at a CAGR of 12.2% during 2024-2032.
Ans: The Internet Of Things (IoT) In Energy Market size was USD 26.73 billion in 2023 and is expected to Reach USD 75.03 billion by 2032.
Ans: The major growth factor of the IoT in the energy market is the increasing adoption of smart grids, real-time monitoring, and automation to enhance energy efficiency and sustainability.
Ans: The Wi-Fi segment dominated the Internet Of Things (IoT) In Energy Market.
Ans: North America dominated the Internet Of Things (IoT) In Energy Market in 2023.
Table Of Content
1. Introduction
1.1 Market Definition
1.2 Scope (Inclusion and Exclusions)
1.3 Research Assumptions
2. Executive Summary
2.1 Market Overview
2.2 Regional Synopsis
2.3 Competitive Summary
3. Research Methodology
3.1 Top-Down Approach
3.2 Bottom-up Approach
3.3. Data Validation
3.4 Primary Interviews
4. Market Dynamics Impact Analysis
4.1 Market Driving Factors Analysis
4.1.1 Drivers
4.1.2 Restraints
4.1.3 Opportunities
4.1.4 Challenges
4.2 PESTLE Analysis
4.3 Porter’s Five Forces Model
5. Statistical Insights and Trends Reporting
5.1 Energy Efficiency Gains, 2023
5.2 Smart Grid Impact, 2023
5.3 Renewable Energy Optimization, 2023
5.4 Cybersecurity Trends
6. Competitive Landscape
6.1 List of Major Companies, By Region
6.2 Market Share Analysis, By Region
6.3 Product Benchmarking
6.3.1 Product specifications and features
6.3.2 Pricing
6.4 Strategic Initiatives
6.4.1 Marketing and promotional activities
6.4.2 Distribution and Supply Chain Strategies
6.4.3 Expansion plans and new product launches
6.4.4 Strategic partnerships and collaborations
6.5 Technological Advancements
6.6 Market Positioning and Branding
7. Internet Of Things (IoT) In Energy Market Segmentation, By Connectivity
7.1 Chapter Overview
7.2 Zigbee
7.2.1 Zigbee Market Trends Analysis (2020-2032)
7.2.2 Zigbee Market Size Estimates and Forecasts to 2032 (USD Billion)
7.3 Wi-Fi
7.3.1 Wi-Fi Market Trends Analysis (2020-2032)
7.3.2 Wi-Fi Market Size Estimates and Forecasts to 2032 (USD Billion)
7.4 Bluetooth
7.4.1 Bluetooth Market Trends Analysis (2020-2032)
7.4.2 Bluetooth Market Size Estimates and Forecasts to 2032 (USD Billion)
7.5 Z-Wave
7.5.1 Z-Wave Market Trends Analysis (2020-2032)
7.5.2 Z-Wave Market Size Estimates and Forecasts to 2032 (USD Billion)
7.6 Others
7.6.1 Others Market Trends Analysis (2020-2032)
7.6.2 Others Market Size Estimates and Forecasts to 2032 (USD Billion)
8. Internet Of Things (IoT) In Energy Market Segmentation, By Deployment Mode
8.1 Chapter Overview
8.2 On-premises
8.2.1 On-premises Market Trends Analysis (2020-2032)
8.2.2 On-premises Market Size Estimates and Forecasts to 2032 (USD Billion)
8.3 cloud
8.3.1 cloud Market Trends Analysis (2020-2032)
8.3.2 cloud Market Size Estimates and Forecasts to 2032 (USD Billion)
9. Internet Of Things (IoT) In Energy Market Segmentation, By Application
9.1 Chapter Overview
9.2 Oil & Gas
9.2.1 Oil & Gas Market Trends Analysis (2020-2032)
9.2.2 Oil & Gas Market Size Estimates and Forecasts to 2032 (USD Billion)
9.3 Coal Mine
9.3.1 Coal Mine Market Trends Analysis (2020-2032)
9.3.2 Coal Mine Market Size Estimates and Forecasts to 2032 (USD Billion)
9.4 Smart Grid
9.4.1 Smart Grid Market Trends Analysis (2020-2032)
9.4.2 Smart Grid Market Size Estimates and Forecasts to 2032 (USD Billion)
10. Internet Of Things (IoT) In Energy Market Segmentation, By Component
10.1 Chapter Overview
10.2 Solution
10.2.1 Solution Market Trends Analysis (2020-2032)
10.2.2 Solution Market Size Estimates and Forecasts to 2032 (USD Billion)
10.2.3 Asset Management
10.2.3.1 Asset Management Market Trends Analysis (2020-2032)
10.2.3.2 Asset Management Market Size Estimates and Forecasts to 2032 (USD Billion)
10.2.4 Energy Management
10.2.4.1 Energy Management Market Trends Analysis (2020-2032)
10.2.4.2 Energy Management Market Size Estimates and Forecasts to 2032 (USD Billion)
10.2.5 Safety Solution
10.2.5.1 Safety Solution Market Trends Analysis (2020-2032)
10.2.5.2 Safety Solution Market Size Estimates and Forecasts to 2032 (USD Billion)
10.2.6 Connected Logistics
10.2.6.1 Connected Logistics Market Trends Analysis (2020-2032)
10.2.6.2 Connected Logistics Market Size Estimates and Forecasts to 2032 (USD Billion)
10.2.7 Compliance & Risk Management
10.2.7.1 Compliance & Risk Management Market Trends Analysis (2020-2032)
10.2.7.2 Compliance & Risk Management Market Size Estimates and Forecasts to 2032 (USD Billion)
10.2.8 Data Management & Analytics
10.2.8.1 Data Management & Analytics Market Trends Analysis (2020-2032)
10.2.8.2 Data Management & Analytics Market Size Estimates and Forecasts to 2032 (USD Billion)
10.2.9 Others
10.2.9.1 Others Market Trends Analysis (2020-2032)
10.2.9.2 Others Market Size Estimates and Forecasts to 2032 (USD Billion)
10.3 Services
10.3.1 Services App Market Trends Analysis (2020-2032)
10.3.2 Services App Market Size Estimates and Forecasts to 2032 (USD Billion)
10.3.3 Professional Services
10.3.3.1 Professional Services App Market Trends Analysis (2020-2032)
10.3.3.2 Professional Services App Market Size Estimates and Forecasts to 2032 (USD Billion)
10.3.4 Managed Services
10.3.4.1 Managed Services App Market Trends Analysis (2020-2032)
10.3.4.2 Managed Services App Market Size Estimates and Forecasts to 2032 (USD Billion)
11. Regional Analysis
11.1 Chapter Overview
11.2 North America
11.2.1 Trends Analysis
11.2.2 North America Internet Of Things (IoT) In Energy Market Estimates and Forecasts, by Country (2020-2032) (USD Billion)
11.2.3 North America Internet Of Things (IoT) In Energy Market Estimates and Forecasts, By Connectivity (2020-2032) (USD Billion)
11.2.4 North America Internet Of Things (IoT) In Energy Market Estimates and Forecasts, By Deployment Mode (2020-2032) (USD Billion)
11.2.5 North America Internet Of Things (IoT) In Energy Market Estimates and Forecasts, By Application (2020-2032) (USD Billion)
11.2.6 North America Internet Of Things (IoT) In Energy Market Estimates and Forecasts, By Component(2020-2032) (USD Billion)
11.2.7 USA
11.2.7.1 USA Internet Of Things (IoT) In Energy Market Estimates and Forecasts, By Connectivity (2020-2032) (USD Billion)
11.2.7.2 USA Internet Of Things (IoT) In Energy Market Estimates and Forecasts, By Deployment Mode (2020-2032) (USD Billion)
11.2.7.3 USA Internet Of Things (IoT) In Energy Market Estimates and Forecasts, By Application (2020-2032) (USD Billion)
11.2.7.4 USA Internet Of Things (IoT) In Energy Market Estimates and Forecasts, By Component(2020-2032) (USD Billion)
11.2.8 Canada
11.2.8.1 Canada Internet Of Things (IoT) In Energy Market Estimates and Forecasts, By Connectivity (2020-2032) (USD Billion)
11.2.8.2 Canada Internet Of Things (IoT) In Energy Market Estimates and Forecasts, By Deployment Mode (2020-2032) (USD Billion)
11.2.8.3 Canada Internet Of Things (IoT) In Energy Market Estimates and Forecasts, By Application (2020-2032) (USD Billion)
11.2.8.4 Canada Internet Of Things (IoT) In Energy Market Estimates and Forecasts, By Component (2020-2032) (USD Billion)
11.2.9 Mexico
11.2.9.1 Mexico Internet Of Things (IoT) In Energy Market Estimates and Forecasts, By Connectivity (2020-2032) (USD Billion)
11.2.9.2 Mexico Internet Of Things (IoT) In Energy Market Estimates and Forecasts, By Deployment Mode (2020-2032) (USD Billion)
11.2.9.3 Mexico Internet Of Things (IoT) In Energy Market Estimates and Forecasts, By Application (2020-2032) (USD Billion)
11.2.9.4 Mexico Internet Of Things (IoT) In Energy Market Estimates and Forecasts, By Component (2020-2032) (USD Billion)
11.3 Europe
11.3.1 Eastern Europe
11.3.1.1 Trends Analysis
11.3.1.2 Eastern Europe Internet Of Things (IoT) In Energy Market Estimates and Forecasts, by Country (2020-2032) (USD Billion)
11.3.1.3 Eastern Europe Internet Of Things (IoT) In Energy Market Estimates and Forecasts, By Connectivity (2020-2032) (USD Billion)
11.3.1.4 Eastern Europe Internet Of Things (IoT) In Energy Market Estimates and Forecasts, By Deployment Mode (2020-2032) (USD Billion)
11.3.1.5 Eastern Europe Internet Of Things (IoT) In Energy Market Estimates and Forecasts, By Application (2020-2032) (USD Billion)
11.3.1.6 Eastern Europe Internet Of Things (IoT) In Energy Market Estimates and Forecasts, By Component(2020-2032) (USD Billion)
11.3.1.7 Poland
11.3.1.7.1 Poland Internet Of Things (IoT) In Energy Market Estimates and Forecasts, By Connectivity (2020-2032) (USD Billion)
11.3.1.7.2 Poland Internet Of Things (IoT) In Energy Market Estimates and Forecasts, By Deployment Mode (2020-2032) (USD Billion)
11.3.1.7.3 Poland Internet Of Things (IoT) In Energy Market Estimates and Forecasts, By Application (2020-2032) (USD Billion)
11.3.1.7.4 Poland Internet Of Things (IoT) In Energy Market Estimates and Forecasts, By Component(2020-2032) (USD Billion)
11.3.1.8 Romania
11.3.1.8.1 Romania Internet Of Things (IoT) In Energy Market Estimates and Forecasts, By Connectivity (2020-2032) (USD Billion)
11.3.1.8.2 Romania Internet Of Things (IoT) In Energy Market Estimates and Forecasts, By Deployment Mode (2020-2032) (USD Billion)
11.3.1.8.3 Romania Internet Of Things (IoT) In Energy Market Estimates and Forecasts, By Application (2020-2032) (USD Billion)
11.3.1.8.4 Romania Internet Of Things (IoT) In Energy Market Estimates and Forecasts, By Component (2020-2032) (USD Billion)
11.3.1.9 Hungary
11.3.1.9.1 Hungary Internet Of Things (IoT) In Energy Market Estimates and Forecasts, By Connectivity (2020-2032) (USD Billion)
11.3.1.9.2 Hungary Internet Of Things (IoT) In Energy Market Estimates and Forecasts, By Deployment Mode (2020-2032) (USD Billion)
11.3.1.9.3 Hungary Internet Of Things (IoT) In Energy Market Estimates and Forecasts, By Application (2020-2032) (USD Billion)
11.3.1.9.4 Hungary Internet Of Things (IoT) In Energy Market Estimates and Forecasts, By Component (2020-2032) (USD Billion)
11.3.1.10 Turkey
11.3.1.10.1 Turkey Internet Of Things (IoT) In Energy Market Estimates and Forecasts, By Connectivity (2020-2032) (USD Billion)
11.3.1.10.2 Turkey Internet Of Things (IoT) In Energy Market Estimates and Forecasts, By Deployment Mode (2020-2032) (USD Billion)
11.3.1.10.3 Turkey Internet Of Things (IoT) In Energy Market Estimates and Forecasts, By Application (2020-2032) (USD Billion)
11.3.1.10.4 Turkey Internet Of Things (IoT) In Energy Market Estimates and Forecasts, By Component (2020-2032) (USD Billion)
11.3.1.11 Rest of Eastern Europe
11.3.1.11.1 Rest of Eastern Europe Internet Of Things (IoT) In Energy Market Estimates and Forecasts, By Connectivity (2020-2032) (USD Billion)
11.3.1.11.2 Rest of Eastern Europe Internet Of Things (IoT) In Energy Market Estimates and Forecasts, By Deployment Mode (2020-2032) (USD Billion)
11.3.1.11.3 Rest of Eastern Europe Internet Of Things (IoT) In Energy Market Estimates and Forecasts, By Application (2020-2032) (USD Billion)
11.3.1.11.4 Rest of Eastern Europe Internet Of Things (IoT) In Energy Market Estimates and Forecasts, By Component (2020-2032) (USD Billion)
11.3.2 Western Europe
11.3.2.1 Trends Analysis
11.3.2.2 Western Europe Internet Of Things (IoT) In Energy Market Estimates and Forecasts, by Country (2020-2032) (USD Billion)
11.3.2.3 Western Europe Internet Of Things (IoT) In Energy Market Estimates and Forecasts, By Connectivity (2020-2032) (USD Billion)
11.3.2.4 Western Europe Internet Of Things (IoT) In Energy Market Estimates and Forecasts, By Deployment Mode (2020-2032) (USD Billion)
11.3.2.5 Western Europe Internet Of Things (IoT) In Energy Market Estimates and Forecasts, By Application (2020-2032) (USD Billion)
11.3.2.6 Western Europe Internet Of Things (IoT) In Energy Market Estimates and Forecasts, By Component (2020-2032) (USD Billion)
11.3.2.7 Germany
11.3.2.7.1 Germany Internet Of Things (IoT) In Energy Market Estimates and Forecasts, By Connectivity (2020-2032) (USD Billion)
11.3.2.7.2 Germany Internet Of Things (IoT) In Energy Market Estimates and Forecasts, By Deployment Mode (2020-2032) (USD Billion)
11.3.2.7.3 Germany Internet Of Things (IoT) In Energy Market Estimates and Forecasts, By Application (2020-2032) (USD Billion)
11.3.2.7.4 Germany Internet Of Things (IoT) In Energy Market Estimates and Forecasts, By Component (2020-2032) (USD Billion)
11.3.2.8 France
11.3.2.8.1 France Internet Of Things (IoT) In Energy Market Estimates and Forecasts, By Connectivity (2020-2032) (USD Billion)
11.3.2.8.2 France Internet Of Things (IoT) In Energy Market Estimates and Forecasts, By Deployment Mode (2020-2032) (USD Billion)
11.3.2.8.3 France Internet Of Things (IoT) In Energy Market Estimates and Forecasts, By Application (2020-2032) (USD Billion)
11.3.2.8.4 France Internet Of Things (IoT) In Energy Market Estimates and Forecasts, By Component (2020-2032) (USD Billion)
11.3.2.9 UK
11.3.2.9.1 UK Internet Of Things (IoT) In Energy Market Estimates and Forecasts, By Connectivity (2020-2032) (USD Billion)
11.3.2.9.2 UK Internet Of Things (IoT) In Energy Market Estimates and Forecasts, By Deployment Mode (2020-2032) (USD Billion)
11.3.2.9.3 UK Internet Of Things (IoT) In Energy Market Estimates and Forecasts, By Application (2020-2032) (USD Billion)
11.3.2.9.4 UK Internet Of Things (IoT) In Energy Market Estimates and Forecasts, By Component (2020-2032) (USD Billion)
11.3.2.10 Italy
11.3.2.10.1 Italy Internet Of Things (IoT) In Energy Market Estimates and Forecasts, By Connectivity (2020-2032) (USD Billion)
11.3.2.10.2 Italy Internet Of Things (IoT) In Energy Market Estimates and Forecasts, By Deployment Mode (2020-2032) (USD Billion)
11.3.2.10.3 Italy Internet Of Things (IoT) In Energy Market Estimates and Forecasts, By Application (2020-2032) (USD Billion)
11.3.2.10.4 Italy Internet Of Things (IoT) In Energy Market Estimates and Forecasts, By Component (2020-2032) (USD Billion)
11.3.2.11 Spain
11.3.2.11.1 Spain Internet Of Things (IoT) In Energy Market Estimates and Forecasts, By Connectivity (2020-2032) (USD Billion)
11.3.2.11.2 Spain Internet Of Things (IoT) In Energy Market Estimates and Forecasts, By Deployment Mode (2020-2032) (USD Billion)
11.3.2.11.3 Spain Internet Of Things (IoT) In Energy Market Estimates and Forecasts, By Application (2020-2032) (USD Billion)
11.3.2.11.4 Spain Internet Of Things (IoT) In Energy Market Estimates and Forecasts, By Component (2020-2032) (USD Billion)
11.3.2.12 Netherlands
11.3.2.12.1 Netherlands Internet Of Things (IoT) In Energy Market Estimates and Forecasts, By Connectivity (2020-2032) (USD Billion)
11.3.2.12.2 Netherlands Internet Of Things (IoT) In Energy Market Estimates and Forecasts, By Deployment Mode (2020-2032) (USD Billion)
11.3.2.12.3 Netherlands Internet Of Things (IoT) In Energy Market Estimates and Forecasts, By Application (2020-2032) (USD Billion)
11.3.2.12.4 Netherlands Internet Of Things (IoT) In Energy Market Estimates and Forecasts, By Component (2020-2032) (USD Billion)
11.3.2.13 Switzerland
11.3.2.13.1 Switzerland Internet Of Things (IoT) In Energy Market Estimates and Forecasts, By Connectivity (2020-2032) (USD Billion)
11.3.2.13.2 Switzerland Internet Of Things (IoT) In Energy Market Estimates and Forecasts, By Deployment Mode (2020-2032) (USD Billion)
11.3.2.13.3 Switzerland Internet Of Things (IoT) In Energy Market Estimates and Forecasts, By Application (2020-2032) (USD Billion)
11.3.2.13.4 Switzerland Internet Of Things (IoT) In Energy Market Estimates and Forecasts, By Component (2020-2032) (USD Billion)
11.3.2.14 Austria
11.3.2.14.1 Austria Internet Of Things (IoT) In Energy Market Estimates and Forecasts, By Connectivity (2020-2032) (USD Billion)
11.3.2.14.2 Austria Internet Of Things (IoT) In Energy Market Estimates and Forecasts, By Deployment Mode (2020-2032) (USD Billion)
11.3.2.14.3 Austria Internet Of Things (IoT) In Energy Market Estimates and Forecasts, By Application (2020-2032) (USD Billion)
11.3.2.14.4 Austria Internet Of Things (IoT) In Energy Market Estimates and Forecasts, By Component (2020-2032) (USD Billion)
11.3.2.15 Rest of Western Europe
11.3.2.15.1 Rest of Western Europe Internet Of Things (IoT) In Energy Market Estimates and Forecasts, By Connectivity (2020-2032) (USD Billion)
11.3.2.15.2 Rest of Western Europe Internet Of Things (IoT) In Energy Market Estimates and Forecasts, By Deployment Mode (2020-2032) (USD Billion)
11.3.2.15.3 Rest of Western Europe Internet Of Things (IoT) In Energy Market Estimates and Forecasts, By Application (2020-2032) (USD Billion)
11.3.2.15.4 Rest of Western Europe Internet Of Things (IoT) In Energy Market Estimates and Forecasts, By Component (2020-2032) (USD Billion)
11.4 Asia Pacific
11.4.1 Trends Analysis
11.4.2 Asia Pacific Internet Of Things (IoT) In Energy Market Estimates and Forecasts, by Country (2020-2032) (USD Billion)
11.4.3 Asia Pacific Internet Of Things (IoT) In Energy Market Estimates and Forecasts, By Connectivity (2020-2032) (USD Billion)
11.4.4 Asia Pacific Internet Of Things (IoT) In Energy Market Estimates and Forecasts, By Deployment Mode (2020-2032) (USD Billion)
11.4.5 Asia Pacific Internet Of Things (IoT) In Energy Market Estimates and Forecasts, By Application (2020-2032) (USD Billion)
11.4.6 Asia Pacific Internet Of Things (IoT) In Energy Market Estimates and Forecasts, By Component (2020-2032) (USD Billion)
11.4.7 China
11.4.7.1 China Internet Of Things (IoT) In Energy Market Estimates and Forecasts, By Connectivity (2020-2032) (USD Billion)
11.4.7.2 China Internet Of Things (IoT) In Energy Market Estimates and Forecasts, By Deployment Mode (2020-2032) (USD Billion)
11.4.7.3 China Internet Of Things (IoT) In Energy Market Estimates and Forecasts, By Application (2020-2032) (USD Billion)
11.4.7.4 China Internet Of Things (IoT) In Energy Market Estimates and Forecasts, By Component (2020-2032) (USD Billion)
11.4.8 India
11.4.8.1 India Internet Of Things (IoT) In Energy Market Estimates and Forecasts, By Connectivity (2020-2032) (USD Billion)
11.4.8.2 India Internet Of Things (IoT) In Energy Market Estimates and Forecasts, By Deployment Mode (2020-2032) (USD Billion)
11.4.8.3 India Internet Of Things (IoT) In Energy Market Estimates and Forecasts, By Application (2020-2032) (USD Billion)
11.4.8.4 India Internet Of Things (IoT) In Energy Market Estimates and Forecasts, By Component (2020-2032) (USD Billion)
11.4.9 Japan
11.4.9.1 Japan Internet Of Things (IoT) In Energy Market Estimates and Forecasts, By Connectivity (2020-2032) (USD Billion)
11.4.9.2 Japan Internet Of Things (IoT) In Energy Market Estimates and Forecasts, By Deployment Mode (2020-2032) (USD Billion)
11.4.9.3 Japan Internet Of Things (IoT) In Energy Market Estimates and Forecasts, By Application (2020-2032) (USD Billion)
11.4.9.4 Japan Internet Of Things (IoT) In Energy Market Estimates and Forecasts, By Component (2020-2032) (USD Billion)
11.4.10 South Korea
11.4.10.1 South Korea Internet Of Things (IoT) In Energy Market Estimates and Forecasts, By Connectivity (2020-2032) (USD Billion)
11.4.10.2 South Korea Internet Of Things (IoT) In Energy Market Estimates and Forecasts, By Deployment Mode (2020-2032) (USD Billion)
11.4.10.3 South Korea Internet Of Things (IoT) In Energy Market Estimates and Forecasts, By Application (2020-2032) (USD Billion)
11.4.10.4 South Korea Internet Of Things (IoT) In Energy Market Estimates and Forecasts, By Component (2020-2032) (USD Billion)
11.4.11 Vietnam
11.4.11.1 Vietnam Internet Of Things (IoT) In Energy Market Estimates and Forecasts, By Connectivity (2020-2032) (USD Billion)
11.4.11.2 Vietnam Internet Of Things (IoT) In Energy Market Estimates and Forecasts, By Deployment Mode (2020-2032) (USD Billion)
11.4.11.3 Vietnam Internet Of Things (IoT) In Energy Market Estimates and Forecasts, By Application (2020-2032) (USD Billion)
11.4.11.4 Vietnam Internet Of Things (IoT) In Energy Market Estimates and Forecasts, By Component (2020-2032) (USD Billion)
11.4.12 Singapore
11.4.12.1 Singapore Internet Of Things (IoT) In Energy Market Estimates and Forecasts, By Connectivity (2020-2032) (USD Billion)
11.4.12.2 Singapore Internet Of Things (IoT) In Energy Market Estimates and Forecasts, By Deployment Mode (2020-2032) (USD Billion)
11.4.12.3 Singapore Internet Of Things (IoT) In Energy Market Estimates and Forecasts, By Application (2020-2032) (USD Billion)
11.4.12.4 Singapore Internet Of Things (IoT) In Energy Market Estimates and Forecasts, By Component (2020-2032) (USD Billion)
11.4.13 Australia
11.4.13.1 Australia Internet Of Things (IoT) In Energy Market Estimates and Forecasts, By Connectivity (2020-2032) (USD Billion)
11.4.13.2 Australia Internet Of Things (IoT) In Energy Market Estimates and Forecasts, By Deployment Mode (2020-2032) (USD Billion)
11.4.13.3 Australia Internet Of Things (IoT) In Energy Market Estimates and Forecasts, By Application (2020-2032) (USD Billion)
11.4.13.4 Australia Internet Of Things (IoT) In Energy Market Estimates and Forecasts, By Component (2020-2032) (USD Billion)
11.4.14 Rest of Asia Pacific
11.4.14.1 Rest of Asia Pacific Internet Of Things (IoT) In Energy Market Estimates and Forecasts, By Connectivity (2020-2032) (USD Billion)
11.4.14.2 Rest of Asia Pacific Internet Of Things (IoT) In Energy Market Estimates and Forecasts, By Deployment Mode (2020-2032) (USD Billion)
11.4.14.3 Rest of Asia Pacific Internet Of Things (IoT) In Energy Market Estimates and Forecasts, By Application (2020-2032) (USD Billion)
11.4.14.4 Rest of Asia Pacific Internet Of Things (IoT) In Energy Market Estimates and Forecasts, By Component (2020-2032) (USD Billion)
11.5 Middle East and Africa
11.5.1 Middle East
11.5.1.1 Trends Analysis
11.5.1.2 Middle East Internet Of Things (IoT) In Energy Market Estimates and Forecasts, by Country (2020-2032) (USD Billion)
11.5.1.3 Middle East Internet Of Things (IoT) In Energy Market Estimates and Forecasts, By Connectivity (2020-2032) (USD Billion)
11.5.1.4 Middle East Internet Of Things (IoT) In Energy Market Estimates and Forecasts, By Deployment Mode (2020-2032) (USD Billion)
11.5.1.5 Middle East Internet Of Things (IoT) In Energy Market Estimates and Forecasts, By Application (2020-2032) (USD Billion)
11.5.1.6 Middle East Internet Of Things (IoT) In Energy Market Estimates and Forecasts, By Component (2020-2032) (USD Billion)
11.5.1.7 UAE
11.5.1.7.1 UAE Internet Of Things (IoT) In Energy Market Estimates and Forecasts, By Connectivity (2020-2032) (USD Billion)
11.5.1.7.2 UAE Internet Of Things (IoT) In Energy Market Estimates and Forecasts, By Deployment Mode (2020-2032) (USD Billion)
11.5.1.7.3 UAE Internet Of Things (IoT) In Energy Market Estimates and Forecasts, By Application (2020-2032) (USD Billion)
11.5.1.7.4 UAE Internet Of Things (IoT) In Energy Market Estimates and Forecasts, By Component (2020-2032) (USD Billion)
11.5.1.8 Egypt
11.5.1.8.1 Egypt Internet Of Things (IoT) In Energy Market Estimates and Forecasts, By Connectivity (2020-2032) (USD Billion)
11.5.1.8.2 Egypt Internet Of Things (IoT) In Energy Market Estimates and Forecasts, By Deployment Mode (2020-2032) (USD Billion)
11.5.1.8.3 Egypt Internet Of Things (IoT) In Energy Market Estimates and Forecasts, By Application (2020-2032) (USD Billion)
11.5.1.8.4 Egypt Internet Of Things (IoT) In Energy Market Estimates and Forecasts, By Component (2020-2032) (USD Billion)
11.5.1.9 Saudi Arabia
11.5.1.9.1 Saudi Arabia Internet Of Things (IoT) In Energy Market Estimates and Forecasts, By Connectivity (2020-2032) (USD Billion)
11.5.1.9.2 Saudi Arabia Internet Of Things (IoT) In Energy Market Estimates and Forecasts, By Deployment Mode (2020-2032) (USD Billion)
11.5.1.9.3 Saudi Arabia Internet Of Things (IoT) In Energy Market Estimates and Forecasts, By Application (2020-2032) (USD Billion)
11.5.1.9.4 Saudi Arabia Internet Of Things (IoT) In Energy Market Estimates and Forecasts, By Component (2020-2032) (USD Billion)
11.5.1.10 Qatar
11.5.1.10.1 Qatar Internet Of Things (IoT) In Energy Market Estimates and Forecasts, By Connectivity (2020-2032) (USD Billion)
11.5.1.10.2 Qatar Internet Of Things (IoT) In Energy Market Estimates and Forecasts, By Deployment Mode (2020-2032) (USD Billion)
11.5.1.10.3 Qatar Internet Of Things (IoT) In Energy Market Estimates and Forecasts, By Application (2020-2032) (USD Billion)
11.5.1.10.4 Qatar Internet Of Things (IoT) In Energy Market Estimates and Forecasts, By Component (2020-2032) (USD Billion)
11.5.1.11 Rest of Middle East
11.5.1.11.1 Rest of Middle East Internet Of Things (IoT) In Energy Market Estimates and Forecasts, By Connectivity (2020-2032) (USD Billion)
11.5.1.11.2 Rest of Middle East Internet Of Things (IoT) In Energy Market Estimates and Forecasts, By Deployment Mode (2020-2032) (USD Billion)
11.5.1.11.3 Rest of Middle East Internet Of Things (IoT) In Energy Market Estimates and Forecasts, By Application (2020-2032) (USD Billion)
11.5.1.11.4 Rest of Middle East Internet Of Things (IoT) In Energy Market Estimates and Forecasts, By Component (2020-2032) (USD Billion)
11.5.2 Africa
11.5.2.1 Trends Analysis
11.5.2.2 Africa Internet Of Things (IoT) In Energy Market Estimates and Forecasts, by Country (2020-2032) (USD Billion)
11.5.2.3 Africa Internet Of Things (IoT) In Energy Market Estimates and Forecasts, By Connectivity (2020-2032) (USD Billion)
11.5.2.4 Africa Internet Of Things (IoT) In Energy Market Estimates and Forecasts, By Deployment Mode (2020-2032) (USD Billion)
11.5.2.5 Africa Internet Of Things (IoT) In Energy Market Estimates and Forecasts, By Application (2020-2032) (USD Billion)
11.5.2.6 Africa Internet Of Things (IoT) In Energy Market Estimates and Forecasts, By Component (2020-2032) (USD Billion)
11.5.2.7 South Africa
11.5.2.7.1 South Africa Internet Of Things (IoT) In Energy Market Estimates and Forecasts, By Connectivity (2020-2032) (USD Billion)
11.5.2.7.2 South Africa Internet Of Things (IoT) In Energy Market Estimates and Forecasts, By Deployment Mode (2020-2032) (USD Billion)
11.5.2.7.3 South Africa Internet Of Things (IoT) In Energy Market Estimates and Forecasts, By Application (2020-2032) (USD Billion)
11.5.2.7.4 South Africa Internet Of Things (IoT) In Energy Market Estimates and Forecasts, By Component (2020-2032) (USD Billion)
11.5.2.8 Nigeria
11.5.2.8.1 Nigeria Internet Of Things (IoT) In Energy Market Estimates and Forecasts, By Connectivity (2020-2032) (USD Billion)
11.5.2.8.2 Nigeria Internet Of Things (IoT) In Energy Market Estimates and Forecasts, By Deployment Mode (2020-2032) (USD Billion)
11.5.2.8.3 Nigeria Internet Of Things (IoT) In Energy Market Estimates and Forecasts, By Application (2020-2032) (USD Billion)
11.5.2.8.4 Nigeria Internet Of Things (IoT) In Energy Market Estimates and Forecasts, By Component (2020-2032) (USD Billion)
11.5.2.9 Rest of Africa
11.5.2.9.1 Rest of Africa Internet Of Things (IoT) In Energy Market Estimates and Forecasts, By Connectivity (2020-2032) (USD Billion)
11.5.2.9.2 Rest of Africa Internet Of Things (IoT) In Energy Market Estimates and Forecasts, By Deployment Mode (2020-2032) (USD Billion)
11.5.2.9.3 Rest of Africa Internet Of Things (IoT) In Energy Market Estimates and Forecasts, By Application (2020-2032) (USD Billion)
11.5.2.9.4 Rest of Africa Internet Of Things (IoT) In Energy Market Estimates and Forecasts, By Component (2020-2032) (USD Billion)
11.6 Latin America
11.6.1 Trends Analysis
11.6.2 Latin America Internet Of Things (IoT) In Energy Market Estimates and Forecasts, by Country (2020-2032) (USD Billion)
11.6.3 Latin America Internet Of Things (IoT) In Energy Market Estimates and Forecasts, By Connectivity (2020-2032) (USD Billion)
11.6.4 Latin America Internet Of Things (IoT) In Energy Market Estimates and Forecasts, By Deployment Mode (2020-2032) (USD Billion)
11.6.5 Latin America Internet Of Things (IoT) In Energy Market Estimates and Forecasts, By Application (2020-2032) (USD Billion)
11.6.6 Latin America Internet Of Things (IoT) In Energy Market Estimates and Forecasts, By Component (2020-2032) (USD Billion)
11.6.7 Brazil
11.6.7.1 Brazil Internet Of Things (IoT) In Energy Market Estimates and Forecasts, By Connectivity (2020-2032) (USD Billion)
11.6.7.2 Brazil Internet Of Things (IoT) In Energy Market Estimates and Forecasts, By Deployment Mode (2020-2032) (USD Billion)
11.6.7.3 Brazil Internet Of Things (IoT) In Energy Market Estimates and Forecasts, By Application (2020-2032) (USD Billion)
11.6.7.4 Brazil Internet Of Things (IoT) In Energy Market Estimates and Forecasts, By Component (2020-2032) (USD Billion)
11.6.8 Argentina
11.6.8.1 Argentina Internet Of Things (IoT) In Energy Market Estimates and Forecasts, By Connectivity (2020-2032) (USD Billion)
11.6.8.2 Argentina Internet Of Things (IoT) In Energy Market Estimates and Forecasts, By Deployment Mode (2020-2032) (USD Billion)
11.6.8.3 Argentina Internet Of Things (IoT) In Energy Market Estimates and Forecasts, By Application (2020-2032) (USD Billion)
11.6.8.4 Argentina Internet Of Things (IoT) In Energy Market Estimates and Forecasts, By Component (2020-2032) (USD Billion)
11.6.9 Colombia
11.6.9.1 Colombia Internet Of Things (IoT) In Energy Market Estimates and Forecasts, By Connectivity (2020-2032) (USD Billion)
11.6.9.2 Colombia Internet Of Things (IoT) In Energy Market Estimates and Forecasts, By Deployment Mode (2020-2032) (USD Billion)
11.6.9.3 Colombia Internet Of Things (IoT) In Energy Market Estimates and Forecasts, By Application (2020-2032) (USD Billion)
11.6.9.4 Colombia Internet Of Things (IoT) In Energy Market Estimates and Forecasts, By Component (2020-2032) (USD Billion)
11.6.10 Rest of Latin America
11.6.10.1 Rest of Latin America Internet Of Things (IoT) In Energy Market Estimates and Forecasts, By Connectivity (2020-2032) (USD Billion)
11.6.10.2 Rest of Latin America Internet Of Things (IoT) In Energy Market Estimates and Forecasts, By Deployment Mode (2020-2032) (USD Billion)
11.6.10.3 Rest of Latin America Internet Of Things (IoT) In Energy Market Estimates and Forecasts, By Application (2020-2032) (USD Billion)
11.6.10.4 Rest of Latin America Internet Of Things (IoT) In Energy Market Estimates and Forecasts, By Component (2020-2032) (USD Billion)
12. Company Profiles
12.1 GridPoint, Inc.
12.1.1 Company Overview
12.1.2 Financial
12.1.3 Products/ Services Offered
12.1.4 SWOT Analysis
12.2 Aeris Communications, Inc.
12.2.1 Company Overview
12.2.2 Financial
12.2.3 Products/ Services Offered
12.2.4 SWOT Analysis
12.3 IBM Corporation
12.3.1 Company Overview
12.3.2 Financial
12.3.3 Products/ Services Offered
12.3.4 SWOT Analysis
12.4 Siemens AG
12.4.1 Company Overview
12.4.2 Financial
12.4.3 Products/ Services Offered
12.4.4 SWOT Analysis
12.5 Johnson Controls International PLC
12.5.1 Company Overview
12.5.2 Financial
12.5.3 Products/ Services Offered
12.5.4 SWOT Analysis
12.6 AGT International SpA
12.6.1 Company Overview
12.6.2 Financial
12.6.3 Products/ Services Offered
12.6.4 SWOT Analysis
12.7 Cisco Systems, Inc.
12.7.1 Company Overview
12.7.2 Financial
12.7.3 Products/ Services Offered
12.7.4 SWOT Analysis
12.8 Davra Networks Limited
12.8.1 Company Overview
12.8.2 Financial
12.8.3 Products/ Services Offered
12.8.4 SWOT Analysis
12.9 Intel Corporation
12.9.1 Company Overview
12.9.2 Financial
12.9.3 Products/ Services Offered
12.9.4 SWOT Analysis
12.10 SAP SE
12.10.1 Company Overview
12.10.2 Financial
12.10.3 Products/ Services Offered
12.10.4 SWOT Analysis
13. Use Cases and Best Practices
14. Conclusion
An accurate research report requires proper strategizing as well as implementation. There are multiple factors involved in the completion of good and accurate research report and selecting the best methodology to compete the research is the toughest part. Since the research reports we provide play a crucial role in any company’s decision-making process, therefore we at SNS Insider always believe that we should choose the best method which gives us results closer to reality. This allows us to reach at a stage wherein we can provide our clients best and accurate investment to output ratio.
Each report that we prepare takes a timeframe of 350-400 business hours for production. Starting from the selection of titles through a couple of in-depth brain storming session to the final QC process before uploading our titles on our website we dedicate around 350 working hours. The titles are selected based on their current market cap and the foreseen CAGR and growth.
The 5 steps process:
Step 1: Secondary Research:
Secondary Research or Desk Research is as the name suggests is a research process wherein, we collect data through the readily available information. In this process we use various paid and unpaid databases which our team has access to and gather data through the same. This includes examining of listed companies’ annual reports, Journals, SEC filling etc. Apart from this our team has access to various associations across the globe across different industries. Lastly, we have exchange relationships with various university as well as individual libraries.
Step 2: Primary Research
When we talk about primary research, it is a type of study in which the researchers collect relevant data samples directly, rather than relying on previously collected data. This type of research is focused on gaining content specific facts that can be sued to solve specific problems. Since the collected data is fresh and first hand therefore it makes the study more accurate and genuine.
We at SNS Insider have divided Primary Research into 2 parts.
Part 1 wherein we interview the KOLs of major players as well as the upcoming ones across various geographic regions. This allows us to have their view over the market scenario and acts as an important tool to come closer to the accurate market numbers. As many as 45 paid and unpaid primary interviews are taken from both the demand and supply side of the industry to make sure we land at an accurate judgement and analysis of the market.
This step involves the triangulation of data wherein our team analyses the interview transcripts, online survey responses and observation of on filed participants. The below mentioned chart should give a better understanding of the part 1 of the primary interview.
Part 2: In this part of primary research the data collected via secondary research and the part 1 of the primary research is validated with the interviews from individual consultants and subject matter experts.
Consultants are those set of people who have at least 12 years of experience and expertise within the industry whereas Subject Matter Experts are those with at least 15 years of experience behind their back within the same space. The data with the help of two main processes i.e., FGDs (Focused Group Discussions) and IDs (Individual Discussions). This gives us a 3rd party nonbiased primary view of the market scenario making it a more dependable one while collation of the data pointers.
Step 3: Data Bank Validation
Once all the information is collected via primary and secondary sources, we run that information for data validation. At our intelligence centre our research heads track a lot of information related to the market which includes the quarterly reports, the daily stock prices, and other relevant information. Our data bank server gets updated every fortnight and that is how the information which we collected using our primary and secondary information is revalidated in real time.
Step 4: QA/QC Process
After all the data collection and validation our team does a final level of quality check and quality assurance to get rid of any unwanted or undesired mistakes. This might include but not limited to getting rid of the any typos, duplication of numbers or missing of any important information. The people involved in this process include technical content writers, research heads and graphics people. Once this process is completed the title gets uploader on our platform for our clients to read it.
Step 5: Final QC/QA Process:
This is the last process and comes when the client has ordered the study. In this process a final QA/QC is done before the study is emailed to the client. Since we believe in giving our clients a good experience of our research studies, therefore, to make sure that we do not lack at our end in any way humanly possible we do a final round of quality check and then dispatch the study to the client.
Key Segments:
By Component
Solution
Asset Management
Energy Management
Safety Solution
Connected Logistics
Compliance & Risk Management
Data Management & Analytics
Others
Services
Professional Services
Managed Services
By Application
Oil & Gas
Coal Mine
Smart Grid
By Deployment Mode
On-premise
Cloud
By Connectivity
Zigbee
Wi-Fi
Bluetooth
Z-Wave
Others
Request for Segment Customization as per your Business Requirement: Segment Customization Request
Regional Coverage:
North America
US
Canada
Mexico
Europe
Eastern Europe
Poland
Romania
Hungary
Turkey
Rest of Eastern Europe
Western Europe
Germany
France
UK
Italy
Spain
Netherlands
Switzerland
Austria
Rest of Western Europe
Asia Pacific
China
India
Japan
South Korea
Vietnam
Singapore
Australia
Rest of Asia Pacific
Middle East & Africa
Middle East
UAE
Egypt
Saudi Arabia
Qatar
Rest of Middle East
Africa
Nigeria
South Africa
Rest of Africa
Latin America
Brazil
Argentina
Colombia
Rest of Latin America
Request for Country Level Research Report: Country Level Customization Request
Available Customization
With the given market data, SNS Insider offers customization as per the company’s specific needs. The following customization options are available for the report:
Detailed Volume Analysis
Criss-Cross segment analysis (e.g. Product X Application)
Competitive Product Benchmarking
Geographic Analysis
Additional countries in any of the regions
Customized Data Representation
Detailed analysis and profiling of additional market players
Private 5G Network Market was valued at USD 2.03 billion in 2023 and is expected to reach USD 61.1 billion by 2032, growing at a CAGR of 46.0% over 2024-2032.
The Cloud Advertising Market Size was USD 4.20 billion in 2023 and is expected to reach USD 19.88 Bn by 2032 with a growing CAGR of 18.85% by 2024-2032.
The Shipping Software Market was valued at USD 13.01 billion in 2023 and will reach USD 28.07 Billion by 2032, growing at a CAGR of 8.94% by 2032.
The Reconciliation Software Market size was USD 1.72 Billion in 2023 and is expected to grow to USD 6.49 Bn by 2032 and grow at a CAGR of 15.9% by 2024-2032.
The Green IT Services Market was valued at USD 18.8 Billion in 2023 and is expected to reach USD 69.4 Billion by 2032, growing at a CAGR of 15.65% from 2024-2032.
The Infrastructure as Code (IaC) market was valued at USD 917.3 million in 2023 and is expected to reach USD 5869.3 million by 2032, growing at a CAGR of 22.92% from 2024-2032.
Hi! Click one of our member below to chat on Phone