Interactive Tables Market Size:
Get More Information on Interactive Tables Market - Request Sample Report
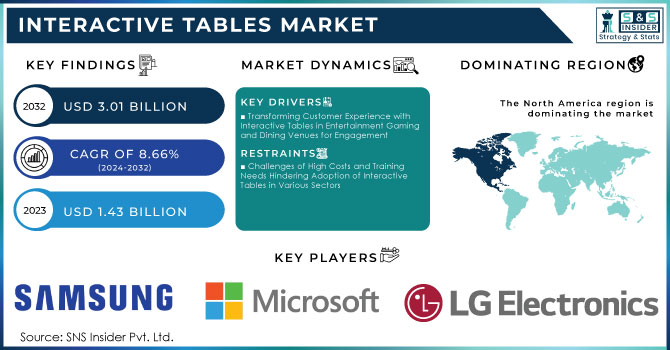
The Interactive Tables Market was valued at USD 1.43 Billion in 2023 and is expected to reach USD 3.01 Billion by 2032 and grow at a CAGR of 8.66% over the forecast period 2024-2032.
The interactive tables market is growing due to increasing interest in learning digital solutions within educational institutions. Other companies and organizations operating in all industries, including retail, hospitality, and transportation, among many others, are using interactive tables to enhance customer experience and streamline their operations. For example, in the retail industry, an interactive table can be used as a product demonstration tool and an assistive shopping guide. Interactive table increases consumer interaction by about 60%, a figure that should not be taken lightly. Also, 62% of customers will be forced to make impulse buys if caught by an interactive display. Regarding the elicitation of positive emotional responses and establishing the brand in memory, interactive display is eight times more efficient than static content. In addition, 40% of respondents said the placement of digital signage at the point of sale promotes the purchase. In hospitality, these tables act as digital menus and entertainment devices. There is also the increased demand, which surges through the rising numbers of trade shows and exhibitions where these tables are now widely used for interactive product displays and presentations.
Advances in touchscreen technology have also increased usability and affordability, coupled with better integration of software across sectors, all contributing to wider take-up. Self-service interactive tables enable diners to browse menus, place orders, and pay independently at their own pace. This setup allows restaurants to reallocate staff to more critical tasks, while also boosting revenue. Self-service kiosks can be programmed for automatic upselling, which can lead to sales increases of up to 38%. Additionally, 91% of consumers report that digital menus have influenced their purchasing decisions, highlighting their positive impact on sales. Another trend is towards smart control rooms, especially in environments dealing with security and surveillance, where interactive tables help to manage real-time data and aid better decision-making processes. More generally, growth in the market is through the expansion of digitization into areas of business and the desire for dynamic, interactive solutions.
MARKET DYNAMICS
KEY DRIVERS:
Transforming Customer Experience with Interactive Tables in Entertainment Gaming and Dining Venues for Engagement
The emergence of the Interactive Tables market is the growing emphasis on improving customer experience across a variety of markets, particularly entertainment and gaming. Interactive tables provide unique, immersive experiences that attract consumers by offering interactive games, quizzes, as well other multimedia content. This is an exciting, hands-on experience in the environment with gaming zones, restaurants, and family entertainment centers. About 20% of customers would like to use modern table technology instead of a waiter as it has numerous advantages that give the fullest control over their dining and allow comfortable satisfaction of their every requirement. Moreover, by enabling customers to place orders directly from the table, ordering and settling the bill time decreases sales profitability increase over 10.70%, since customers are naturally in a hurry to place orders and finish their food. Being widely used by entertainment sites trying to carve out some identity for themselves and attract more customers, interactive tables have been used across the board; featuring a broad range of user interface and content that can be customized to appeal to different themes or needs. With businesses now focusing on gaining customer retention through more personalized experiences, the demand for interactive tables is the key tool that will continue increasing engagement levels.
Innovative Touch and Gesture Recognition Technologies Driving Growth in Interactive Tables for Various Applications
The developing technology of touch and gesture recognition has continued to spur growth in the market. Multitouch and gesture-based systems have further advanced the development of interactive tables and made them more intuitive, allowing for more precise manipulation of data, images, and digital content. Advancements in hardware and software have also made them far more reliable and responsive, which enhances the performance of such interactive systems in high-demand environments like corporate meeting rooms, control centers, and industrial applications. Future research and developments on touchless interactions, augmented reality, and haptic feedback technologies should extend the capabilities of interactive tables to new applications and subsequently fuel market demand during the coming years. This is a continuous technology innovation, and thus a prime motivator for businesses in search of an efficient, easy-to-use solution.
RESTRAIN:
Challenges of High Costs and Training Needs Hindering Adoption of Interactive Tables in Various Sectors
The high price of advanced interactive table systems is one of the major limitations in the interactive tables market mainly for small businesses and educational institutions which have less budget. For example, schools may not be ready to afford multiple units needed in various classrooms, thereby limiting the huge adoption rate. An additional regular maintenance cost, cost of software updating, and possible technical faults may also deter organizations from investing in such a system. Another challenge stems from the lack of users' familiarity with the time it takes to train them to work with this type of device. This may be a major problem when sectoral requirements, such as healthcare or industrial control rooms, where interactive tables could help optimize their businesses, create shockingly steep learning curves toward working with this technology. For instance, hospital workers would require extensive training to work efficiently through patient data on an interactive table which is likely to delay adoption considerably in the short term. The benefits of interactive tables are poorly achieved without adequate training. This is because integration into workflow processes might be hindered.
KEY MARKET SEGMENTS
BY TECHNOLOGY
The capacitive segment dominated the market share of 42% in 2023. Its advantage across most industries requires responsiveness and multi-touch capabilities. Capacitive technology, which responds to the touch of human skin or a conductive object, features better sensitivity in touch, accuracy, and a higher response speed than resistive alternatives. This gives it the preference in sectors that have a seamless contact interplay with customers such as education, retail, and hospitality. For example, on interactive educational tables in school environments, capacitive offers a more intuitive and engaging interface for student learning, promoting collaborative learning and multitasking capabilities.
The LED segment will witness the fastest growth in the forecast period 2024-2032 due to its energy efficiency, longevity, and enhanced visual quality. LED displays have images that are more vivid with deeper contrast and are also capable of supporting high-vibrancy dynamic content, making them highly sought after for interactive tables used in retail, exhibitions, and entertainment. Such as, retailers are using LED-based interactive tables to stun and grab customers with high-performance conversion rates of product presentations. Also, the rising industrial focus on sustainability and energy-efficient solutions is well in alignment with the ever-increasing demand for LED technology.
BY SCREEN SIZE
The 32 to 65 inches dominated the market share of 58.6% in 2023 and is expected to show the fastest CAGR during 2024-2032 since it is relevant and suitable for multiple applications across varied industries. These tables are well suited for being large enough to provide some interesting display for group interaction purposes yet small enough to fit comfortably anywhere-from classrooms, corporate boardrooms, retail establishments, or hospitality environments. This means that educational institutions, support collaborative learning without overcrowding the space, and in retail and corporate settings, it effectively promotes the products and presents ideas while blending functionality with aesthetic appeal. For education, the 42-inch SMART Table 442i allows learning to take place for many users as well as for the educational applications offered. In retail, the Samsung Flip at 55 inches provides easier exploration and tailoring of products according to customer preferences. In the corporate setting, the Microsoft Surface Hub 2S at 50 inches allows real-time collaboration among participants as Microsoft has integrated applications available for use in corporate meetings. Hospitality is one application wherein the ELO Touch Solutions 32-inch Interactive Table can be used to let a guest look at menus and may even order from it. On the other point, the Ideum Platform 55 is utilized in museums for visitors to play around with digital content as a way of enriching their stay.
BY APPLICATION
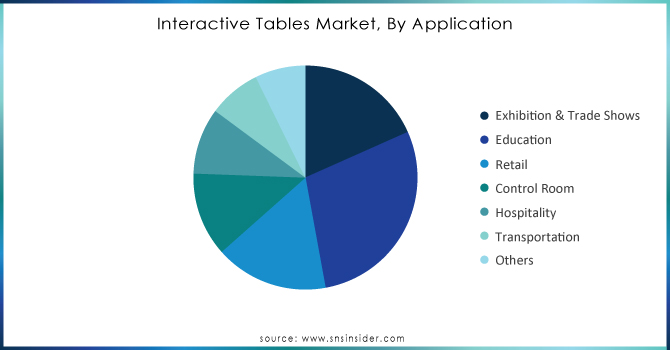
The education segment dominated the market share of 28.7% in 2023, driven by the increasing need to integrate interactive technologies into educational institutions. Interactive tables are now an essential tool in modern classrooms to promote collaborative learning, engagement, and improved interactivity between students and educators. The usage of interactive tables and, in general, digital learning is greatly dependent upon technological advancements, which brought along the shift toward distant or blended learning environments in schools and universities. These tables are useful for performing hands-on activities, interacting with digital content, and group collaborations, presenting an indispensable component in the modern landscape of learning.
The retail segment is likely to expand with the fastest CAGR during 2024-2032. This is primarily because more displays are used to enhance customer experience in interactive displays. Retailers use these interactive tables to develop engaging and interactive shopping experiences such as virtual product demonstrations, personal shopping, and interactive catalogs. As the retail industry welcomes digital transformation, these tables introduce innovative in-store ways to attract and retain customers by providing them with interactivity and dynamic content. The further value to this consumer behavior tracking and preferences ability of the table further propels its value in the retail space, leading to really huge demand and growth in that segment.
Need Any Customization Research On Interactive Tables Market - Inquiry Now
REGIONAL ANALYSIS
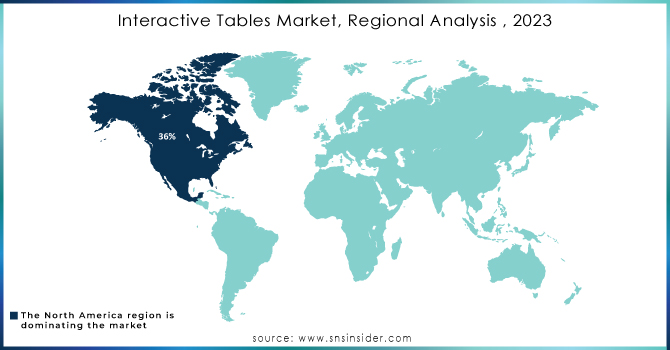
North America dominated the market share of 36% in the year 2023, owing to various factors such as advanced technological infrastructure and high interactive technology adoption levels, with significant investments in education and business sectors. Many educational institutions and corporate entities are present in the region, seeking innovative solutions that can further improve learning processes and enhance operations. For instance, more than 99% of colleges and universities in the United States have installed interactive tables in their classrooms. Interactive tables are also deployed in conference rooms of North American companies for PowerPoint presentations and brainstorming sessions. Both of these have made a great contribution to cornering a major part of the market.
The Asia-Pacific region is going to witness the highest growth rate from 2024-2032. These consist of a multitude of variables that are fast working towards increasing speed. Urbanization is happening at a breakneck pace. Disposable income is on the rise while digitalization ventures are catapulting sectors into advancing, all of which contribute to the rising implementation of educational technology in nations like China and India. Demand for Interactive Tables Skyrockets Schools and colleges are becoming increasingly interested in interactive tables, largely due to a demand for collaborative environments of learning in schools located within the city limits to ensure enhanced participation from students. The retail sector in Asia Pacific is embracing interactive solutions that enhance customer experience. Innovative retailers use digital catalogs and product displays at interactive tables to engage a lot of consumers. It can be expected that as the region continues its investment in the technological and digital aspects, the interactive table will pick up rapidly over the years compared with other markets.
Key players
Some of the major players in the Interactive Tables Market are:
Samsung Electronics (Samsung Flip, Samsung Smart Signage)
LG Electronics (LG Interactive Whiteboard, LG Touch Table)
Microsoft (Surface Hub, Surface Pro)
Sharp Corporation (Sharp Aquos Board, Sharp Touch Screen Table)
Elo Touch Solutions (Elo Touchscreen Table, Elo Interactive Kiosk)
ViewSonic (ViewSonic Interactive Flat Panel, ViewSonic Smart Table)
Zytech (Zytech Interactive Display Table, Zytech Touchscreen Table)
BenQ (BenQ Interactive Flat Panel, BenQ Smart Table)
InFocus Corporation (InFocus Mondopad, InFocus Interactive Table)
SMART Technologies (SMART Table, SMART Board)
Vivo (Vivo Interactive Touch Table, Vivo Smart Table)
Touchsource (Touchsource Interactive Table, Touchsource Touch Screen)
Ideum (Ideum Pro Table, Ideum Touch Table)
Perch (Perch Interactive Table, Perch Smart Display)
Mimio (Mimio Interactive Table, Mimio Teach)
WizKids (WizKids Interactive Table, WizKids Touch Table)
Clever Touch (Clever Touch Interactive Table, Clever Touch Plus)
Avocor (Avocor Interactive Display, Avocor Collaboration Table)
Rugged Tablets (Rugged Touch Table, Rugged Interactive Table)
ViewSonic (ViewSonic Interactive Table, ViewSonic Touch Panel)
Some of the Raw Material Suppliers for Interactive Tables Companies:
3M
Corning
DuPont
Samsung SDI
LG Chem
Nitto Denko
Avery Dennison
Henkel
BASF
Taiwan Semiconductor Manufacturing Company (TSMC)
RECENT TRENDS
In September 2024, Ideum introduced the Tasting Table, a touch-table product bundled with Wine Experience software, designed to create interactive and engaging wine-tasting events for wineries and restaurants.
In September 2024, GruvCard introduced an Interactive Trade Show Booth Sign System that features dynamic digital signage and touch-screen technology, enhancing attendee engagement and facilitating real-time product interaction at trade shows.
In October 2024, AGS unveiled its latest table innovation, Bonus Spin Xtreme for poker rooms, along with an exciting new lineup of slot games at the Oklahoma Indian Gaming Association (OIGA) 2024 conference.
Report Attributes | Details |
---|---|
Market Size in 2023 | USD 1.43 Billion |
Market Size by 2032 | USD 3.01 Billion |
CAGR | CAGR of 8.66 % From 2024 to 2032 |
Base Year | 2023 |
Forecast Period | 2024-2032 |
Historical Data | 2020-2022 |
Report Scope & Coverage | Market Size, Segments Analysis, Competitive Landscape, Regional Analysis, DROC & SWOT Analysis, Forecast Outlook |
Key Segments | • By Technology (LCD, LED, Capacitive, Others) • By Screen Size (32-65 inch, 65 inch & above) • By Application (Exhibition & Trade Shows, Education, Retail, Control Room, Hospitality, Transportation, Others) |
Regional Analysis/Coverage | North America (US, Canada, Mexico), Europe (Eastern Europe [Poland, Romania, Hungary, Turkey, Rest of Eastern Europe] Western Europe] Germany, France, UK, Italy, Spain, Netherlands, Switzerland, Austria, Rest of Western Europe]), Asia Pacific (China, India, Japan, South Korea, Vietnam, Singapore, Australia, Rest of Asia Pacific), Middle East & Africa (Middle East [UAE, Egypt, Saudi Arabia, Qatar, Rest of Middle East], Africa [Nigeria, South Africa, Rest of Africa], Latin America (Brazil, Argentina, Colombia, Rest of Latin America) |
Company Profiles | Samsung Electronics, LG Electronics, Microsoft, Sharp Corporation, Elo Touch Solutions, ViewSonic, Zytech, BenQ, InFocus Corporation, SMART Technologies, Vivo, Touchsource, Ideum, Perch, Mimio, WizKids, Clever Touch, Avocor, Rugged Tablets |
Key Drivers | • Transforming Customer Experience with Interactive Tables in Entertainment Gaming and Dining Venues for Engagement • Innovative Touch and Gesture Recognition Technologies Driving Growth in Interactive Tables for Various Applications |
Restraints | • Challenges of High Costs and Training Needs Hindering Adoption of Interactive Tables in Various Sectors |
Ans: The Interactive Tables Market is expected to grow at a CAGR of 8.66% during 2024-2032.
Ans: Interactive Tables Market size was USD 1.43 billion in 2023 and is expected to Reach USD 3.01 billion by 2032.
Ans: The major growth factor of the Interactive Tables Market is the increasing demand for engaging and collaborative learning environments in educational institutions and interactive customer experiences in retail settings.
Ans: The Education segment dominated the Interactive Tables Market in 2023.
Ans: NORTH AMERICA dominated the Interactive Tables Market in 2023.
Table of Content
1. Introduction
1.1 Market Definition
1.2 Scope (Inclusion and Exclusions)
1.3 Research Assumptions
2. Executive Summary
2.1 Market Overview
2.2 Regional Synopsis
2.3 Competitive Summary
3. Research Methodology
3.1 Top-Down Approach
3.2 Bottom-up Approach
3.3. Data Validation
3.4 Primary Interviews
4. Market Dynamics Impact Analysis
4.1 Market Driving Factors Analysis
4.1.1 Drivers
4.1.2 Restraints
4.1.3 Opportunities
4.1.4 Challenges
4.2 PESTLE Analysis
4.3 Porter’s Five Forces Model
5. Statistical Insights and Trends Reporting
5.1 Interactive Tables Technology Adoption Rates, by Region, (2020-2023)
5.2 Interactive Tables Consumer Engagement Metrics, by Region, (2020-2023)
5.3 Interactive Tables Product Features Analysis
5.4 Interactive Tables Event Participation Rates
6. Competitive Landscape
6.1 List of Major Companies, By Region
6.2 Market Share Analysis, By Region
6.3 Product Benchmarking
6.3.1 Product specifications and features
6.3.2 Pricing
6.4 Strategic Initiatives
6.4.1 Marketing and promotional activities
6.4.2 Distribution and Supply Chain Strategies
6.4.3 Expansion plans and new product launches
6.4.4 Strategic partnerships and collaborations
6.5 Technological Advancements
6.6 Market Positioning and Branding
7. Interactive Tables Market Segmentation, By Technology
7.1 Chapter Overview
7.2 LCD
7.2.1 LCD Market Trends Analysis (2020-2032)
7.2.2 LCD Market Size Estimates and Forecasts to 2032 (USD Million)
7.3 LED
7.3.1 LED Market Trends Analysis (2020-2032)
7.3.2 LED Market Size Estimates and Forecasts to 2032 (USD Million)
7.4 Capacitive
7.4.1 Capacitive Market Trends Analysis (2020-2032)
7.4.2 Capacitive Market Size Estimates and Forecasts to 2032 (USD Million)
7.5 Others
7.5.1 Others Market Trends Analysis (2020-2032)
7.5.2 Others Market Size Estimates and Forecasts to 2032 (USD Million)
8. Interactive Tables Market Segmentation, By Screen Size
8.1 Chapter Overview
8.2 32-65 inch
8.2.1 32–65-inch Market Trends Analysis (2020-2032)
8.2.2 32–65-inch Market Size Estimates and Forecasts to 2032 (USD Billion)
8.3 65 inches & above
8.3.1 65 inches & above Market Trends Analysis (2020-2032)
8.3.2 65 inches & above Market Size Estimates and Forecasts to 2032 (USD Billion)
9. Interactive Tables Market Segmentation, By Application
9.1 Chapter Overview
9.2 Exhibition & Trade Shows
9.2.1 Exhibition & Trade Shows Market Trends Analysis (2020-2032)
9.2.2 Exhibition & Trade Shows Market Size Estimates and Forecasts to 2032 (USD Billion)
9.3 Education
9.3.1 Education Market Trends Analysis (2020-2032)
9.3.2 Education Market Size Estimates and Forecasts to 2032 (USD Billion)
9.4 Retail
9.4.1 Retail Market Trends Analysis (2020-2032)
9.4.2 Retail Market Size Estimates and Forecasts to 2032 (USD Billion)
9.5 Control Room
9.5.1 Control Room Market Trends Analysis (2020-2032)
9.5.2 Control Room Market Size Estimates and Forecasts to 2032 (USD Billion)
9.6 Hospitality
9.6.1 Hospitality Market Trends Analysis (2020-2032)
9.6.2 Hospitality Market Size Estimates and Forecasts to 2032 (USD Billion)
9.7 Transportation
9.7.1 Transportation Market Trends Analysis (2020-2032)
9.7.2 Transportation Market Size Estimates and Forecasts to 2032 (USD Billion)
9.8 Others
9.8.1 Others Market Trends Analysis (2020-2032)
9.8.2 Others Market Size Estimates and Forecasts to 2032 (USD Billion)
10. Regional Analysis
10.1 Chapter Overview
10.2 North America
10.2.1 Trends Analysis
10.2.2 North America Interactive Tables Market Estimates and Forecasts, by Country (2020-2032) (USD Billion)
10.2.3 North America Interactive Tables Market Estimates and Forecasts, By Technology (2020-2032) (USD Billion)
10.2.4 North America Interactive Tables Market Estimates and Forecasts, By Screen Size (2020-2032) (USD Billion)
10.2.5 North America Interactive Tables Market Estimates and Forecasts, By Application (2020-2032) (USD Billion)
10.2.6 USA
10.2.6.1 USA Interactive Tables Market Estimates and Forecasts, By Technology (2020-2032) (USD Billion)
10.2.6.2 USA Interactive Tables Market Estimates and Forecasts, By Screen Size (2020-2032) (USD Billion)
10.2.6.3 USA Interactive Tables Market Estimates and Forecasts, By Application (2020-2032) (USD Billion)
10.2.7 Canada
10.2.7.1 Canada Interactive Tables Market Estimates and Forecasts, By Technology (2020-2032) (USD Billion)
10.2.7.2 Canada Interactive Tables Market Estimates and Forecasts, By Screen Size (2020-2032) (USD Billion)
10.2.7.3 Canada Interactive Tables Market Estimates and Forecasts, By Application (2020-2032) (USD Billion)
10.2.8 Mexico
10.2.8.1 Mexico Interactive Tables Market Estimates and Forecasts, By Technology (2020-2032) (USD Billion)
10.2.8.2 Mexico Interactive Tables Market Estimates and Forecasts, By Screen Size (2020-2032) (USD Billion)
10.2.8.3 Mexico Interactive Tables Market Estimates and Forecasts, By Application (2020-2032) (USD Billion)
10.3 Europe
10.3.1 Eastern Europe
10.3.1.1 Trends Analysis
10.3.1.2 Eastern Europe Interactive Tables Market Estimates and Forecasts, by Country (2020-2032) (USD Billion)
10.3.1.3 Eastern Europe Interactive Tables Market Estimates and Forecasts, By Technology (2020-2032) (USD Billion)
10.3.1.4 Eastern Europe Interactive Tables Market Estimates And Forecasts, By Screen Size (2020-2032) (USD Billion)
10.3.1.5 Eastern Europe Interactive Tables Market Estimates And Forecasts, By Application (2020-2032) (USD Billion)
10.3.1.6 Poland
10.3.1.6.1 Poland Interactive Tables Market Estimates And Forecasts, By Technology (2020-2032) (USD Billion)
10.3.1.6.2 Poland Interactive Tables Market Estimates And Forecasts, By Screen Size (2020-2032) (USD Billion)
10.3.1.6.3 Poland Interactive Tables Market Estimates And Forecasts, By Application (2020-2032) (USD Billion)
10.3.1.7 Romania
10.3.1.7.1 Romania Interactive Tables Market Estimates And Forecasts, By Technology (2020-2032) (USD Billion)
10.3.1.7.2 Romania Interactive Tables Market Estimates And Forecasts, By Screen Size (2020-2032) (USD Billion)
10.3.1.7.3 Romania Interactive Tables Market Estimates And Forecasts, By Application (2020-2032) (USD Billion)
10.3.1.8 Hungary
10.3.1.8.1 Hungary Interactive Tables Market Estimates And Forecasts, By Technology (2020-2032) (USD Billion)
10.3.1.8.2 Hungary Interactive Tables Market Estimates And Forecasts, By Screen Size (2020-2032) (USD Billion)
10.3.1.8.3 Hungary Interactive Tables Market Estimates And Forecasts, By Application (2020-2032) (USD Billion)
10.3.1.9 Turkey
10.3.1.9.1 Turkey Interactive Tables Market Estimates And Forecasts, By Technology (2020-2032) (USD Billion)
10.3.1.9.2 Turkey Interactive Tables Market Estimates And Forecasts, By Screen Size (2020-2032) (USD Billion)
10.3.1.9.3 Turkey Interactive Tables Market Estimates And Forecasts, By Application (2020-2032) (USD Billion)
10.3.1.10 Rest Of Eastern Europe
10.3.1.10.1 Rest Of Eastern Europe Interactive Tables Market Estimates And Forecasts, By Technology (2020-2032) (USD Billion)
10.3.1.10.2 Rest Of Eastern Europe Interactive Tables Market Estimates And Forecasts, By Screen Size (2020-2032) (USD Billion)
10.3.1.10.3 Rest Of Eastern Europe Interactive Tables Market Estimates And Forecasts, By Application (2020-2032) (USD Billion)
10.3.2 Western Europe
10.3.2.1 Trends Analysis
10.3.2.2 Western Europe Interactive Tables Market Estimates And Forecasts, By Country (2020-2032) (USD Billion)
10.3.2.3 Western Europe Interactive Tables Market Estimates And Forecasts, By Technology (2020-2032) (USD Billion)
10.3.2.4 Western Europe Interactive Tables Market Estimates And Forecasts, By Screen Size (2020-2032) (USD Billion)
10.3.2.5 Western Europe Interactive Tables Market Estimates And Forecasts, By Application (2020-2032) (USD Billion)
10.3.2.6 Germany
10.3.2.6.1 Germany Interactive Tables Market Estimates And Forecasts, By Technology (2020-2032) (USD Billion)
10.3.2.6.2 Germany Interactive Tables Market Estimates And Forecasts, By Screen Size (2020-2032) (USD Billion)
10.3.2.6.3 Germany Interactive Tables Market Estimates And Forecasts, By Application (2020-2032) (USD Billion)
10.3.2.7 France
10.3.2.7.1 France Interactive Tables Market Estimates And Forecasts, By Technology (2020-2032) (USD Billion)
10.3.2.7.2 France Interactive Tables Market Estimates And Forecasts, By Screen Size (2020-2032) (USD Billion)
10.3.2.7.3 France Interactive Tables Market Estimates And Forecasts, By Application (2020-2032) (USD Billion)
10.3.2.8 UK
10.3.2.8.1 UK Interactive Tables Market Estimates And Forecasts, By Technology (2020-2032) (USD Billion)
10.3.2.8.2 UK Interactive Tables Market Estimates And Forecasts, By Screen Size (2020-2032) (USD Billion)
10.3.2.8.3 UK Interactive Tables Market Estimates And Forecasts, By Application (2020-2032) (USD Billion)
10.3.2.9 Italy
10.3.2.9.1 Italy Interactive Tables Market Estimates And Forecasts, By Technology (2020-2032) (USD Billion)
10.3.2.9.2 Italy Interactive Tables Market Estimates And Forecasts, By Screen Size (2020-2032) (USD Billion)
10.3.2.9.3 Italy Interactive Tables Market Estimates And Forecasts, By Application (2020-2032) (USD Billion)
10.3.2.10 Spain
10.3.2.10.1 Spain Interactive Tables Market Estimates And Forecasts, By Technology (2020-2032) (USD Billion)
10.3.2.10.2 Spain Interactive Tables Market Estimates And Forecasts, By Screen Size (2020-2032) (USD Billion)
10.3.2.10.3 Spain Interactive Tables Market Estimates And Forecasts, By Application (2020-2032) (USD Billion)
10.3.2.11 Netherlands
10.3.2.11.1 Netherlands Interactive Tables Market Estimates And Forecasts, By Technology (2020-2032) (USD Billion)
10.3.2.11.2 Netherlands Interactive Tables Market Estimates And Forecasts, By Screen Size (2020-2032) (USD Billion)
10.3.2.11.3 Netherlands Interactive Tables Market Estimates And Forecasts, By Application (2020-2032) (USD Billion)
10.3.2.12 Switzerland
10.3.2.12.1 Switzerland Interactive Tables Market Estimates And Forecasts, By Technology (2020-2032) (USD Billion)
10.3.2.12.2 Switzerland Interactive Tables Market Estimates And Forecasts, By Screen Size (2020-2032) (USD Billion)
10.3.2.12.3 Switzerland Interactive Tables Market Estimates And Forecasts, By Application (2020-2032) (USD Billion)
10.3.2.13 Austria
10.3.2.13.1 Austria Interactive Tables Market Estimates And Forecasts, By Technology (2020-2032) (USD Billion)
10.3.2.13.2 Austria Interactive Tables Market Estimates And Forecasts, By Screen Size (2020-2032) (USD Billion)
10.3.2.13.3 Austria Interactive Tables Market Estimates And Forecasts, By Application (2020-2032) (USD Billion)
10.3.2.14 Rest Of Western Europe
10.3.2.14.1 Rest Of Western Europe Interactive Tables Market Estimates And Forecasts, By Technology (2020-2032) (USD Billion)
10.3.2.14.2 Rest Of Western Europe Interactive Tables Market Estimates And Forecasts, By Screen Size (2020-2032) (USD Billion)
10.3.2.14.3 Rest Of Western Europe Interactive Tables Market Estimates And Forecasts, By Application (2020-2032) (USD Billion)
10.4 Asia Pacific
10.4.1 Trends Analysis
10.4.2 Asia Pacific Interactive Tables Market Estimates And Forecasts, By Country (2020-2032) (USD Billion)
10.4.3 Asia Pacific Interactive Tables Market Estimates And Forecasts, By Technology (2020-2032) (USD Billion)
10.4.4 Asia Pacific Interactive Tables Market Estimates And Forecasts, By Screen Size (2020-2032) (USD Billion)
10.4.5 Asia Pacific Interactive Tables Market Estimates And Forecasts, By Application (2020-2032) (USD Billion)
10.4.6 China
10.4.6.1 China Interactive Tables Market Estimates And Forecasts, By Technology (2020-2032) (USD Billion)
10.4.6.2 China Interactive Tables Market Estimates And Forecasts, By Screen Size (2020-2032) (USD Billion)
10.4.6.3 China Interactive Tables Market Estimates And Forecasts, By Application (2020-2032) (USD Billion)
10.4.7 India
10.4.7.1 India Interactive Tables Market Estimates And Forecasts, By Technology (2020-2032) (USD Billion)
10.4.7.2 India Interactive Tables Market Estimates And Forecasts, By Screen Size (2020-2032) (USD Billion)
10.4.7.3 India Interactive Tables Market Estimates And Forecasts, By Application (2020-2032) (USD Billion)
10.4.8 Japan
10.4.8.1 Japan Interactive Tables Market Estimates And Forecasts, By Technology (2020-2032) (USD Billion)
10.4.8.2 Japan Interactive Tables Market Estimates And Forecasts, By Screen Size (2020-2032) (USD Billion)
10.4.8.3 Japan Interactive Tables Market Estimates And Forecasts, By Application (2020-2032) (USD Billion)
10.4.9 South Korea
10.4.9.1 South Korea Interactive Tables Market Estimates And Forecasts, By Technology (2020-2032) (USD Billion)
10.4.9.2 South Korea Interactive Tables Market Estimates And Forecasts, By Screen Size (2020-2032) (USD Billion)
10.4.9.3 South Korea Interactive Tables Market Estimates And Forecasts, By Application (2020-2032) (USD Billion)
10.4.10 Vietnam
10.4.10.1 Vietnam Interactive Tables Market Estimates And Forecasts, By Technology (2020-2032) (USD Billion)
10.4.10.2 Vietnam Interactive Tables Market Estimates And Forecasts, By Screen Size (2020-2032) (USD Billion)
10.4.10.3 Vietnam Interactive Tables Market Estimates And Forecasts, By Application (2020-2032) (USD Billion)
10.4.11 Singapore
10.4.11.1 Singapore Interactive Tables Market Estimates And Forecasts, By Technology (2020-2032) (USD Billion)
10.4.11.2 Singapore Interactive Tables Market Estimates And Forecasts, By Screen Size (2020-2032) (USD Billion)
10.4.11.3 Singapore Interactive Tables Market Estimates And Forecasts, By Application (2020-2032) (USD Billion)
10.4.12 Australia
10.4.12.1 Australia Interactive Tables Market Estimates And Forecasts, By Technology (2020-2032) (USD Billion)
10.4.12.2 Australia Interactive Tables Market Estimates And Forecasts, By Screen Size (2020-2032) (USD Billion)
10.4.12.3 Australia Interactive Tables Market Estimates And Forecasts, By Application (2020-2032) (USD Billion)
10.4.13 Rest Of Asia Pacific
10.4.13.1 Rest Of Asia Pacific Interactive Tables Market Estimates And Forecasts, By Technology (2020-2032) (USD Billion)
10.4.13.2 Rest Of Asia Pacific Interactive Tables Market Estimates And Forecasts, By Screen Size (2020-2032) (USD Billion)
10.4.13.3 Rest Of Asia Pacific Interactive Tables Market Estimates And Forecasts, By Application (2020-2032) (USD Billion)
10.5 Middle East And Africa
10.5.1 Middle East
10.5.1.1 Trends Analysis
10.5.1.2 Middle East Interactive Tables Market Estimates And Forecasts, By Country (2020-2032) (USD Billion)
10.5.1.3 Middle East Interactive Tables Market Estimates And Forecasts, By Technology (2020-2032) (USD Billion)
10.5.1.4 Middle East Interactive Tables Market Estimates And Forecasts, By Screen Size (2020-2032) (USD Billion)
10.5.1.5 Middle East Interactive Tables Market Estimates And Forecasts, By Application (2020-2032) (USD Billion)
10.5.1.6 UAE
10.5.1.6.1 UAE Interactive Tables Market Estimates And Forecasts, By Technology (2020-2032) (USD Billion)
10.5.1.6.2 UAE Interactive Tables Market Estimates And Forecasts, By Screen Size (2020-2032) (USD Billion)
10.5.1.6.3 UAE Interactive Tables Market Estimates And Forecasts, By Application (2020-2032) (USD Billion)
10.5.1.7 Egypt
10.5.1.7.1 Egypt Interactive Tables Market Estimates And Forecasts, By Technology (2020-2032) (USD Billion)
10.5.1.7.2 Egypt Interactive Tables Market Estimates And Forecasts, By Screen Size (2020-2032) (USD Billion)
10.5.1.7.3 Egypt Interactive Tables Market Estimates And Forecasts, By Application (2020-2032) (USD Billion)
10.5.1.8 Saudi Arabia
10.5.1.8.1 Saudi Arabia Interactive Tables Market Estimates And Forecasts, By Technology (2020-2032) (USD Billion)
10.5.1.8.2 Saudi Arabia Interactive Tables Market Estimates And Forecasts, By Screen Size (2020-2032) (USD Billion)
10.5.1.8.3 Saudi Arabia Interactive Tables Market Estimates And Forecasts, By Application (2020-2032) (USD Billion)
10.5.1.9 Qatar
10.5.1.9.1 Qatar Interactive Tables Market Estimates And Forecasts, By Technology (2020-2032) (USD Billion)
10.5.1.9.2 Qatar Interactive Tables Market Estimates And Forecasts, By Screen Size (2020-2032) (USD Billion)
10.5.1.9.3 Qatar Interactive Tables Market Estimates And Forecasts, By Application (2020-2032) (USD Billion)
10.5.1.10 Rest Of Middle East
10.5.1.10.1 Rest Of Middle East Interactive Tables Market Estimates And Forecasts, By Technology (2020-2032) (USD Billion)
10.5.1.10.2 Rest Of Middle East Interactive Tables Market Estimates And Forecasts, By Screen Size (2020-2032) (USD Billion)
10.5.1.10.3 Rest Of Middle East Interactive Tables Market Estimates And Forecasts, By Application (2020-2032) (USD Billion)
10.5.2 Africa
10.5.2.1 Trends Analysis
10.5.2.2 Africa Interactive Tables Market Estimates And Forecasts, By Country (2020-2032) (USD Billion)
10.5.2.3 Africa Interactive Tables Market Estimates And Forecasts, By Technology (2020-2032) (USD Billion)
10.5.2.4 Africa Interactive Tables Market Estimates And Forecasts, By Screen Size (2020-2032) (USD Billion)
10.5.2.5 Africa Interactive Tables Market Estimates And Forecasts, By Application (2020-2032) (USD Billion)
10.5.2.6 South Africa
10.5.2.6.1 South Africa Interactive Tables Market Estimates And Forecasts, By Technology (2020-2032) (USD Billion)
10.5.2.6.2 South Africa Interactive Tables Market Estimates And Forecasts, By Screen Size (2020-2032) (USD Billion)
10.5.2.6.3 South Africa Interactive Tables Market Estimates And Forecasts, By Application (2020-2032) (USD Billion)
10.5.2.7 Nigeria
10.5.2.7.1 Nigeria Interactive Tables Market Estimates And Forecasts, By Technology (2020-2032) (USD Billion)
10.5.2.7.2 Nigeria Interactive Tables Market Estimates And Forecasts, By Screen Size (2020-2032) (USD Billion)
10.5.2.7.3 Nigeria Interactive Tables Market Estimates And Forecasts, By Application (2020-2032) (USD Billion)
10.5.2.8 Rest Of Africa
10.5.2.8.1 Rest Of Africa Interactive Tables Market Estimates And Forecasts, By Technology (2020-2032) (USD Billion)
10.5.2.8.2 Rest Of Africa Interactive Tables Market Estimates And Forecasts, By Screen Size (2020-2032) (USD Billion)
10.5.2.8.3 Rest Of Africa Interactive Tables Market Estimates And Forecasts, By Application (2020-2032) (USD Billion)
10.6 Latin America
10.6.1 Trends Analysis
10.6.2 Latin America Interactive Tables Market Estimates And Forecasts, By Country (2020-2032) (USD Billion)
10.6.3 Latin America Interactive Tables Market Estimates And Forecasts, By Technology (2020-2032) (USD Billion)
10.6.4 Latin America Interactive Tables Market Estimates And Forecasts, By Screen Size (2020-2032) (USD Billion)
10.6.5 Latin America Interactive Tables Market Estimates And Forecasts, By Application (2020-2032) (USD Billion)
10.6.6 Brazil
10.6.6.1 Brazil Interactive Tables Market Estimates And Forecasts, By Technology (2020-2032) (USD Billion)
10.6.6.2 Brazil Interactive Tables Market Estimates And Forecasts, By Screen Size (2020-2032) (USD Billion)
10.6.6.3 Brazil Interactive Tables Market Estimates And Forecasts, By Application (2020-2032) (USD Billion)
10.6.7 Argentina
10.6.7.1 Argentina Interactive Tables Market Estimates And Forecasts, By Technology (2020-2032) (USD Billion)
10.6.7.2 Argentina Interactive Tables Market Estimates And Forecasts, By Screen Size (2020-2032) (USD Billion)
10.6.7.3 Argentina Interactive Tables Market Estimates And Forecasts, By Application (2020-2032) (USD Billion)
10.6.8 Colombia
10.6.8.1 Colombia Interactive Tables Market Estimates And Forecasts, By Technology (2020-2032) (USD Billion)
10.6.8.2 Colombia Interactive Tables Market Estimates And Forecasts, By Screen Size (2020-2032) (USD Billion)
10.6.8.3 Colombia Interactive Tables Market Estimates And Forecasts, By Application (2020-2032) (USD Billion)
10.6.9 Rest Of Latin America
10.6.9.1 Rest Of Latin America Interactive Tables Market Estimates And Forecasts, By Technology (2020-2032) (USD Billion)
10.6.9.2 Rest Of Latin America Interactive Tables Market Estimates And Forecasts, By Screen Size (2020-2032) (USD Billion)
10.6.9.3 Rest Of Latin America Interactive Tables Market Estimates And Forecasts, By Application (2020-2032) (USD Billion)
11. Company Profiles
11.1 Samsung Electronics
11.1.1 Company Overview
11.1.2 Financial
11.1.3 Products/ Services Offered
11.1.4 SWOT Analysis
11.2 LG Electronics
11.2.1 Company Overview
11.2.2 Financial
11.2.3 Products/ Services Offered
11.2.4 SWOT Analysis
11.3 Microsoft
11.3.1 Company Overview
11.3.2 Financial
11.3.3 Products/ Services Offered
11.3.4 SWOT Analysis
11.4 Sharp Corporation
11.4.1 Company Overview
11.4.2 Financial
11.4.3 Products/ Services Offered
11.4.4 SWOT Analysis
11.5 Elo Touch Solutions
11.5.1 Company Overview
11.5.2 Financial
11.5.3 Products/ Services Offered
11.5.4 SWOT Analysis
11.6 ViewSonic
11.6.1 Company Overview
11.6.2 Financial
11.6.3 Products/ Services Offered
11.6.4 SWOT Analysis
11.7 Zytech
11.7.1 Company Overview
11.7.2 Financial
11.7.3 Products/ Services Offered
11.7.4 SWOT Analysis
11.8 BenQ
11.8.1 Company Overview
11.8.2 Financial
11.8.3 Products/ Services Offered
11.8.4 SWOT Analysis
11.9 InFocus Corporation
11.9.1 Company Overview
11.9.2 Financial
11.9.3 Products/ Services Offered
11.9.4 SWOT Analysis
11.10 SMART Technologies
11.10.1 Company Overview
11.10.2 Financial
11.10.3 Products/ Services Offered
11.10.4 SWOT Analysis
12. Use Cases and Best Practices
13. Conclusion
An accurate research report requires proper strategizing as well as implementation. There are multiple factors involved in the completion of good and accurate research report and selecting the best methodology to compete the research is the toughest part. Since the research reports we provide play a crucial role in any company’s decision-making process, therefore we at SNS Insider always believe that we should choose the best method which gives us results closer to reality. This allows us to reach at a stage wherein we can provide our clients best and accurate investment to output ratio.
Each report that we prepare takes a timeframe of 350-400 business hours for production. Starting from the selection of titles through a couple of in-depth brain storming session to the final QC process before uploading our titles on our website we dedicate around 350 working hours. The titles are selected based on their current market cap and the foreseen CAGR and growth.
The 5 steps process:
Step 1: Secondary Research:
Secondary Research or Desk Research is as the name suggests is a research process wherein, we collect data through the readily available information. In this process we use various paid and unpaid databases which our team has access to and gather data through the same. This includes examining of listed companies’ annual reports, Journals, SEC filling etc. Apart from this our team has access to various associations across the globe across different industries. Lastly, we have exchange relationships with various university as well as individual libraries.
Step 2: Primary Research
When we talk about primary research, it is a type of study in which the researchers collect relevant data samples directly, rather than relying on previously collected data. This type of research is focused on gaining content specific facts that can be sued to solve specific problems. Since the collected data is fresh and first hand therefore it makes the study more accurate and genuine.
We at SNS Insider have divided Primary Research into 2 parts.
Part 1 wherein we interview the KOLs of major players as well as the upcoming ones across various geographic regions. This allows us to have their view over the market scenario and acts as an important tool to come closer to the accurate market numbers. As many as 45 paid and unpaid primary interviews are taken from both the demand and supply side of the industry to make sure we land at an accurate judgement and analysis of the market.
This step involves the triangulation of data wherein our team analyses the interview transcripts, online survey responses and observation of on filed participants. The below mentioned chart should give a better understanding of the part 1 of the primary interview.
Part 2: In this part of primary research the data collected via secondary research and the part 1 of the primary research is validated with the interviews from individual consultants and subject matter experts.
Consultants are those set of people who have at least 12 years of experience and expertise within the industry whereas Subject Matter Experts are those with at least 15 years of experience behind their back within the same space. The data with the help of two main processes i.e., FGDs (Focused Group Discussions) and IDs (Individual Discussions). This gives us a 3rd party nonbiased primary view of the market scenario making it a more dependable one while collation of the data pointers.
Step 3: Data Bank Validation
Once all the information is collected via primary and secondary sources, we run that information for data validation. At our intelligence centre our research heads track a lot of information related to the market which includes the quarterly reports, the daily stock prices, and other relevant information. Our data bank server gets updated every fortnight and that is how the information which we collected using our primary and secondary information is revalidated in real time.
Step 4: QA/QC Process
After all the data collection and validation our team does a final level of quality check and quality assurance to get rid of any unwanted or undesired mistakes. This might include but not limited to getting rid of the any typos, duplication of numbers or missing of any important information. The people involved in this process include technical content writers, research heads and graphics people. Once this process is completed the title gets uploader on our platform for our clients to read it.
Step 5: Final QC/QA Process:
This is the last process and comes when the client has ordered the study. In this process a final QA/QC is done before the study is emailed to the client. Since we believe in giving our clients a good experience of our research studies, therefore, to make sure that we do not lack at our end in any way humanly possible we do a final round of quality check and then dispatch the study to the client.
Key Segments:
By Technology
LCD
LED
Capacitive
Others
By Screen Size
32-65 inch
65 inch & above
By Application
Exhibition & Trade Shows
Education, Retail
Control Room
Hospitality
Transportation
Others
Request for Segment Customization as per your Business Requirement: Segment Customization Request
REGIONAL COVERAGE:
North America
US
Canada
Mexico
Europe
Eastern Europe
Poland
Romania
Hungary
Turkey
Rest of Eastern Europe
Western Europe
Germany
France
UK
Italy
Spain
Netherlands
Switzerland
Austria
Rest of Western Europe
Asia Pacific
China
India
Japan
South Korea
Vietnam
Singapore
Australia
Rest of Asia Pacific
Middle East & Africa
Middle East
UAE
Egypt
Saudi Arabia
Qatar
Rest of the Middle East
Africa
Nigeria
South Africa
Rest of Africa
Latin America
Brazil
Argentina
Colombia
Rest of Latin America
Request for Country Level Research Report: Country Level Customization Request
Available Customization
With the given market data, SNS Insider offers customization as per the company’s specific needs. The following customization options are available for the report:
Product Analysis
Criss-Cross segment analysis (e.g. Product X Application)
Product Matrix which gives a detailed comparison of the product portfolio of each company
Geographic Analysis
Additional countries in any of the regions
Company Information
Detailed analysis and profiling of additional market players (Up to five)
The Traction Transformer Market Size was valued at USD 1.42 Billion in 2023 and is expected to reach USD 2.49 Billion by 2032 and grow at a CAGR of 6.51% over the forecast period 2024-2032.
Industrial Safety Market Size was valued at USD 6.74 billion in 2023 and is expected to reach USD 12.39 billion by 2032 and grow at a CAGR of 7% over the forecast period 2024-2032.
The High-Frequency Transformer Market Size was valued at USD 2.02 billion in 2023 and expected to grow at 6.43% CAGR to reach USD 3.54 billion by 2032.
The Large Format Printer Market Size was valued at USD 8.61 Billion in 2023 and is expected to reach USD 13.32 Billion, at a CAGR of 4.99% by 2024-2032
The Testing, Inspection, and Certification (TIC) Market size is expected to reach $427.69 billion, growing at a CAGR of 3.94% by forecasts 2024-2032
The Smart Irrigation Market size was valued at USD 1.59 billion in 2023 and is expected to grow at a CAGR of 13.22% to reach USD 4.86 billion by 2032.
Hi! Click one of our member below to chat on Phone