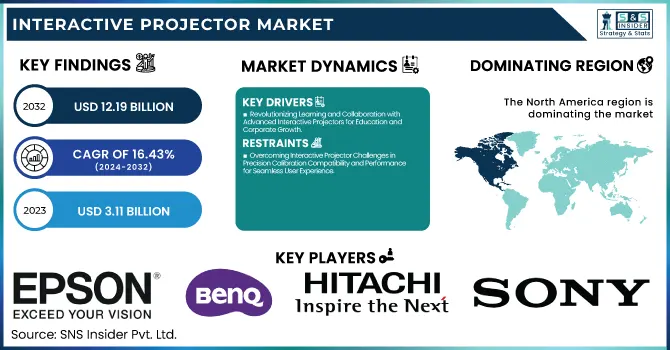
The Interactive Projector Market was valued at USD 3.11 billion in 2023 and is expected to reach USD 12.19 billion by 2032, growing at a CAGR of 16.43% over the forecast period 2024-2032. Innovations such as Augmented Reality (AR) and gesture-controlled projection are providing interactive projectors with an AR element that allows for immersive experiences without any physical touch, changing the areas in which they can be used, from education to gaming, and business. The level of customization and modular solutions allows users to improve parts of the appliance instead of replacing them for the sake of flexibility.
To Get more information on Interactive Projector Market - Request Free Sample Report
Accessibility to AI is facilitating a wide range of automation and speech recognition and real-time adaptability and kinds, further, becoming more potent the function of the project for several rising technology IM due to hybrid work development and remote collaboration capable interactive projection systems to be learned through cloud-Integrated. After experiencing minor growth toward the end of the decade, by 2024, the U.S. interactive projector market began to rebound, with the education sector notably activating more than 60% of K-12 classrooms incorporating interactive projectors to help facilitate learning. Roughly 45% of businesses in the corporate sector started using interactive projectors for collaborative meetings and presentations, showing a trend towards more intelligent and cooperative tools for communication.
The U.S. Interactive Projector Market is estimated to be USD 0.87 Billion in 2023 and is projected to grow at a CAGR of 16.23%. The rapid adoption of interactive projectors in smart classrooms, and corporate hybrid workspaces is driving the growth of the U.S. interactive projector market, along with the rise in demand for collaborative learning, technological advances in AI and AR, and increasing use of interactive projectors in training and presentations.
Key Drivers:
Revolutionizing Learning and Collaboration with Advanced Interactive Projectors for Education and Corporate Growth
The rising demand for smart learning solutions in educational institutions and corporate training settings is primarily accelerating the growth of the interactive projector market. As schools and businesses embrace the digital world in these challenging times, the need for interactive learning tools has skyrocketed, helping to enhance engagement and collaboration. Also, technological improvements in projection, including higher resolution, increased brightness, and better touch, have all greatly enhanced the user experience. Moreover, the preference for ultra-short throw projectors along with the ability of these projectors to reduce and eliminate shadows and glare, is expected to drive the market. In addition, the increasing use of interactive projectors in corporate settings for presentations and conferences also aids market growth as companies will look for economical and compact solutions.
Restrain:
Overcoming Interactive Projector Challenges in Precision Calibration Compatibility and Performance for Seamless User Experience
Technical limitations on the interactivity of projectors with video sources and compatibility issues are challenges faced by the interactive projector market. Interactive projectors have long needed precise calibration and maintenance to work properly, a task impractical for non-technical users. Inconsistent touch sensitivity and lag in response time also lead to a poorer user experience which restricts adoption in professional and academic environments. However, it still suffers from the need for specific lighting conditions to obtain clear projection quality as too much ambient light deteriorates visibility and can sabotage presentations. This may limit mass acceptance, particularly in situations where lighting control is challenging due to the aforementioned technical restrictions.
Opportunity:
Unlocking Growth in Interactive Projectors with AI Cloud Connectivity AR VR and Digital Transformation
Technological advancements like cloud platform connectives and AI-based interactive technologies are driving the opportunities in the interactive projector market. Clinical education and patient education are an important part of the utilization of interactive projectors in the healthcare sector, and this, in turn, offers the opportunity for growth over the forecast period. Moreover, the growing application of AR and VR in projection systems offers new possibilities for immersive types of learning experiences. Rapid digital transformation, combined with efforts of the governments to strengthen the educational infrastructure in the countries will unlock a wider and sustainable opportunity in the emerging markets, particularly in Asia-Pacific and Latin America. All these drivers combined are favorable drivers of market growth.
Challenges:
Navigating Competitive Challenges as Alternative Display Technologies and Digital Solutions Disrupt Interactive Projectors
Another significant challenge stems from the growing competition offered by alternative display technologies, including interactive flat-panel displays and LED walls. They provide better image quality, lower maintenance, and longer life, which is why some users prefer these alternatives; Even more so, the switch to online learning and remote collaborating tools lowers the dependence on interactive projectors, since many digital whiteboards and cloud-based software solutions can cover the same features as interactive projectors without the need for any projectors at all. Also, difficulties related to the longevity of hardware and long-term care needs come into play since organizations are looking for long-lasting, sustainable display options. These factors must be overcome to continue growing the interactive projector market.
By Technology
3LCD technology continued to lead the interactive projector market in 2023, capturing 54.7% of the market due to its advanced color reproduction, brightness, and efficient power consumption. 3LCD projectors are recommended for educational and business applications that provide better image detail and deeper colors and are ideal for most interactive learning with wide and corporate presentation solutions. This wide applicability factor, coupled with their lower costs and high reliability, has resulted in great penetration of RFIDs in several industries.
The fastest CAGR will be recorded by Liquid-Crystal-on-Silicon (LCoS) technology from 2024 to 2032, due to the ability to provide high-resolution content and ultimately a better image quality compared to micro-display technology. LCoS projectors are increasingly being adopted in applications where some of the more expensive models used to dominate such as healthcare, simulation training, and immersive learning environments. The rise in demand for high-end display systems and improvements in projection processes are expected to help LCoS become a major component of the interactive projector industry.
By Projection
In 2023, ultra-short throw projectors held the largest interactive projector market share of 53.3% because the interactive projectors can project a large and high-quality image from a very short distance. Overhead projectors are highly popular in schools and corporate environments because they reduce shadows and prevent the user from passing light and interrupting the original projection. For interactive applications, their compactness, ease of installation, and lesser eye fatigue make them most suitable and thus propel their growth in the market.
Short-throw projectors are projected to grow at the highest CAGR from 2024 to 2032, due to the cost-to-performance ratio they provide. Short-throw projects are even more flexible for rooms that are small to medium-sized, making them the perfect choice for classrooms, meeting rooms, and collaborative workspaces. The consumer shift toward interactive learning and business collaboration tools as well as technological advancements in projection technology is likely to drive the short throw projector demand, thereby pushing the market growth at a rapid rate.
By Application
The interactive projector market was dominated by the education segment in 2023, with a market share of 44.8%. The increasing digitalization of learning tools in schools, colleges, and training centers has created a demand for interactive projectors, promoting student engagement and interactive learning experiences. Market growth has been further boosted by the initiatives taken by the government for modernizing classrooms coupled with the growing adoption of e-learning and smart education solutions. Interactive projectors have gained a firm foothold in the education sector due to the creation of dynamic, cooperative learning environments that they facilitate.
Healthcare is anticipated to hold a significant market share over the projected period, with the fastest CAGR from 2024 to 2032 owing to the escalating adoption of interactive projectors in medical training, patient education, and surgical simulations. Advanced visualization technology is gaining a high-value proposition in hospitals and medical institutions, driving improved diagnostic precisions and learning efficiency. Interactive projectors are proving essential to the revolution of medical education and training as healthcare providers invest in digital transformation.
The interactive projector market was dominated by North America in 2023, capturing a 38.7% market share due to increasing penetration of smart classroom technologies and better corporate training solutions. The region has seen robust digital investments and many schools and universities have implemented interactive projectors to engage students in learning. Moreover, these projects are used more and more by businesses for collaborative meetings and training. Large market players such as Epson, SMART Technologies, and Dell have aided in technology developments and product penetration. Market leadership in North America is being reinforced through a long-standing infrastructure, increased focus on measurement, and both industrial and corporate collaboration via the corporate learning centers in parallel collaborating with various regional policy experiments.
Asia-Pacific is expected to be the fastest-growing region with the highest CAGR from 2024 to 2032 on account of the fast-paced digital transformation, initiatives by the government in respect of education, and increasing adoption in healthcare and business applications. Nationwide such as China, Japan, additionally India are profiting greatly with clever class, as well as digitized healthcare remedies. Companies like BenQ, Panasonic, and Casio are making strides in the market and launching innovative interactive projectors for the education and enterprise segments of the region. In addition, the Asia-Pacific market will expand rapidly during the forecast period due to rising demand for affordable interactive learning tools of high quality and increasing corporate digitization in Asia-Pacific.

Get Customized Report as per Your Business Requirement - Enquiry Now
Epson (BrightLink 1485Fi)
BenQ (LH890UST)
Hitachi (CP-TW3005)
Sony (VPL-SW235)
Panasonic (PT-TW371R)
ViewSonic (PS750W)
Optoma (EH320USTi)
Casio (XJ-UT311WN)
Christie (Captiva DWU500S)
TouchMagix (MagixFloor)
Mayeter (Games Floor Projection)
Oway (Interactive Whiteboard FT6)
Airzoy (Interactive Floor System)
Holkoi Systems (HD5802 4K Smart Projector)
Hisense (PX3-Pro Laser Projector)
In May 2024, Epson, the leading projector brand, unveiled its latest large-venue 4K 3-chip 3LCD laser projectors, highlighting high-impact display solutions for professional and commercial use.
In July 2024, BenQ India launched the BenQ Board RE04 Series, its latest interactive flat panel (IFP), designed to enhance collaboration and smart learning in education and business environments.
| Report Attributes | Details |
|---|---|
| Market Size in 2023 | USD 3.11 Billion |
| Market Size by 2032 | USD 12.19 Billion |
| CAGR | CAGR of 16.43% From 2024 to 2032 |
| Base Year | 2023 |
| Forecast Period | 2024-2032 |
| Historical Data | 2020-2022 |
| Report Scope & Coverage | Market Size, Segments Analysis, Competitive Landscape, Regional Analysis, DROC & SWOT Analysis, Forecast Outlook |
| Key Segments | • By Technology (Digital Light Processing (DLP), 3LCD, Liquid-Crystal-on-Silicon (LCoS)) • By Projection (Standard throw, Short throw, Ultra-short throw) • By Application (Education, Business, Healthcare, Others) |
| Regional Analysis/Coverage | North America (US, Canada, Mexico), Europe (Eastern Europe [Poland, Romania, Hungary, Turkey, Rest of Eastern Europe] Western Europe] Germany, France, UK, Italy, Spain, Netherlands, Switzerland, Austria, Rest of Western Europe]), Asia Pacific (China, India, Japan, South Korea, Vietnam, Singapore, Australia, Rest of Asia Pacific), Middle East & Africa (Middle East [UAE, Egypt, Saudi Arabia, Qatar, Rest of Middle East], Africa [Nigeria, South Africa, Rest of Africa], Latin America (Brazil, Argentina, Colombia, Rest of Latin America) |
| Company Profiles | Epson, BenQ, Hitachi, Sony, Panasonic, ViewSonic, Optoma, Casio, Christie, TouchMagix, Mayeter, Oway, Airzoy, Holkoi Systems, Hisense. |
Ans: The Interactive Projector Market is expected to grow at a CAGR of 16.43% during 2024-2032.
Ans: Interactive Projector Market size was USD 3.11 billion in 2023 and is expected to Reach USD 12.19 billion by 2032.
Ans: The major growth factor of the Interactive Projector Market is the increasing adoption of smart classrooms and hybrid work environments, driving demand for advanced collaborative and touch-enabled projection solutions.
Ans: The 3LCD segment dominated the Interactive Projector Market in 2023.
Ans: North America dominated the Interactive Projector Market in 2023.
1. Introduction
1.1 Market Definition
1.2 Scope (Inclusion and Exclusions)
1.3 Research Assumptions
2. Executive Summary
2.1 Market Overview
2.2 Regional Synopsis
2.3 Competitive Summary
3. Research Methodology
3.1 Top-Down Approach
3.2 Bottom-up Approach
3.3. Data Validation
3.4 Primary Interviews
4. Market Dynamics Impact Analysis
4.1 Market Driving Factors Analysis
4.1.1 Drivers
4.1.2 Restraints
4.1.3 Opportunities
4.1.4 Challenges
4.2 PESTLE Analysis
4.3 Porter’s Five Forces Model
5. Statistical Insights and Trends Reporting
5.1 Augmented Reality (AR) & Gesture-Controlled Projection
5.2 Customization & Modular Projection Solutions
5.3 Impact of AI & Machine Learning in Interactive Projectors
5.4 Future Growth in Hybrid Work & Remote Collaboration
6. Competitive Landscape
6.1 List of Major Companies, By Region
6.2 Market Share Analysis, By Region
6.3 Product Benchmarking
6.3.1 Product specifications and features
6.3.2 Pricing
6.4 Strategic Initiatives
6.4.1 Marketing and Promotional Activities
6.4.2 Distribution and Supply Chain Strategies
6.4.3 Expansion plans and new product launches
6.4.4 Strategic partnerships and collaborations
6.5 Technological Advancements
6.6 Market Positioning and Branding
7. Interactive Projector Market Segmentation, By Technology
7.1 Chapter Overview
7.2 Digital Light Processing (DLP)
7.2.1 Digital Light Processing (DLP) Market Trends Analysis (2020-2032)
7.2.2 Digital Light Processing (DLP) Market Size Estimates and Forecasts to 2032 (USD Billion)
7.3 3LCD
7.3.1 3LCD Market Trends Analysis (2020-2032)
7.3.2 3LCD Market Size Estimates and Forecasts to 2032 (USD Billion)
7.4 Liquid-Crystal-on-Silicon (LCoS)
7.4.1 Liquid-Crystal-on-Silicon (LCoS) Market Trends Analysis (2020-2032)
7.4.2 Liquid-Crystal-on-Silicon (LCoS) Market Size Estimates and Forecasts to 2032 (USD Billion)
8. Interactive Projector Market Segmentation, By Projection
8.1 Chapter Overview
8.2 Standard throw
8.2.1 Standard Throw Market Trends Analysis (2020-2032)
8.2.2 Standard Throw Market Size Estimates and Forecasts to 2032 (USD Billion)
8.3 Short throw
8.3.1 Short throw Market Trends Analysis (2020-2032)
8.3.2 Short throw Market Size Estimates and Forecasts to 2032 (USD Billion)
8.4 Ultra-short throw
8.4.1 Ultra-short throw Market Trends Analysis (2020-2032)
8.4.2 Ultra-short throw Market Size Estimates and Forecasts to 2032 (USD Billion)
9. Interactive Projector Market Segmentation, By Application
9.1 Chapter Overview
9.2 Education
9.2.1 Education Market Trends Analysis (2020-2032)
9.2.2 Education Market Size Estimates and Forecasts to 2032 (USD Billion)
9.3 Business
9.3.1 Business Market Trends Analysis (2020-2032)
9.3.2 Business Market Size Estimates and Forecasts to 2032 (USD Billion)
9.4 Healthcare
9.4.1 Healthcare Market Trends Analysis (2020-2032)
9.4.2 Healthcare Market Size Estimates and Forecasts to 2032 (USD Billion)
9.5 Others
9.5.1 Others Market Trends Analysis (2020-2032)
9.5.2 Others Market Size Estimates and Forecasts to 2032 (USD Billion)
10. Regional Analysis
10.1 Chapter Overview
10.2 North America
10.2.1 Trends Analysis
10.2.2 North America Interactive Projector Market Estimates and Forecasts, by Country (2020-2032) (USD Billion)
10.2.3 North America Interactive Projector Market Estimates and Forecasts, By Technology (2020-2032) (USD Billion)
10.2.4 North America Interactive Projector Market Estimates and Forecasts, By Projection (2020-2032) (USD Billion)
10.2.5 North America Interactive Projector Market Estimates and Forecasts, By Application (2020-2032) (USD Billion)
10.2.6 USA
10.2.6.1 USA Interactive Projector Market Estimates and Forecasts, By Technology (2020-2032) (USD Billion)
10.2.6.2 USA Interactive Projector Market Estimates and Forecasts, By Projection (2020-2032) (USD Billion)
10.2.6.3 USA Interactive Projector Market Estimates and Forecasts, By Application (2020-2032) (USD Billion)
10.2.7 Canada
10.2.7.1 Canada Interactive Projector Market Estimates and Forecasts, By Technology (2020-2032) (USD Billion)
10.2.7.2 Canada Interactive Projector Market Estimates and Forecasts, By Projection (2020-2032) (USD Billion)
10.2.7.3 Canada Interactive Projector Market Estimates and Forecasts, By Application (2020-2032) (USD Billion)
10.2.8 Mexico
10.2.8.1 Mexico Interactive Projector Market Estimates and Forecasts, By Technology (2020-2032) (USD Billion)
10.2.8.2 Mexico Interactive Projector Market Estimates and Forecasts, By Projection (2020-2032) (USD Billion)
10.2.8.3 Mexico Interactive Projector Market Estimates and Forecasts, By Application (2020-2032) (USD Billion)
10.3 Europe
10.3.1 Eastern Europe
10.3.1.1 Trends Analysis
10.3.1.2 Eastern Europe Interactive Projector Market Estimates and Forecasts, by Country (2020-2032) (USD Billion)
10.3.1.3 Eastern Europe Interactive Projector Market Estimates and Forecasts, By Technology (2020-2032) (USD Billion)
10.3.1.4 Eastern Europe Interactive Projector Market Estimates and Forecasts, By Projection (2020-2032) (USD Billion)
10.3.1.5 Eastern Europe Interactive Projector Market Estimates and Forecasts, By Application (2020-2032) (USD Billion)
10.3.1.6 Poland
10.3.1.6.1 Poland Interactive Projector Market Estimates and Forecasts, By Technology (2020-2032) (USD Billion)
10.3.1.6.2 Poland Interactive Projector Market Estimates and Forecasts, By Projection (2020-2032) (USD Billion)
10.3.1.6.3 Poland Interactive Projector Market Estimates and Forecasts, By Application (2020-2032) (USD Billion)
10.3.1.7 Romania
10.3.1.7.1 Romania Interactive Projector Market Estimates and Forecasts, By Technology (2020-2032) (USD Billion)
10.3.1.7.2 Romania Interactive Projector Market Estimates and Forecasts, By Projection (2020-2032) (USD Billion)
10.3.1.7.3 Romania Interactive Projector Market Estimates and Forecasts, By Application (2020-2032) (USD Billion)
10.3.1.8 Hungary
10.3.1.8.1 Hungary Interactive Projector Market Estimates and Forecasts, By Technology (2020-2032) (USD Billion)
10.3.1.8.2 Hungary Interactive Projector Market Estimates and Forecasts, By Projection (2020-2032) (USD Billion)
10.3.1.8.3 Hungary Interactive Projector Market Estimates and Forecasts, By Application (2020-2032) (USD Billion)
10.3.1.9 Turkey
10.3.1.9.1 Turkey Interactive Projector Market Estimates and Forecasts, By Technology (2020-2032) (USD Billion)
10.3.1.9.2 Turkey Interactive Projector Market Estimates and Forecasts, By Projection (2020-2032) (USD Billion)
10.3.1.9.3 Turkey Interactive Projector Market Estimates and Forecasts, By Application (2020-2032) (USD Billion)
10.3.1.10 Rest of Eastern Europe
10.3.1.10.1 Rest of Eastern Europe Interactive Projector Market Estimates and Forecasts, By Technology (2020-2032) (USD Billion)
10.3.1.10.2 Rest of Eastern Europe Interactive Projector Market Estimates and Forecasts, By Projection (2020-2032) (USD Billion)
10.3.1.10.3 Rest of Eastern Europe Interactive Projector Market Estimates and Forecasts, By Application (2020-2032) (USD Billion)
10.3.2 Western Europe
10.3.2.1 Trends Analysis
10.3.2.2 Western Europe Interactive Projector Market Estimates and Forecasts, by Country (2020-2032) (USD Billion)
10.3.2.3 Western Europe Interactive Projector Market Estimates and Forecasts, By Technology (2020-2032) (USD Billion)
10.3.2.4 Western Europe Interactive Projector Market Estimates and Forecasts, By Projection (2020-2032) (USD Billion)
10.3.2.5 Western Europe Interactive Projector Market Estimates and Forecasts, By Application (2020-2032) (USD Billion)
10.3.2.6 Germany
10.3.2.6.1 Germany Interactive Projector Market Estimates and Forecasts, By Technology (2020-2032) (USD Billion)
10.3.2.6.2 Germany Interactive Projector Market Estimates and Forecasts, By Projection (2020-2032) (USD Billion)
10.3.2.6.3 Germany Interactive Projector Market Estimates and Forecasts, By Application (2020-2032) (USD Billion)
10.3.2.7 France
10.3.2.7.1 France Interactive Projector Market Estimates and Forecasts, By Technology (2020-2032) (USD Billion)
10.3.2.7.2 France Interactive Projector Market Estimates and Forecasts, By Projection (2020-2032) (USD Billion)
10.3.2.7.3 France Interactive Projector Market Estimates and Forecasts, By Application (2020-2032) (USD Billion)
10.3.2.8 UK
10.3.2.8.1 UK Interactive Projector Market Estimates and Forecasts, By Technology (2020-2032) (USD Billion)
10.3.2.8.2 UK Interactive Projector Market Estimates and Forecasts, By Projection (2020-2032) (USD Billion)
10.3.2.8.3 UK Interactive Projector Market Estimates and Forecasts, By Application (2020-2032) (USD Billion)
10.3.2.9 Italy
10.3.2.9.1 Italy Interactive Projector Market Estimates and Forecasts, By Technology (2020-2032) (USD Billion)
10.3.2.9.2 Italy Interactive Projector Market Estimates and Forecasts, By Projection (2020-2032) (USD Billion)
10.3.2.9.3 Italy Interactive Projector Market Estimates and Forecasts, By Application (2020-2032) (USD Billion)
10.3.2.10 Spain
10.3.2.10.1 Spain Interactive Projector Market Estimates and Forecasts, By Technology (2020-2032) (USD Billion)
10.3.2.10.2 Spain Interactive Projector Market Estimates and Forecasts, By Projection (2020-2032) (USD Billion)
10.3.2.10.3 Spain Interactive Projector Market Estimates and Forecasts, By Application (2020-2032) (USD Billion)
10.3.2.11 Netherlands
10.3.2.11.1 Netherlands Interactive Projector Market Estimates and Forecasts, By Technology (2020-2032) (USD Billion)
10.3.2.11.2 Netherlands Interactive Projector Market Estimates and Forecasts, By Projection (2020-2032) (USD Billion)
10.3.2.11.3 Netherlands Interactive Projector Market Estimates and Forecasts, By Application (2020-2032) (USD Billion)
10.3.2.12 Switzerland
10.3.2.12.1 Switzerland Interactive Projector Market Estimates and Forecasts, By Technology (2020-2032) (USD Billion)
10.3.2.12.2 Switzerland Interactive Projector Market Estimates and Forecasts, By Projection (2020-2032) (USD Billion)
10.3.2.12.3 Switzerland Interactive Projector Market Estimates and Forecasts, By Application (2020-2032) (USD Billion)
10.3.2.13 Austria
10.3.2.13.1 Austria Interactive Projector Market Estimates and Forecasts, By Technology (2020-2032) (USD Billion)
10.3.2.13.2 Austria Interactive Projector Market Estimates and Forecasts, By Projection (2020-2032) (USD Billion)
10.3.2.13.3 Austria Interactive Projector Market Estimates and Forecasts, By Application (2020-2032) (USD Billion)
10.3.2.14 Rest of Western Europe
10.3.2.14.1 Rest of Western Europe Interactive Projector Market Estimates and Forecasts, By Technology (2020-2032) (USD Billion)
10.3.2.14.2 Rest of Western Europe Interactive Projector Market Estimates and Forecasts, By Projection (2020-2032) (USD Billion)
10.3.2.14.3 Rest of Western Europe Interactive Projector Market Estimates and Forecasts, By Application (2020-2032) (USD Billion)
10.4 Asia Pacific
10.4.1 Trends Analysis
10.4.2 Asia Pacific Interactive Projector Market Estimates and Forecasts, by Country (2020-2032) (USD Billion)
10.4.3 Asia Pacific Interactive Projector Market Estimates and Forecasts, By Technology (2020-2032) (USD Billion)
10.4.4 Asia Pacific Interactive Projector Market Estimates and Forecasts, By Projection (2020-2032) (USD Billion)
10.4.5 Asia Pacific Interactive Projector Market Estimates and Forecasts, By Application (2020-2032) (USD Billion)
10.4.6 China
10.4.6.1 China Interactive Projector Market Estimates and Forecasts, By Technology (2020-2032) (USD Billion)
10.4.6.2 China Interactive Projector Market Estimates and Forecasts, By Projection (2020-2032) (USD Billion)
10.4.6.3 China Interactive Projector Market Estimates and Forecasts, By Application (2020-2032) (USD Billion)
10.4.7 India
10.4.7.1 India Interactive Projector Market Estimates and Forecasts, By Technology (2020-2032) (USD Billion)
10.4.7.2 India Interactive Projector Market Estimates and Forecasts, By Projection (2020-2032) (USD Billion)
10.4.7.3 India Interactive Projector Market Estimates and Forecasts, By Application (2020-2032) (USD Billion)
10.4.8 Japan
10.4.8.1 Japan Interactive Projector Market Estimates and Forecasts, By Technology (2020-2032) (USD Billion)
10.4.8.2 Japan Interactive Projector Market Estimates and Forecasts, By Projection (2020-2032) (USD Billion)
10.4.8.3 Japan Interactive Projector Market Estimates and Forecasts, By Application (2020-2032) (USD Billion)
10.4.9 South Korea
10.4.9.1 South Korea Interactive Projector Market Estimates and Forecasts, By Technology (2020-2032) (USD Billion)
10.4.9.2 South Korea Interactive Projector Market Estimates and Forecasts, By Projection (2020-2032) (USD Billion)
10.4.9.3 South Korea Interactive Projector Market Estimates and Forecasts, By Application (2020-2032) (USD Billion)
10.4.10 Vietnam
10.4.10.1 Vietnam Interactive Projector Market Estimates and Forecasts, By Technology (2020-2032) (USD Billion)
10.4.10.2 Vietnam Interactive Projector Market Estimates and Forecasts, By Projection (2020-2032) (USD Billion)
10.4.10.3 Vietnam Interactive Projector Market Estimates and Forecasts, By Application (2020-2032) (USD Billion)
10.4.11 Singapore
10.4.11.1 Singapore Interactive Projector Market Estimates and Forecasts, By Technology (2020-2032) (USD Billion)
10.4.11.2 Singapore Interactive Projector Market Estimates and Forecasts, By Projection (2020-2032) (USD Billion)
10.4.11.3 Singapore Interactive Projector Market Estimates and Forecasts, By Application (2020-2032) (USD Billion)
10.4.12 Australia
10.4.12.1 Australia Interactive Projector Market Estimates and Forecasts, By Technology (2020-2032) (USD Billion)
10.4.12.2 Australia Interactive Projector Market Estimates and Forecasts, By Projection (2020-2032) (USD Billion)
10.4.12.3 Australia Interactive Projector Market Estimates and Forecasts, By Application (2020-2032) (USD Billion)
10.4.13 Rest of Asia Pacific
10.4.13.1 Rest of Asia Pacific Interactive Projector Market Estimates and Forecasts, By Technology (2020-2032) (USD Billion)
10.4.13.2 Rest of Asia Pacific Interactive Projector Market Estimates and Forecasts, By Projection (2020-2032) (USD Billion)
10.4.13.3 Rest of Asia Pacific Interactive Projector Market Estimates and Forecasts, By Application (2020-2032) (USD Billion)
10.5 Middle East and Africa
10.5.1 Middle East
10.5.1.1 Trends Analysis
10.5.1.2 Middle East Interactive Projector Market Estimates and Forecasts, by Country (2020-2032) (USD Billion)
10.5.1.3 Middle East Interactive Projector Market Estimates and Forecasts, By Technology (2020-2032) (USD Billion)
10.5.1.4 Middle East Interactive Projector Market Estimates and Forecasts, By Projection (2020-2032) (USD Billion)
10.5.1.5 Middle East Interactive Projector Market Estimates and Forecasts, By Application (2020-2032) (USD Billion)
10.5.1.6 UAE
10.5.1.6.1 UAE Interactive Projector Market Estimates and Forecasts, By Technology (2020-2032) (USD Billion)
10.5.1.6.2 UAE Interactive Projector Market Estimates and Forecasts, By Projection (2020-2032) (USD Billion)
10.5.1.6.3 UAE Interactive Projector Market Estimates and Forecasts, By Application (2020-2032) (USD Billion)
10.5.1.7 Egypt
10.5.1.7.1 Egypt Interactive Projector Market Estimates and Forecasts, By Technology (2020-2032) (USD Billion)
10.5.1.7.2 Egypt Interactive Projector Market Estimates and Forecasts, By Projection (2020-2032) (USD Billion)
10.5.1.7.3 Egypt Interactive Projector Market Estimates and Forecasts, By Application (2020-2032) (USD Billion)
10.5.1.8 Saudi Arabia
10.5.1.8.1 Saudi Arabia Interactive Projector Market Estimates and Forecasts, By Technology (2020-2032) (USD Billion)
10.5.1.8.2 Saudi Arabia Interactive Projector Market Estimates and Forecasts, By Projection (2020-2032) (USD Billion)
10.5.1.8.3 Saudi Arabia Interactive Projector Market Estimates and Forecasts, By Application (2020-2032) (USD Billion)
10.5.1.9 Qatar
10.5.1.9.1 Qatar Interactive Projector Market Estimates and Forecasts, By Technology (2020-2032) (USD Billion)
10.5.1.9.2 Qatar Interactive Projector Market Estimates and Forecasts, By Projection (2020-2032) (USD Billion)
10.5.1.9.3 Qatar Interactive Projector Market Estimates and Forecasts, By Application (2020-2032) (USD Billion)
10.5.1.10 Rest of Middle East
10.5.1.10.1 Rest of Middle East Interactive Projector Market Estimates and Forecasts, By Technology (2020-2032) (USD Billion)
10.5.1.10.2 Rest of Middle East Interactive Projector Market Estimates and Forecasts, By Projection (2020-2032) (USD Billion)
10.5.1.10.3 Rest of Middle East Interactive Projector Market Estimates and Forecasts, By Application (2020-2032) (USD Billion)
10.5.2 Africa
10.5.2.1 Trends Analysis
10.5.2.2 Africa Interactive Projector Market Estimates and Forecasts, by Country (2020-2032) (USD Billion)
10.5.2.3 Africa Interactive Projector Market Estimates and Forecasts, By Technology (2020-2032) (USD Billion)
10.5.2.4 Africa Interactive Projector Market Estimates and Forecasts, By Projection (2020-2032) (USD Billion)
10.5.2.5 Africa Interactive Projector Market Estimates and Forecasts, By Application (2020-2032) (USD Billion)
10.5.2.6 South Africa
10.5.2.6.1 South Africa Interactive Projector Market Estimates and Forecasts, By Technology (2020-2032) (USD Billion)
10.5.2.6.2 South Africa Interactive Projector Market Estimates and Forecasts, By Projection (2020-2032) (USD Billion)
10.5.2.6.3 South Africa Interactive Projector Market Estimates and Forecasts, By Application (2020-2032) (USD Billion)
10.5.2.7 Nigeria
10.5.2.7.1 Nigeria Interactive Projector Market Estimates and Forecasts, By Technology (2020-2032) (USD Billion)
10.5.2.7.2 Nigeria Interactive Projector Market Estimates and Forecasts, By Projection (2020-2032) (USD Billion)
10.5.2.7.3 Nigeria Interactive Projector Market Estimates and Forecasts, By Application (2020-2032) (USD Billion)
10.5.2.8 Rest of Africa
10.5.2.8.1 Rest of Africa Interactive Projector Market Estimates and Forecasts, By Technology (2020-2032) (USD Billion)
10.5.2.8.2 Rest of Africa Interactive Projector Market Estimates and Forecasts, By Projection (2020-2032) (USD Billion)
10.5.2.8.3 Rest of Africa Interactive Projector Market Estimates and Forecasts, By Application (2020-2032) (USD Billion)
10.6 Latin America
10.6.1 Trends Analysis
10.6.2 Latin America Interactive Projector Market Estimates and Forecasts, by Country (2020-2032) (USD Billion)
10.6.3 Latin America Interactive Projector Market Estimates and Forecasts, By Technology (2020-2032) (USD Billion)
10.6.4 Latin America Interactive Projector Market Estimates and Forecasts, By Projection (2020-2032) (USD Billion)
10.6.5 Latin America Interactive Projector Market Estimates and Forecasts, By Application (2020-2032) (USD Billion)
10.6.6 Brazil
10.6.6.1 Brazil Interactive Projector Market Estimates and Forecasts, By Technology (2020-2032) (USD Billion)
10.6.6.2 Brazil Interactive Projector Market Estimates and Forecasts, By Projection (2020-2032) (USD Billion)
10.6.6.3 Brazil Interactive Projector Market Estimates and Forecasts, By Application (2020-2032) (USD Billion)
10.6.7 Argentina
10.6.7.1 Argentina Interactive Projector Market Estimates and Forecasts, By Technology (2020-2032) (USD Billion)
10.6.7.2 Argentina Interactive Projector Market Estimates and Forecasts, By Projection (2020-2032) (USD Billion)
10.6.7.3 Argentina Interactive Projector Market Estimates and Forecasts, By Application (2020-2032) (USD Billion)
10.6.8 Colombia
10.6.8.1 Colombia Interactive Projector Market Estimates and Forecasts, By Technology (2020-2032) (USD Billion)
10.6.8.2 Colombia Interactive Projector Market Estimates and Forecasts, By Projection (2020-2032) (USD Billion)
10.6.8.3 Colombia Interactive Projector Market Estimates and Forecasts, By Application (2020-2032) (USD Billion)
10.6.9 Rest of Latin America
10.6.9.1 Rest of Latin America Interactive Projector Market Estimates and Forecasts, By Technology (2020-2032) (USD Billion)
10.6.9.2 Rest of Latin America Interactive Projector Market Estimates and Forecasts, By Projection (2020-2032) (USD Billion)
10.6.9.3 Rest of Latin America Interactive Projector Market Estimates and Forecasts, By Application (2020-2032) (USD Billion)
11. Company Profiles
11.1 Epson.
11.1.1 Company Overview
11.1.2 Financial
11.1.3 Products/ Services Offered
11.1.4 SWOT Analysis
11.2 BenQ
11.2.1 Company Overview
11.2.2 Financial
11.2.3 Products/ Services Offered
11.2.4 SWOT Analysis
11.3 Hitachi
11.3.1 Company Overview
11.3.2 Financial
11.3.3 Products/ Services Offered
11.3.4 SWOT Analysis
11.4 Sony.
11.4.1 Company Overview
11.4.2 Financial
11.4.3 Products/ Services Offered
11.4.4 SWOT Analysis
11.5 Panasonic.
11.5.1 Company Overview
11.5.2 Financial
11.5.3 Products/ Services Offered
11.5.4 SWOT Analysis
11.6 ViewSonic
11.6.1 Company Overview
11.6.2 Financial
11.6.3 Products/ Services Offered
11.6.4 SWOT Analysis
11.7 Optoma.
11.7.1 Company Overview
11.7.2 Financial
11.7.3 Products/ Services Offered
11.7.4 SWOT Analysis
11.8 Casio.
11.8.1 Company Overview
11.8.2 Financial
11.8.3 Products/ Services Offered
11.8.4 SWOT Analysis
11.9 Christie
11.9.1 Company Overview
11.9.2 Financial
11.9.3 Products/ Services Offered
11.9.4 SWOT Analysis
11.10 TouchMagix.
11.10.1 Company Overview
11.10.2 Financial
11.10.3 Products/ Services Offered
11.10.4 SWOT Analysis
12. Use Cases and Best Practices
13. Conclusion
An accurate research report requires proper strategizing as well as implementation. There are multiple factors involved in the completion of good and accurate research report and selecting the best methodology to compete the research is the toughest part. Since the research reports we provide play a crucial role in any company’s decision-making process, therefore we at SNS Insider always believe that we should choose the best method which gives us results closer to reality. This allows us to reach at a stage wherein we can provide our clients best and accurate investment to output ratio.
Each report that we prepare takes a timeframe of 350-400 business hours for production. Starting from the selection of titles through a couple of in-depth brain storming session to the final QC process before uploading our titles on our website we dedicate around 350 working hours. The titles are selected based on their current market cap and the foreseen CAGR and growth.
The 5 steps process:
Step 1: Secondary Research:
Secondary Research or Desk Research is as the name suggests is a research process wherein, we collect data through the readily available information. In this process we use various paid and unpaid databases which our team has access to and gather data through the same. This includes examining of listed companies’ annual reports, Journals, SEC filling etc. Apart from this our team has access to various associations across the globe across different industries. Lastly, we have exchange relationships with various university as well as individual libraries.

Step 2: Primary Research
When we talk about primary research, it is a type of study in which the researchers collect relevant data samples directly, rather than relying on previously collected data. This type of research is focused on gaining content specific facts that can be sued to solve specific problems. Since the collected data is fresh and first hand therefore it makes the study more accurate and genuine.
We at SNS Insider have divided Primary Research into 2 parts.
Part 1 wherein we interview the KOLs of major players as well as the upcoming ones across various geographic regions. This allows us to have their view over the market scenario and acts as an important tool to come closer to the accurate market numbers. As many as 45 paid and unpaid primary interviews are taken from both the demand and supply side of the industry to make sure we land at an accurate judgement and analysis of the market.
This step involves the triangulation of data wherein our team analyses the interview transcripts, online survey responses and observation of on filed participants. The below mentioned chart should give a better understanding of the part 1 of the primary interview.

Part 2: In this part of primary research the data collected via secondary research and the part 1 of the primary research is validated with the interviews from individual consultants and subject matter experts.
Consultants are those set of people who have at least 12 years of experience and expertise within the industry whereas Subject Matter Experts are those with at least 15 years of experience behind their back within the same space. The data with the help of two main processes i.e., FGDs (Focused Group Discussions) and IDs (Individual Discussions). This gives us a 3rd party nonbiased primary view of the market scenario making it a more dependable one while collation of the data pointers.
Step 3: Data Bank Validation
Once all the information is collected via primary and secondary sources, we run that information for data validation. At our intelligence centre our research heads track a lot of information related to the market which includes the quarterly reports, the daily stock prices, and other relevant information. Our data bank server gets updated every fortnight and that is how the information which we collected using our primary and secondary information is revalidated in real time.

Step 4: QA/QC Process
After all the data collection and validation our team does a final level of quality check and quality assurance to get rid of any unwanted or undesired mistakes. This might include but not limited to getting rid of the any typos, duplication of numbers or missing of any important information. The people involved in this process include technical content writers, research heads and graphics people. Once this process is completed the title gets uploader on our platform for our clients to read it.
Step 5: Final QC/QA Process:
This is the last process and comes when the client has ordered the study. In this process a final QA/QC is done before the study is emailed to the client. Since we believe in giving our clients a good experience of our research studies, therefore, to make sure that we do not lack at our end in any way humanly possible we do a final round of quality check and then dispatch the study to the client.
By Technology
Digital Light Processing (DLP)
3LCD
Liquid-Crystal-on-Silicon (LCoS)
By Projection
Standard throw
Short throw
Ultra-short throw
By Application
Education
Business
Healthcare
Others
Request for Segment Customization as per your Business Requirement: Segment Customization Request
Regional Coverage:
North America
US
Canada
Mexico
Europe
Eastern Europe
Poland
Romania
Hungary
Turkey
Rest of Eastern Europe
Western Europe
Germany
France
UK
Italy
Spain
Netherlands
Switzerland
Austria
Rest of Western Europe
Asia Pacific
China
India
Japan
South Korea
Vietnam
Singapore
Australia
Rest of Asia Pacific
Middle East & Africa
Middle East
UAE
Egypt
Saudi Arabia
Qatar
Rest of Middle East
Africa
Nigeria
South Africa
Rest of Africa
Latin America
Brazil
Argentina
Colombia
Rest of Latin America
Request for Country Level Research Report: Country Level Customization Request
Available Customization
With the given market data, SNS Insider offers customization as per the company’s specific needs. The following customization options are available for the report:
Detailed Volume Analysis
Criss-Cross segment analysis (e.g. Product X Application)
Competitive Product Benchmarking
Geographic Analysis
Additional countries in any of the regions
Customized Data Representation
Detailed analysis and profiling of additional market players
The IoT Node and Gateway Market Size was valued at USD 478.12 billion in 2023 and is expected to reach USD 1459.33 billion by 2032 and grow at a CAGR of 13.2% over the forecast period 2024-2032.
The Robotic Arm Market Size was USD 28.04 Billion in 2023 and will reach to USD 81.83 Billion by 2032 and grow at a CAGR of 12.64% by 2024-2032.
The Land Mobile Radio Market was valued at USD 25.24 billion in 2023 and is projected to reach USD 69.11 billion by 2032, growing at a CAGR of 11.84% from 2024 to 2032.
The Battery Production Machine Market was worth USD 13.31 Billion in 2023 and is anticipated to reach USD 19.67 Billion in 2032, growing at a CAGR of 20.10 % during the period from 2024 to 2032
The Electric Toothbrush Market was valued at USD 4.38 billion in 2023 and is projected to reach USD 8.68 billion by 2032, growing at a robust CAGR of 7.90% during the forecast period of 2024-2032.
The Infrared Imaging Market Size was USD 7.03 Billion in 2023 and is expected to reach USD 12.36 Billion by 2032 and grow at a CAGR of 6.5% by 2024-2032.

Hi! Click one of our member below to chat on Phone
© 2025 All Rights Reserved by SNS Insider Pvt Ltd


