image

Intelligent Platform Management Interface (IPMI) Market Report Scope & Overview:

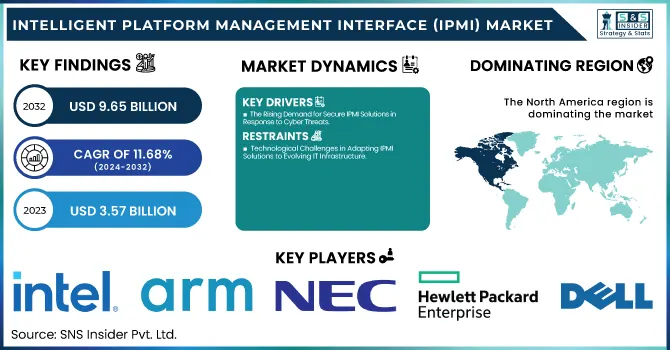
The Intelligent Platform Management Interface (IPMI) Market was valued at USD 3.57 billion in 2023 and is projected to reach USD 9.65 billion by 2032, growing at a CAGR of 11.68% from 2024 to 2032. The growing demand for efficient infrastructure management is one of the prime factors responsible for driving the growth of the Intelligent Platform Management Interface (IPMI) Market owing to the fact that businesses across all sectors are currently undergoing digital transformation. Shifting to distributed systems and remote work are both driving the need for remote monitoring solutions. Moreover, increasing emphasis on cybersecurity and green IT practices to minimize energy consumption in data centers is fueling the widespread adoption of IPMI. Responsive to the quick transition to cloud and hybrid situations, the necessity for IPMI treatments to manage both characteristic and cloud-reporting infrastructure is only growing. In the United States, the IPMI market was valued at USD 0.98 billion in 2023 and is projected to reach USD 2.24 billion by 2032, growing at a CAGR of 9.49%. This growth is fueled by advancements in digital transformation, with U.S. businesses increasingly adopting IPMI solutions for secure, remote IT infrastructure management, while also emphasizing cybersecurity, sustainability, and cloud adoption.

Intelligent Platform Management Interface (IPMI) Market Dynamics:

Drivers:

  • The Rising Demand for Secure IPMI Solutions in Response to Cyber Threats

As cyber threats become more frequent and sophisticated, ensuring the security of IT infrastructure is more critical than ever. Intelligent Platform Management Interface (IPMI) solutions are increasingly sought after by businesses to provide secure and efficient remote monitoring and management of sensitive systems and data centers. These systems enable administrators to manage servers even when the operating system is down, offering a critical layer of security for maintaining operational continuity. However, IPMI interfaces can present significant security risks if not properly configured, as vulnerabilities such as weak passwords and inadequate encryption can lead to unauthorized access. This has prompted organizations to adopt more secure versions of IPMI and integrate advanced security protocols to mitigate these risks. With the growing demand for data protection, IPMI's role in enabling secure, reliable, and remote management of infrastructure has become even more vital to modern enterprises' cybersecurity strategies.

Restraints:

  • Technological Challenges in Adapting IPMI Solutions to Evolving IT Infrastructure

The rapid pace of technological advancements in IT infrastructure creates significant challenges for organizations relying on Intelligent Platform Management Interface (IPMI) solutions. As new hardware and software technologies emerge, businesses are often faced with the need to update their IPMI systems to maintain compatibility. This requires continuous investments in upgrades, testing, and integration, which can increase operational costs. Furthermore, the complexity of keeping IPMI solutions up to date with cutting-edge technologies can lead to difficulties in ensuring seamless integration across different systems and infrastructure types. This ongoing adaptation process can delay the implementation of new technologies and hinder market growth, as companies may hesitate to invest in IPMI solutions that require frequent updates or may not be fully compatible with emerging advancements. As a result, the demand for more flexible and future-proof solutions could increase, potentially challenging the growth of the IPMI market.

Opportunities:

  • The Intelligent Platform Management Interface (IPMI) market presents significant opportunities driven by the growing adoption of advanced IT infrastructure technologies.

With the rapid migration of enterprises to the cloud, hybrid IT environments and edge computing, the solution to the server management problem is felt more than ever. The growing demand for physical system management and the need for improved operational efficiency drive the use of Remote Management Solutions such as IPMI systems characterized by its real-time remote monitoring, management, and maintenance competing for uptime in complex and distributed IT environments. Furthermore, AI and automation growth in data centers also presents an opportunity to correlate IPMI solutions with AI technologies to enhance predictive maintenance and security features. As the world relies more on IoT, the demand for scalable and resilient server management solution increases, leaving enough room for new IPMI technologies to develop and address these changing needs. Additionally, with the increasing focus on cybersecurity and compliance among organizations, IPMI solutions that provide better security features are becoming pivotal in maintaining the system integrity and safeguarding sensitive data.

Challenges:

  • The Intelligent Platform Management Interface (IPMI) market faces several key challenges that could impact its growth.

One significant challenge is security vulnerabilities, as IPMI systems are often targeted by cybercriminals due to their access to sensitive infrastructure. Ensuring robust security measures and regular updates to combat evolving threats remains a constant concern. Another challenge is the complexity of integration with diverse IT environments, particularly as companies adopt new hardware and software technologies. Ensuring compatibility across various platforms and maintaining system performance can be resource-intensive. Additionally, the lack of awareness among smaller enterprises regarding the benefits of IPMI solutions can slow adoption, especially when organizations prioritize cost over advanced management capabilities. High initial costs for implementing IPMI solutions, along with the need for continuous upgrades and maintenance, can also be prohibitive for some businesses. Addressing these challenges requires technological innovation and ongoing investment in security and compatibility.

Intelligent Platform Management Interface (IPMI) Market Segment Analysis:

By Component

The Baseboard Management Controller (BMC) segment dominated the Intelligent Platform Management Interface (IPMI) market, accounting for approximately 32% of the total revenue in 2023. This segment is expected to experience the fastest growth over the forecast period from 2024 to 2032, owing to the growing requirement for efficient remote monitoring of IT infrastructures, such as data center & servers. In determining what one has for systems management hardware, the BMC is all about providing low-level monitoring and management of system hardware, allowing IT administrators to analyze, control power, and recover a system from a remote location. The BMC segment also benefits from growing demand for efficient and secure remote management solutions, as well as trends such as digital transformation, cloud computing and hybrid IT environments. The BMC segment dominates the overall IPMI market, and its adoption is expected to continue to be a key driver in the overall IPMI market, as organizations move towards automation and secure IT operations.

By Application

The server segment dominated the Intelligent Platform Management Interface (IPMI) market, capturing around 49% of the total revenue in 2023. This large share is due to an increasing number of core applications running on servers in data centers, enterprises, and the cloud. This enables IT administrators to remotely monitor, manage, and troubleshoot servers without the need for physical access to the hardware. The demand for server-based IPMI solutions is accelerating, as businesses increasingly adopt automation and remote monitoring to maintain uptime and optimize server performance. The increased proliferation of cloud computing, virtualization, and hybrid IT infrastructure also further drives the demand for effective server management systems. The server segment’s share is reinforced by growing focus on data security, with IPMI solutions providing high-end security features, including secure access to sensitive information and system recovery.

The storage devices segment is expected to be the fastest-growing in the Intelligent Platform Management Interface (IPMI) market during the forecast period from 2024 to 2032. As businesses continue to generate vast amounts of data, the need for efficient, scalable, and secure storage solutions is increasing. IPMI solutions for storage devices enable real-time monitoring, remote management, and troubleshooting of storage systems, ensuring seamless data access and minimizing downtime. The growing adoption of cloud storage, big data analytics, and enterprise-level storage solutions is driving the demand for IPMI in this segment. Additionally, as data security and reliability become top priorities, IPMI solutions offer enhanced protection and fault tolerance for critical storage infrastructure, making them indispensable for organizations seeking to optimize storage performance and ensure data integrity.

By Verticals

The Banking, Financial Services, and Insurance (BFSI) segment dominated the largest share of revenue, accounting for around 44% in 2023 in the Intelligent Platform Management Interface (IPMI) market. The BFSI industry heavily depends on a robust and secure IT infrastructure and efficient IT management to successfully handle sensitive customer financial data and ensure a seamless service experience, thus fueling the growth of the IPMI market. Ensure security, uptime, and compliance with IPMI systems that are critical under stringent regulatory requirements and the need for availability. With cloud banking and online banking evolving digitally, the need for IPMI solutions in this segment will be continued strong.

The IT & Telecom segment is expected to be the fastest-growing segment in the Intelligent Platform Management Interface (IPMI) market from 2024 to 2032. With the rapid expansion of telecom infrastructure, data centers, and cloud-based services, the demand for efficient monitoring and management of critical systems is increasing. IPMI solutions are vital for ensuring security, performance, and uptime across these complex environments, driving adoption within the IT & Telecom industry.

Intelligent Platform Management Interface (IPMI) Market Regional Analysis:

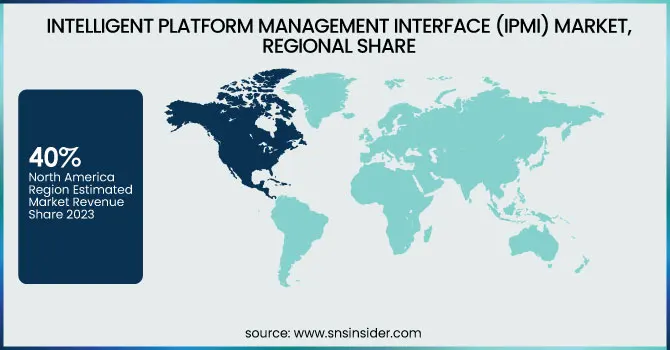
North America dominated the largest share of the Intelligent Platform Management Interface (IPMI) market, accounting for around 40% of the revenue in 2023. This region leads the market due to its strong technological infrastructure, rapid adoption of advanced IT solutions, and the presence of major players like Intel, Dell, and Cisco. The growing demand for efficient server management, coupled with an increasing focus on cybersecurity and remote monitoring, drives the adoption of IPMI solutions. In the United States, significant advancements in digital transformation and cloud computing have further fueled market growth, with businesses increasingly relying on IPMI for IT infrastructure management. Moreover, the high concentration of data centers, tech firms, and government agencies in North America contributes to the region's dominance. The continued investment in IoT, AI, and 5G technologies is expected to further support North America's leadership in the IPMI market.

The Asia-Pacific region is expected to be the fastest-growing market for Intelligent Platform Management Interface (IPMI) from 2024 to 2032. Rapid technology development is the chief facilitator behind this growth, with the rise of cloud computing, artificial intelligence (AI), and the rollout of 5G networks. This growth can be attributed to countries like China, India, and Japan, where booming data center infrastructure and a growing need for efficient and scalable IT management solutions is observed. The increasing adoption of industrialization, smart city initiatives, and IoT across the region also contributes to the demand for reliable IPMI solutions. With companies seeking to securely manage and optimize their IT infrastructure remotely, the burgeoning demand for the remote management of IT systems based on IPMI technologies in the Asia-Pacific region is likely to continue an upward trajectory.

Intelligent Platform Management Interface (IPMI) Market Key Players:

Some of the Major Players in Intelligent Platform Management Interface (IPMI) Market along with their Product:

  • Intel Corporation (U.S.) - Semiconductor and IT Infrastructure Solutions

  • ARM Holdings Inc. (U.K.) - Semiconductor Design and Architecture

  • Emerson (U.S.) - Automation and Control Solutions

  • NEC Corporation (Japan) - IT and Network Solutions

  • Super Micro Computer, Inc. (U.S.) - Server Solutions and Enterprise IT

  • Cisco (U.S.) - Networking Equipment and IT Solutions

  • Dell, Inc. (U.S.) - IT Hardware, Software, and Services

  • Hewlett Packard Enterprise (HPE) (U.S.) - Enterprise IT and Cloud Solutions

  • Microsoft (U.S.) - Software, Cloud Computing, and IT Solutions

  • Softlayer Technologies, Inc. (U.S.) - Cloud Infrastructure and Hosting Services

List of Potential Customers in Intelligent Platform Management Interface (IPMI) Market

  • Amazon Web Services (AWS)

  • Google Cloud

  • Facebook (Meta Platforms, Inc.)

  • Microsoft

  • Alibaba Cloud

  • IBM

  • Oracle

  • Tata Consultancy Services (TCS)

  • Wipro Limited

  • Hewlett Packard Enterprise (HPE)

  • Cisco

  • Super Micro Computer, Inc.

  • Dell Technologies

  • NEC Corporation

  • Huawei Technologies

  • SAP

  • Siemens AG

  • VMware

  • Rackspace Technology

  • Verizon Communications

Recent Development:

  • October 16, 2024 - The Cyber Security Association of China calls for a systematic review of Intel's products, citing security flaws in its CPUs that threaten China's national security. The association accuses Intel of continuing to sell compromised parts despite these vulnerabilities.

Intelligent Platform Management Interface (IPMI) Market Report Scope:

Report Attributes Details
Market Size in 2023 USD 3.57 Billion
Market Size by 2032 USD 9.65 Billion
CAGR CAGR of 11.68% From 2024 to 2032
Base Year 2023
Forecast Period 2024-2032
Historical Data 2020-2022
Report Scope & Coverage Market Size, Segments Analysis, Competitive  Landscape, Regional Analysis, DROC & SWOT Analysis, Forecast Outlook
Key Segments • By Component (Baseboard management controller, Sensors & controls, Memory devices, Others)
• By Application (Server, Storage devices, Telecommunication equipment)
• By Vertical(Banking, Financial services, and Insurance (BFSI), Healthcare, Education & research, Retail, Manufacturing, Public sector, IT & telecom, Others)
Regional Analysis/Coverage North America (US, Canada, Mexico), Europe (Eastern Europe [Poland, Romania, Hungary, Turkey, Rest of Eastern Europe] Western Europe] Germany, France, UK, Italy, Spain, Netherlands, Switzerland, Austria, Rest of Western Europe]), Asia Pacific (China, India, Japan, South Korea, Vietnam, Singapore, Australia, Rest of Asia Pacific), Middle East & Africa (Middle East [UAE, Egypt, Saudi Arabia, Qatar, Rest of Middle East], Africa [Nigeria, South Africa, Rest of Africa], Latin America (Brazil, Argentina, Colombia, Rest of Latin America)
Company Profiles Intel Corporation (U.S.), ARM Holdings Inc. (U.K.), Emerson (U.S.), NEC Corporation (Japan), Super Micro Computer, Inc. (U.S.), Cisco (U.S.), Dell, Inc. (U.S.), Hewlett Packard Enterprise (HPE) (U.S.), Microsoft (U.S.), Softlayer Technologies, Inc. (U.S.)

Frequently Asked Questions

Ans:  The Intelligent Platform Management Interface (IPMI) Market is expected to grow at a CAGR of 11.68% during 2024-2032

Ans: The Intelligent Platform Management Interface (IPMI) Market was USD 3.57 Billion in 2023 and is expected to Reach USD 9.65 Billion by 2032.

Ans: Increasing demand for remote server management, the growth of cybersecurity concerns, digital transformation, and the adoption of cloud and hybrid IT infrastructures.

Ans: The “Banking, Financial services, and Insurance (BFSI)” segment dominated the Intelligent Platform Management Interface (IPMI) Market.

Ans:  North America dominated the Intelligent Platform Management Interface (IPMI) Market in 2023.

Table of Content

1. Introduction

1.1 Market Definition

1.2 Scope (Inclusion and Exclusions)

1.3 Research Assumptions

2. Executive Summary

2.1 Market Overview

2.2 Regional Synopsis

2.3 Competitive Summary

3. Research Methodology

3.1 Top-Down Approach

3.2 Bottom-up Approach

3.3. Data Validation

3.4 Primary Interviews

4. Market Dynamics Impact Analysis

4.1 Market Driving Factors Analysis

4.1.1 Drivers

4.1.2 Restraints

4.1.3 Opportunities

4.1.4 Challenges

4.2 PESTLE Analysis

4.3 Porter’s Five Forces Model

5. Statistical Insights and Trends Reporting

5.1 Impact of Digital Transformation

5 .2 Remote Work and Distributed Systems

5.3 Growing Need for Cybersecurity

5.4 Sustainability and Green IT

5.5 Cloud Adoption and Hybrid Environments

6. Competitive Landscape

6.1 List of Major Companies, By Region

6.2 Market Share Analysis, By Region

6.3 Product Benchmarking

6.3.1 Product specifications and features

6.3.2 Pricing

6.4 Strategic Initiatives

6.4.1 Marketing and promotional activities

6.4.2 Distribution and supply chain strategies

6.4.3 Expansion plans and new product launches

6.4.4 Strategic partnerships and collaborations

6.5 Technological Advancements

6.6 Market Positioning and Branding

7. Intelligent Platform Management Interface (IPMI) Market Segmentation, by Component

7.1 Chapter Overview

7.2 Baseboard management controller

7.2.1 Baseboard management controller Market Trends Analysis (2020-2032)

7.2.2 Baseboard management controller Market Size Estimates and Forecasts to 2032 (USD Billion)

7.3 Sensors & controls

7.3.1 Sensors & controls Market Trends Analysis (2020-2032)

7.3.2 Sensors & controls Market Size Estimates and Forecasts to 2032 (USD Billion)

7.4 Memory devices

7.4.1 Memory devices Market Trends Analysis (2020-2032)

7.4.2 Memory devices Market Size Estimates and Forecasts to 2032 (USD Billion)

7.5 Others

7.5.1 Others Market Trends Analysis (2020-2032)

7.5.2 Others Market Size Estimates and Forecasts to 2032 (USD Billion)

8. Intelligent Platform Management Interface (IPMI) Market Segmentation, by Application

8.1 Chapter Overview

8.2 Server

8.2.1 Server Market Trends Analysis (2020-2032)

8.2.2 Server Market Size Estimates and Forecasts to 2032 (USD Billion)

8.3 Storage devices

8.3.1 Storage devices Market Trends Analysis (2020-2032)

8.3.2 Storage devices Market Size Estimates and Forecasts to 2032 (USD Billion)

8.4 Telecommunication equipment

8.4.1 Telecommunication equipment Market Trends Analysis (2020-2032)

8.4.2 Telecommunication equipment Market Size Estimates and Forecasts to 2032 (USD Billion)

9. Intelligent Platform Management Interface (IPMI) Market Segmentation, by Verticals

9.1 Chapter Overview

9.2 Banking, Financial services, and Insurance (BFSI)

9.2.1 Banking, Financial services, and Insurance (BFSI) Market Trends Analysis (2020-2032)

9.2.2 Banking, Financial services, and Insurance (BFSI) Market Size Estimates and Forecasts to 2032 (USD Billion)

9.3 Healthcare

9.3.1 Healthcare Market Trends Analysis (2020-2032)

9.3.2 Healthcare Market Size Estimates and Forecasts to 2032 (USD Billion)

9.4 Education & research

9.4.1 Education & research Market Trends Analysis (2020-2032)

9.4.2 Education & research Market Size Estimates and Forecasts to 2032 (USD Billion)

9.5 Retail

9.5.1 Retail Market Trends Analysis (2020-2032)

9.5.2 Retail Market Size Estimates and Forecasts to 2032 (USD Billion)

9.6 Manufacturing

9.6.1 Manufacturing Market Trends Analysis (2020-2032)

9.6.2 Manufacturing Market Size Estimates and Forecasts to 2032 (USD Billion)

9.7 Public sector

9.7.1 Public sector Market Trends Analysis (2020-2032)

9.7.2 Public sector Market Size Estimates and Forecasts to 2032 (USD Billion)

9.8 IT & telecom

9.8.1 IT & telecom Market Trends Analysis (2020-2032)

9.8.2 IT & telecom Market Size Estimates and Forecasts to 2032 (USD Billion)

9.9 Others

9.9.1 Others Market Trends Analysis (2020-2032)

9.9.2 Others Market Size Estimates and Forecasts to 2032 (USD Billion)

10. Regional Analysis

10.1 Chapter Overview

10.2 North America

10.2.1 Trends Analysis

10.2.2 North America Intelligent Platform Management Interface (IPMI) Market Estimates and Forecasts, by Country (2020-2032) (USD Billion)

10.2.3 North America Intelligent Platform Management Interface (IPMI) Market Estimates and Forecasts, by Component  (2020-2032) (USD Billion) 

10.2.4 North America Intelligent Platform Management Interface (IPMI) Market Estimates and Forecasts, by Application  (2020-2032) (USD Billion)

10.2.5 North America Intelligent Platform Management Interface (IPMI) Market Estimates and Forecasts, by Verticals  (2020-2032) (USD Billion)

10.2.6 USA

10.2.6.1 USA Intelligent Platform Management Interface (IPMI) Market Estimates and Forecasts, by Component  (2020-2032) (USD Billion)

10.2.6.2 USA Intelligent Platform Management Interface (IPMI) Market Estimates and Forecasts, by Application  (2020-2032) (USD Billion)

10.2.6.3 USA Intelligent Platform Management Interface (IPMI) Market Estimates and Forecasts, by Verticals  (2020-2032) (USD Billion)

10.2.7 Canada

10.2.7.1 Canada Intelligent Platform Management Interface (IPMI) Market Estimates and Forecasts, by Component  (2020-2032) (USD Billion)

10.2.7.2 Canada Intelligent Platform Management Interface (IPMI) Market Estimates and Forecasts, by Application  (2020-2032) (USD Billion)

10.2.7.3 Canada Intelligent Platform Management Interface (IPMI) Market Estimates and Forecasts, by Verticals  (2020-2032) (USD Billion)

10.2.8 Mexico

10.2.8.1 Mexico Intelligent Platform Management Interface (IPMI) Market Estimates and Forecasts, by Component  (2020-2032) (USD Billion)

10.2.8.2 Mexico Intelligent Platform Management Interface (IPMI) Market Estimates and Forecasts, by Application  (2020-2032) (USD Billion)

10.2.8.3 Mexico Intelligent Platform Management Interface (IPMI) Market Estimates and Forecasts, by Verticals  (2020-2032) (USD Billion)

10.3 Europe

10.3.1 Eastern Europe

10.3.1.1 Trends Analysis

10.3.1.2 Eastern Europe Intelligent Platform Management Interface (IPMI) Market Estimates and Forecasts, by Country (2020-2032) (USD Billion)

10.3.1.3 Eastern Europe Intelligent Platform Management Interface (IPMI) Market Estimates and Forecasts, by Component  (2020-2032) (USD Billion) 

10.3.1.4 Eastern Europe Intelligent Platform Management Interface (IPMI) Market Estimates and Forecasts, by Application  (2020-2032) (USD Billion)

10.3.1.5 Eastern Europe Intelligent Platform Management Interface (IPMI) Market Estimates and Forecasts, by Verticals  (2020-2032) (USD Billion)

10.3.1.6 Poland

10.3.1.6.1 Poland Intelligent Platform Management Interface (IPMI) Market Estimates and Forecasts, by Component  (2020-2032) (USD Billion)

10.3.1.6.2 Poland Intelligent Platform Management Interface (IPMI) Market Estimates and Forecasts, by Application  (2020-2032) (USD Billion)

10.3.1.6.3 Poland Intelligent Platform Management Interface (IPMI) Market Estimates and Forecasts, by Verticals  (2020-2032) (USD Billion)

10.3.1.7 Romania

10.3.1.7.1 Romania Intelligent Platform Management Interface (IPMI) Market Estimates and Forecasts, by Component  (2020-2032) (USD Billion)

10.3.1.7.2 Romania Intelligent Platform Management Interface (IPMI) Market Estimates and Forecasts, by Application  (2020-2032) (USD Billion)

10.3.1.7.3 Romania Intelligent Platform Management Interface (IPMI) Market Estimates and Forecasts, by Verticals  (2020-2032) (USD Billion)

10.3.1.8 Hungary

10.3.1.8.1 Hungary Intelligent Platform Management Interface (IPMI) Market Estimates and Forecasts, by Component  (2020-2032) (USD Billion)

10.3.1.8.2 Hungary Intelligent Platform Management Interface (IPMI) Market Estimates and Forecasts, by Application  (2020-2032) (USD Billion)

10.3.1.8.3 Hungary Intelligent Platform Management Interface (IPMI) Market Estimates and Forecasts, by Verticals  (2020-2032) (USD Billion)

10.3.1.9 Turkey

10.3.1.9.1 Turkey Intelligent Platform Management Interface (IPMI) Market Estimates and Forecasts, by Component  (2020-2032) (USD Billion)

10.3.1.9.2 Turkey Intelligent Platform Management Interface (IPMI) Market Estimates and Forecasts, by Application  (2020-2032) (USD Billion)

10.3.1.9.3 Turkey Intelligent Platform Management Interface (IPMI) Market Estimates and Forecasts, by Verticals  (2020-2032) (USD Billion)

10.3.1.10 Rest of Eastern Europe

10.3.1.10.1 Rest of Eastern Europe Intelligent Platform Management Interface (IPMI) Market Estimates and Forecasts, by Component  (2020-2032) (USD Billion)

10.3.1.10.2 Rest of Eastern Europe Intelligent Platform Management Interface (IPMI) Market Estimates and Forecasts, by Application  (2020-2032) (USD Billion)

10.3.1.10.3 Rest of Eastern Europe Intelligent Platform Management Interface (IPMI) Market Estimates and Forecasts, by Verticals  (2020-2032) (USD Billion)

10.3.2 Western Europe

10.3.2.1 Trends Analysis

10.3.2.2 Western Europe Intelligent Platform Management Interface (IPMI) Market Estimates and Forecasts, by Country (2020-2032) (USD Billion)

10.3.2.3 Western Europe Intelligent Platform Management Interface (IPMI) Market Estimates and Forecasts, by Component  (2020-2032) (USD Billion) 

10.3.2.4 Western Europe Intelligent Platform Management Interface (IPMI) Market Estimates and Forecasts, by Application  (2020-2032) (USD Billion)

10.3.2.5 Western Europe Intelligent Platform Management Interface (IPMI) Market Estimates and Forecasts, by Verticals  (2020-2032) (USD Billion)

10.3.2.6 Germany

10.3.2.6.1 Germany Intelligent Platform Management Interface (IPMI) Market Estimates and Forecasts, by Component  (2020-2032) (USD Billion)

10.3.2.6.2 Germany Intelligent Platform Management Interface (IPMI) Market Estimates and Forecasts, by Application  (2020-2032) (USD Billion)

10.3.2.6.3 Germany Intelligent Platform Management Interface (IPMI) Market Estimates and Forecasts, by Verticals  (2020-2032) (USD Billion)

10.3.2.7 France

10.3.2.7.1 France Intelligent Platform Management Interface (IPMI) Market Estimates and Forecasts, by Component  (2020-2032) (USD Billion)

10.3.2.7.2 France Intelligent Platform Management Interface (IPMI) Market Estimates and Forecasts, by Application  (2020-2032) (USD Billion)

10.3.2.7.3 France Intelligent Platform Management Interface (IPMI) Market Estimates and Forecasts, by Verticals  (2020-2032) (USD Billion)

10.3.2.8 UK

10.3.2.8.1 UK Intelligent Platform Management Interface (IPMI) Market Estimates and Forecasts, by Component  (2020-2032) (USD Billion)

10.3.2.8.2 UK Intelligent Platform Management Interface (IPMI) Market Estimates and Forecasts, by Application  (2020-2032) (USD Billion)

10.3.2.8.3 UK Intelligent Platform Management Interface (IPMI) Market Estimates and Forecasts, by Verticals  (2020-2032) (USD Billion)

10.3.2.9 Italy

10.3.2.9.1 Italy Intelligent Platform Management Interface (IPMI) Market Estimates and Forecasts, by Component  (2020-2032) (USD Billion)

10.3.2.9.2 Italy Intelligent Platform Management Interface (IPMI) Market Estimates and Forecasts, by Application  (2020-2032) (USD Billion)

10.3.2.9.3 Italy Intelligent Platform Management Interface (IPMI) Market Estimates and Forecasts, by Verticals  (2020-2032) (USD Billion)

10.3.2.10 Spain

10.3.2.10.1 Spain Intelligent Platform Management Interface (IPMI) Market Estimates and Forecasts, by Component  (2020-2032) (USD Billion)

10.3.2.10.2 Spain Intelligent Platform Management Interface (IPMI) Market Estimates and Forecasts, by Application  (2020-2032) (USD Billion)

10.3.2.10.3 Spain Intelligent Platform Management Interface (IPMI) Market Estimates and Forecasts, by Verticals  (2020-2032) (USD Billion)

10.3.2.11 Netherlands

10.3.2.11.1 Netherlands Intelligent Platform Management Interface (IPMI) Market Estimates and Forecasts, by Component  (2020-2032) (USD Billion)

10.3.2.11.2 Netherlands Intelligent Platform Management Interface (IPMI) Market Estimates and Forecasts, by Application  (2020-2032) (USD Billion)

10.3.2.11.3 Netherlands Intelligent Platform Management Interface (IPMI) Market Estimates and Forecasts, by Verticals  (2020-2032) (USD Billion)

10.3.2.12 Switzerland

10.3.2.12.1 Switzerland Intelligent Platform Management Interface (IPMI) Market Estimates and Forecasts, by Component  (2020-2032) (USD Billion)

10.3.2.12.2 Switzerland Intelligent Platform Management Interface (IPMI) Market Estimates and Forecasts, by Application  (2020-2032) (USD Billion)

10.3.2.12.3 Switzerland Intelligent Platform Management Interface (IPMI) Market Estimates and Forecasts, by Verticals  (2020-2032) (USD Billion)

10.3.2.13 Austria

10.3.2.13.1 Austria Intelligent Platform Management Interface (IPMI) Market Estimates and Forecasts, by Component  (2020-2032) (USD Billion)

10.3.2.13.2 Austria Intelligent Platform Management Interface (IPMI) Market Estimates and Forecasts, by Application  (2020-2032) (USD Billion)

10.3.2.13.3 Austria Intelligent Platform Management Interface (IPMI) Market Estimates and Forecasts, by Verticals  (2020-2032) (USD Billion)

10.3.2.14 Rest of Western Europe

10.3.2.14.1 Rest of Western Europe Intelligent Platform Management Interface (IPMI) Market Estimates and Forecasts, by Component  (2020-2032) (USD Billion)

10.3.2.14.2 Rest of Western Europe Intelligent Platform Management Interface (IPMI) Market Estimates and Forecasts, by Application  (2020-2032) (USD Billion)

10.3.2.14.3 Rest of Western Europe Intelligent Platform Management Interface (IPMI) Market Estimates and Forecasts, by Verticals  (2020-2032) (USD Billion)

10.4 Asia Pacific

10.4.1 Trends Analysis

10.4.2 Asia Pacific Intelligent Platform Management Interface (IPMI) Market Estimates and Forecasts, by Country (2020-2032) (USD Billion)

10.4.3 Asia Pacific Intelligent Platform Management Interface (IPMI) Market Estimates and Forecasts, by Component  (2020-2032) (USD Billion) 

10.4.4 Asia Pacific Intelligent Platform Management Interface (IPMI) Market Estimates and Forecasts, by Application  (2020-2032) (USD Billion)

10.4.5 Asia Pacific Intelligent Platform Management Interface (IPMI) Market Estimates and Forecasts, by Verticals  (2020-2032) (USD Billion)

10.4.6 China

10.4.6.1 China Intelligent Platform Management Interface (IPMI) Market Estimates and Forecasts, by Component  (2020-2032) (USD Billion)

10.4.6.2 China Intelligent Platform Management Interface (IPMI) Market Estimates and Forecasts, by Application  (2020-2032) (USD Billion)

10.4.6.3 China Intelligent Platform Management Interface (IPMI) Market Estimates and Forecasts, by Verticals  (2020-2032) (USD Billion)

10.4.7 India

10.4.7.1 India Intelligent Platform Management Interface (IPMI) Market Estimates and Forecasts, by Component  (2020-2032) (USD Billion)

10.4.7.2 India Intelligent Platform Management Interface (IPMI) Market Estimates and Forecasts, by Application  (2020-2032) (USD Billion)

10.4.7.3 India Intelligent Platform Management Interface (IPMI) Market Estimates and Forecasts, by Verticals  (2020-2032) (USD Billion)

10.4.8 Japan

10.4.8.1 Japan Intelligent Platform Management Interface (IPMI) Market Estimates and Forecasts, by Component  (2020-2032) (USD Billion)

10.4.8.2 Japan Intelligent Platform Management Interface (IPMI) Market Estimates and Forecasts, by Application  (2020-2032) (USD Billion)

10.4.8.3 Japan Intelligent Platform Management Interface (IPMI) Market Estimates and Forecasts, by Verticals  (2020-2032) (USD Billion)

10.4.9 South Korea

10.4.9.1 South Korea Intelligent Platform Management Interface (IPMI) Market Estimates and Forecasts, by Component  (2020-2032) (USD Billion)

10.4.9.2 South Korea Intelligent Platform Management Interface (IPMI) Market Estimates and Forecasts, by Application  (2020-2032) (USD Billion)

10.4.9.3 South Korea Intelligent Platform Management Interface (IPMI) Market Estimates and Forecasts, by Verticals  (2020-2032) (USD Billion)

10.4.10 Vietnam

10.4.10.1 Vietnam Intelligent Platform Management Interface (IPMI) Market Estimates and Forecasts, by Component  (2020-2032) (USD Billion)

10.4.10.2 Vietnam Intelligent Platform Management Interface (IPMI) Market Estimates and Forecasts, by Application  (2020-2032) (USD Billion)

10.4.10.3 Vietnam Intelligent Platform Management Interface (IPMI) Market Estimates and Forecasts, by Verticals  (2020-2032) (USD Billion)

10.4.11 Singapore

10.4.11.1 Singapore Intelligent Platform Management Interface (IPMI) Market Estimates and Forecasts, by Component  (2020-2032) (USD Billion)

10.4.11.2 Singapore Intelligent Platform Management Interface (IPMI) Market Estimates and Forecasts, by Application  (2020-2032) (USD Billion)

10.4.11.3 Singapore Intelligent Platform Management Interface (IPMI) Market Estimates and Forecasts, by Verticals  (2020-2032) (USD Billion)

10.4.12 Australia

10.4.12.1 Australia Intelligent Platform Management Interface (IPMI) Market Estimates and Forecasts, by Component  (2020-2032) (USD Billion)

10.4.12.2 Australia Intelligent Platform Management Interface (IPMI) Market Estimates and Forecasts, by Application  (2020-2032) (USD Billion)

10.4.12.3 Australia Intelligent Platform Management Interface (IPMI) Market Estimates and Forecasts, by Verticals  (2020-2032) (USD Billion)

10.4.13 Rest of Asia Pacific

10.4.13.1 Rest of Asia Pacific Intelligent Platform Management Interface (IPMI) Market Estimates and Forecasts, by Component  (2020-2032) (USD Billion)

10.4.13.2 Rest of Asia Pacific Intelligent Platform Management Interface (IPMI) Market Estimates and Forecasts, by Application  (2020-2032) (USD Billion)

10.4.13.3 Rest of Asia Pacific Intelligent Platform Management Interface (IPMI) Market Estimates and Forecasts, by Verticals  (2020-2032) (USD Billion)

10.5 Middle East and Africa

10.5.1 Middle East

10.5.1.1 Trends Analysis

10.5.1.2 Middle East Intelligent Platform Management Interface (IPMI) Market Estimates and Forecasts, by Country (2020-2032) (USD Billion)

10.5.1.3 Middle East Intelligent Platform Management Interface (IPMI) Market Estimates and Forecasts, by Component  (2020-2032) (USD Billion) 

10.5.1.4 Middle East Intelligent Platform Management Interface (IPMI) Market Estimates and Forecasts, by Application  (2020-2032) (USD Billion)

10.5.1.5 Middle East Intelligent Platform Management Interface (IPMI) Market Estimates and Forecasts, by Verticals  (2020-2032) (USD Billion)

10.5.1.6 UAE

10.5.1.6.1 UAE Intelligent Platform Management Interface (IPMI) Market Estimates and Forecasts, by Component  (2020-2032) (USD Billion)

10.5.1.6.2 UAE Intelligent Platform Management Interface (IPMI) Market Estimates and Forecasts, by Application  (2020-2032) (USD Billion)

10.5.1.6.3 UAE Intelligent Platform Management Interface (IPMI) Market Estimates and Forecasts, by Verticals  (2020-2032) (USD Billion)

10.5.1.7 Egypt

10.5.1.7.1 Egypt Intelligent Platform Management Interface (IPMI) Market Estimates and Forecasts, by Component  (2020-2032) (USD Billion)

10.5.1.7.2 Egypt Intelligent Platform Management Interface (IPMI) Market Estimates and Forecasts, by Application  (2020-2032) (USD Billion)

10.5.1.7.3 Egypt Intelligent Platform Management Interface (IPMI) Market Estimates and Forecasts, by Verticals  (2020-2032) (USD Billion)

10.5.1.8 Saudi Arabia

10.5.1.8.1 Saudi Arabia Intelligent Platform Management Interface (IPMI) Market Estimates and Forecasts, by Component  (2020-2032) (USD Billion)

10.5.1.8.2 Saudi Arabia Intelligent Platform Management Interface (IPMI) Market Estimates and Forecasts, by Application  (2020-2032) (USD Billion)

10.5.1.8.3 Saudi Arabia Intelligent Platform Management Interface (IPMI) Market Estimates and Forecasts, by Verticals  (2020-2032) (USD Billion)

10.5.1.9 Qatar

10.5.1.9.1 Qatar Intelligent Platform Management Interface (IPMI) Market Estimates and Forecasts, by Component  (2020-2032) (USD Billion)

10.5.1.9.2 Qatar Intelligent Platform Management Interface (IPMI) Market Estimates and Forecasts, by Application  (2020-2032) (USD Billion)

10.5.1.9.3 Qatar Intelligent Platform Management Interface (IPMI) Market Estimates and Forecasts, by Verticals  (2020-2032) (USD Billion)

10.5.1.10 Rest of Middle East

10.5.1.10.1 Rest of Middle East Intelligent Platform Management Interface (IPMI) Market Estimates and Forecasts, by Component  (2020-2032) (USD Billion)

10.5.1.10.2 Rest of Middle East Intelligent Platform Management Interface (IPMI) Market Estimates and Forecasts, by Application  (2020-2032) (USD Billion)

10.5.1.10.3 Rest of Middle East Intelligent Platform Management Interface (IPMI) Market Estimates and Forecasts, by Verticals  (2020-2032) (USD Billion)

10.5.2 Africa

10.5.2.1 Trends Analysis

10.5.2.2 Africa Intelligent Platform Management Interface (IPMI) Market Estimates and Forecasts, by Country (2020-2032) (USD Billion)

10.5.2.3 Africa Intelligent Platform Management Interface (IPMI) Market Estimates and Forecasts, by Component  (2020-2032) (USD Billion) 

10.5.2.4 Africa Intelligent Platform Management Interface (IPMI) Market Estimates and Forecasts, by Application  (2020-2032) (USD Billion)

10.5.2.5 Africa Intelligent Platform Management Interface (IPMI) Market Estimates and Forecasts, by Verticals  (2020-2032) (USD Billion)

10.5.2.6 South Africa

10.5.2.6.1 South Africa Intelligent Platform Management Interface (IPMI) Market Estimates and Forecasts, by Component  (2020-2032) (USD Billion)

10.5.2.6.2 South Africa Intelligent Platform Management Interface (IPMI) Market Estimates and Forecasts, by Application  (2020-2032) (USD Billion)

10.5.2.6.3 South Africa Intelligent Platform Management Interface (IPMI) Market Estimates and Forecasts, by Verticals  (2020-2032) (USD Billion)

10.5.2.7 Nigeria

10.5.2.7.1 Nigeria Intelligent Platform Management Interface (IPMI) Market Estimates and Forecasts, by Component  (2020-2032) (USD Billion)

10.5.2.7.2 Nigeria Intelligent Platform Management Interface (IPMI) Market Estimates and Forecasts, by Application  (2020-2032) (USD Billion)

10.5.2.7.3 Nigeria Intelligent Platform Management Interface (IPMI) Market Estimates and Forecasts, by Verticals  (2020-2032) (USD Billion)

10.5.2.8 Rest of Africa

10.5.2.8.1 Rest of Africa Intelligent Platform Management Interface (IPMI) Market Estimates and Forecasts, by Component  (2020-2032) (USD Billion)

10.5.2.8.2 Rest of Africa Intelligent Platform Management Interface (IPMI) Market Estimates and Forecasts, by Application  (2020-2032) (USD Billion)

10.5.2.8.3 Rest of Africa Intelligent Platform Management Interface (IPMI) Market Estimates and Forecasts, by Verticals  (2020-2032) (USD Billion)

10.6 Latin America

10.6.1 Trends Analysis

10.6.2 Latin America Intelligent Platform Management Interface (IPMI) Market Estimates and Forecasts, by Country (2020-2032) (USD Billion)

10.6.3 Latin America Intelligent Platform Management Interface (IPMI) Market Estimates and Forecasts, by Component  (2020-2032) (USD Billion) 

10.6.4 Latin America Intelligent Platform Management Interface (IPMI) Market Estimates and Forecasts, by Application  (2020-2032) (USD Billion)

10.6.5 Latin America Intelligent Platform Management Interface (IPMI) Market Estimates and Forecasts, by Verticals  (2020-2032) (USD Billion)

10.6.6 Brazil

10.6.6.1 Brazil Intelligent Platform Management Interface (IPMI) Market Estimates and Forecasts, by Component  (2020-2032) (USD Billion)

10.6.6.2 Brazil Intelligent Platform Management Interface (IPMI) Market Estimates and Forecasts, by Application  (2020-2032) (USD Billion)

10.6.6.3 Brazil Intelligent Platform Management Interface (IPMI) Market Estimates and Forecasts, by Verticals  (2020-2032) (USD Billion)

10.6.7 Argentina

10.6.7.1 Argentina Intelligent Platform Management Interface (IPMI) Market Estimates and Forecasts, by Component  (2020-2032) (USD Billion)

10.6.7.2 Argentina Intelligent Platform Management Interface (IPMI) Market Estimates and Forecasts, by Application  (2020-2032) (USD Billion)

10.6.7.3 Argentina Intelligent Platform Management Interface (IPMI) Market Estimates and Forecasts, by Verticals  (2020-2032) (USD Billion)

10.6.8 Colombia

10.6.8.1 Colombia Intelligent Platform Management Interface (IPMI) Market Estimates and Forecasts, by Component  (2020-2032) (USD Billion)

10.6.8.2 Colombia Intelligent Platform Management Interface (IPMI) Market Estimates and Forecasts, by Application  (2020-2032) (USD Billion)

10.6.8.3 Colombia Intelligent Platform Management Interface (IPMI) Market Estimates and Forecasts, by Verticals  (2020-2032) (USD Billion)

10.6.9 Rest of Latin America

10.6.9.1 Rest of Latin America Intelligent Platform Management Interface (IPMI) Market Estimates and Forecasts, by Component  (2020-2032) (USD Billion)

10.6.9.2 Rest of Latin America Intelligent Platform Management Interface (IPMI) Market Estimates and Forecasts, by Application  (2020-2032) (USD Billion)

10.6.9.3 Rest of Latin America Intelligent Platform Management Interface (IPMI) Market Estimates and Forecasts, by Verticals  (2020-2032) (USD Billion)

11. Company Profiles

11.1 Intel Corporation

11.1.1 Company Overview

11.1.2 Financial

11.1.3 Products/ Services Offered

11.1.4 SWOT Analysis

11.2 RM Holdings Inc.

11.2.1 Company Overview

11.2.2 Financial

11.2.3 Products/ Services Offered

11.2.4 SWOT Analysis

11.3 Emerson

11.3.1 Company Overview

11.3.2 Financial

11.3.3 Products/ Services Offered

11.3.4 SWOT Analysis

11.4 NEC Corporation

11.4.1 Company Overview

11.4.2 Financial

11.4.3 Products/ Services Offered

11.4.4 SWOT Analysis

11.5 Super Micro Computer, Inc.

11.5.1 Company Overview

11.5.2 Financial

11.5.3 Products/ Services Offered

11.5.4 SWOT Analysis

11.6 Cisco

11.6.1 Company Overview

11.6.2 Financial

11.6.3 Products/ Services Offered

11.6.4 SWOT Analysis

11.7 Dell, Inc.

11.7.1 Company Overview

11.7.2 Financial

11.7.3 Products/ Services Offered

11.7.4 SWOT Analysis

11.8 Hewlett Packard Enterprise

11.8.1 Company Overview

11.8.2 Financial

11.8.3 Products/ Services Offered

11.8.4 SWOT Analysis

11.9 Microsoft

11.9.1 Company Overview

11.9.2 Financial

11.9.3 Products/ Services Offered

11.9.4 SWOT Analysis

11.10 Softlayer Technologies, Inc.

11.10.1 Company Overview

11.10.2 Financial

11.10.3 Products/ Services Offered

11.10.4 SWOT Analysis

12. Use Cases and Best Practices

13. Conclusion

An accurate research report requires proper strategizing as well as implementation. There are multiple factors involved in the completion of good and accurate research report and selecting the best methodology to compete the research is the toughest part. Since the research reports we provide play a crucial role in any company’s decision-making process, therefore we at SNS Insider always believe that we should choose the best method which gives us results closer to reality. This allows us to reach at a stage wherein we can provide our clients best and accurate investment to output ratio.

Each report that we prepare takes a timeframe of 350-400 business hours for production. Starting from the selection of titles through a couple of in-depth brain storming session to the final QC process before uploading our titles on our website we dedicate around 350 working hours. The titles are selected based on their current market cap and the foreseen CAGR and growth.


The 5 steps process:

Step 1: Secondary Research:

Secondary Research or Desk Research is as the name suggests is a research process wherein, we collect data through the readily available information. In this process we use various paid and unpaid databases which our team has access to and gather data through the same. This includes examining of listed companies’ annual reports, Journals, SEC filling etc. Apart from this our team has access to various associations across the globe across different industries. Lastly, we have exchange relationships with various university as well as individual libraries.

Secondary Research

Step 2: Primary Research

When we talk about primary research, it is a type of study in which the researchers collect relevant data samples directly, rather than relying on previously collected data.  This type of research is focused on gaining content specific facts that can be sued to solve specific problems. Since the collected data is fresh and first hand therefore it makes the study more accurate and genuine.

We at SNS Insider have divided Primary Research into 2 parts.

Part 1 wherein we interview the KOLs of major players as well as the upcoming ones across various geographic regions. This allows us to have their view over the market scenario and acts as an important tool to come closer to the accurate market numbers. As many as 45 paid and unpaid primary interviews are taken from both the demand and supply side of the industry to make sure we land at an accurate judgement and analysis of the market.

This step involves the triangulation of data wherein our team analyses the interview transcripts, online survey responses and observation of on filed participants. The below mentioned chart should give a better understanding of the part 1 of the primary interview.

Primary Research

Part 2: In this part of primary research the data collected via secondary research and the part 1 of the primary research is validated with the interviews from individual consultants and subject matter experts.

Consultants are those set of people who have at least 12 years of experience and expertise within the industry whereas Subject Matter Experts are those with at least 15 years of experience behind their back within the same space. The data with the help of two main processes i.e., FGDs (Focused Group Discussions) and IDs (Individual Discussions). This gives us a 3rd party nonbiased primary view of the market scenario making it a more dependable one while collation of the data pointers.

Step 3: Data Bank Validation

Once all the information is collected via primary and secondary sources, we run that information for data validation. At our intelligence centre our research heads track a lot of information related to the market which includes the quarterly reports, the daily stock prices, and other relevant information. Our data bank server gets updated every fortnight and that is how the information which we collected using our primary and secondary information is revalidated in real time.

Data Bank Validation

Step 4: QA/QC Process

After all the data collection and validation our team does a final level of quality check and quality assurance to get rid of any unwanted or undesired mistakes. This might include but not limited to getting rid of the any typos, duplication of numbers or missing of any important information. The people involved in this process include technical content writers, research heads and graphics people. Once this process is completed the title gets uploader on our platform for our clients to read it.

Step 5: Final QC/QA Process:

This is the last process and comes when the client has ordered the study. In this process a final QA/QC is done before the study is emailed to the client. Since we believe in giving our clients a good experience of our research studies, therefore, to make sure that we do not lack at our end in any way humanly possible we do a final round of quality check and then dispatch the study to the client.

Key Segments:

By Component

  • Baseboard management controller

  • Sensors & controls

  • Memory devices

  • Others

By Application

  • Server

  • Storage devices

  • Telecommunication equipment

By Vertical

  • Banking, Financial services, and Insurance (BFSI)

  • Healthcare

  • Education & research

  • Retail

  • Manufacturing

  • Public sector

  • IT & telecom

  • Others

Request for Segment Customization as per your Business Requirement: Segment Customization Request

Regional Coverage:

North America

  • US

  • Canada

  • Mexico

Europe

  • Eastern Europe

    • Poland

    • Romania

    • Hungary

    • Turkey

    • Rest of Eastern Europe

  • Western Europe

    • Germany

    • France

    • UK

    • Italy

    • Spain

    • Netherlands

    • Switzerland

    • Austria

    • Rest of Western Europe

Asia Pacific

  • China

  • India

  • Japan

  • South Korea

  • Vietnam

  • Singapore

  • Australia

  • Rest of Asia Pacific

Middle East & Africa

  • Middle East

    • UAE

    • Egypt

    • Saudi Arabia

    • Qatar

    • Rest of Middle East

  • Africa

    • Nigeria

    • South Africa

    • Rest of Africa

Latin America

  • Brazil

  • Argentina

  • Colombia

  • Rest of Latin America

Request for Country Level Research Report: Country Level Customization Request

Available Customization

With the given market data, SNS Insider offers customization as per the company’s specific needs. The following customization options are available for the report:

  • Detailed Volume Analysis

  • Criss-Cross segment analysis (e.g. Product X Application)

  • Competitive Product Benchmarking

  • Geographic Analysis

  • Additional countries in any of the regions

  • Customized Data Representation

  • Detailed analysis and profiling of additional market players


  •            5000 (33% Discount)


  •            8950 (40% Discount)


  •            3050 (23% Discount)

Start a Conversation

Hi! Click one of our member below to chat on Phone