Integrated Pest Management Pheromones Market Report Scope & Overview:
Get more information on Integrated Pest Management Pheromones Market - Request Sample Report
The Integrated Pest Management Pheromones market size was USD 1060.74 Million in 2024 and is expected to reach USD 2104.31 Million by 2032 and grow at a CAGR of 8.94 % over the forecast period of 2025-2032. The report provides key insights into production capacity and utilization across countries, highlighting regional manufacturing trends. It examines price trends of pheromone-based products by type and country, offering a comparative cost analysis. The report evaluates the regulatory impact of government policies on pheromone adoption and pesticide restrictions. It also assesses adoption rates of IPM pheromones by region, tracking their market penetration in agriculture and pest control. Environmental impact metrics are analyzed, showcasing reductions in chemical pesticide use and biodiversity benefits. Additionally, the report highlights innovation and R&D investments, detailing advancements in pheromone formulations. This data-driven analysis provides a comprehensive outlook on market growth, regulatory influences, and technological progress.
Market Size and Forecast:
-
Market Size in 2024 USD 1060.74 Million
-
Market Size by 2032 USD 2104.31 Million
-
CAGR of 8.94% From 2025 to 2032
-
Base Year 2024
-
Forecast Period 2025-2032
-
Historical Data 2021-2023
Integrated Pest Management Pheromones Market Trends:
-
Rising adoption of organic farming practices driving demand for non-chemical, eco-friendly pest management solutions.
-
Increasing investment in R&D for advanced pheromone formulations to support sustainable agriculture.
-
Development of automated dispensing and releasing mechanisms for precise pheromone delivery.
-
Improved cost efficiency through reduced material and labor requirements, enhancing farmer adoption.
-
Growing preference for pheromones over chemical pesticides due to sustainability and effectiveness in diverse agricultural settings.
Integrated Pest Management Pheromones Market Growth Drivers:
-
Growth in organic farming practices driving the need for non-chemical pest management which drives market growth.
One of the key drivers behind the growth of the demand for non-chemical pest management solutions is the rising adoption of organic farming practices. With consumers wanting pesticide-free, sustainably grown produce, organic farmers are driven to find alternatives to conventional chemical pesticides. These are the best environment-friendly pest control method that aims to disrupt pest mating patterns without affecting friendly organisms or the environment itself. This aligns with organic certification standards but it also opens the door for greater investment in research and development of advanced pheromone formulations. This in turn drives market growth for IPM pheromones, causing producers and distributors to increase their offerings in order to meet the increasing demand for natural pest control methods.
Integrated Pest Management Pheromones Market Restraints:
-
Technical challenges in ensuring product stability and effective field delivery restrain performance.
This poses immense technical challenges to product stability and field delivery. These pheromone compounds tend to be very sensitive to temperature variations, humidity levels, and ultraviolet light, all of which can cause the pheromone to break down and lose biological activity quickly. The degradation not only has effects on the pest attraction or repellent but may require those materials to be specially formulated and protected. Furthermore, to use these products in the field, sophisticated delivery systems are needed to modulate release in a sustained and controlled manner. Addressing these challenges frequently requires substantial R&D, which raises production expenses and can ultimately restrict pervasiveness in the marketplace.
Integrated Pest Management Pheromones Market Opportunities:
-
Technological innovations in application and delivery systems improving overall cost-effectiveness create an opportunity in the market.
Technological milestones have been achieved, reaching advanced delivery devices and automated dispensing and releasing mechanisms to accurately and precisely dispense pheromones in order to limit the needless use of pheromones and optimize the use of products. Such modifications bring down the cost of material and labor while ensuring the active components are conveyed appropriately to the place of action for maximizing effectiveness. Consequently, more effective and efficient pest management solutions can be delivered that are less costly to the farmer and the pest control operator. This higher cost efficiency not only enhances the attractiveness of pheromones in comparison to chemical pesticides but also facilitates the adoption of pheromones across various agricultural settings, leading to high market potential.
Integrated Pest Management Pheromones Market Segment Analysis:
By Product
Sex Pheromones held the largest market share around 52% in 2024. This is owing to their high functionality in disrupting pest mating behavior. These pheromones are designed to look like the natural chemical signals that attract insects, disrupting their ability to mate and effectively reducing pest populations without utilizing chemical pesticides. This specificity reduces any potential collateral damage to other, beneficial organisms and the environment overall, in line with sustainable agriculture and regulatory requests. In addition, the formulation technology has contributed to the stability of low doses and reliable field delivery of sex pheromones, allowing for a reliable and efficient option for pest management for farmers and pest management professionals. The synergy between these components improved effectiveness, safety to the environment, and strong regulatory support has led to the widespread use and long-term market reach of sex pheromones as pest control agents.
By Mode of application
Mating disruption held the largest market share around 38% in 2024. It is owing to its high-efficiency nature in controlling pest populations avoiding traditional chemical pesticides. This method works by inundating the crop habitat with synthetic pheromones, effectively confusing males and blocking their ability to find females, thus bringing down reproduction numbers. By minimizing undesired effects on non-target organisms and the environment, this method provides a lasting, site-restricted, and environmentally friendly management alternative. Its cost-effectiveness after years of application, along with increasing regulatory support for practices that avoid environmentally hazardous pest control, led to widespread adoption among growers and pest management professionals.
By Application
Agriculture held the largest market share around 78% in 2024. A as the agriculture sector is the most affected sector due to losses in crops caused by pests. As the scale of cultivation grows, the yield-linked economic stakes of the nutritional products coerce groups to result in a greater share of pest-control techniques to hinder pests. IPM pheromones are a targeted solution that disrupts pest mating behaviors, lowering infestation levels without the negative adverse effects seen from traditional pesticides. Not only does this method help safeguard crops, but it also allows farmers to carry out sustainable farming practices that meet strict environmental and regulatory guidelines. Moreover, the use of pheromone applications in large-scale agricultural fields enhances the scalability which enables high acceptance of technology further strengthening the position of the agriculture industry in the market.
Integrated Pest Management Pheromones Market Regional Analysis:
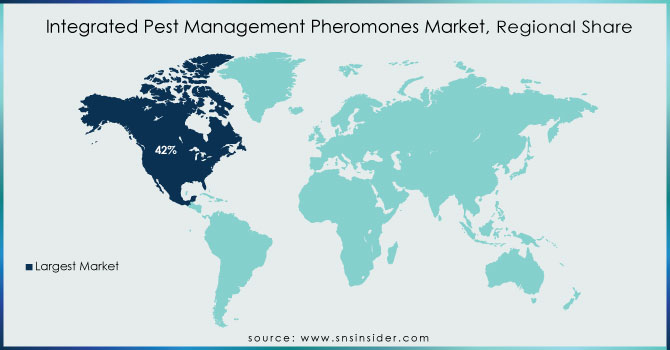
North America Integrated Pest Management Pheromones Market Insights
North America held the largest market share around 42% in 2024. It is attributed to its establishment region for advanced agriculture practices, large number of research and development sectors, and regulatory supportive environment for IPM-based products. High technology adoption rates and a strong focus on sustainable farming combine to accelerate the adoption of green pest control solutions in the region. In addition, government policies and incentives supporting sustainable agriculture, coupled with large investments in innovative IPM strategies, have spurred market growth even further. The convergence of such factors has propelled North America to become a frontrunner in the adoption and progression in the adoption of pheromones for use in pest management; thereby securing a significant share of the global market.
Asia Pacific Integrated Pest Management Pheromones Market Insights
Asia Pacific held a significant market share in 2024. A large portion of the Integrated Pest Management (IPM)pheromones market has been captured by Asia Pacific due to the presence of a large and dynamic agricultural sector, growing concerns regarding the environment and changing regulation processes. Pheromone-based pest management solutions are gaining valuation in the region, as efforts to preserve large-scale crop production by protecting it from pest infestation are fueling extensive agricultural activities. Similarly, government policies and subsidies advocating sustainable agriculture coupled with rising investment in research and development have helped the switch from traditional pesticides to more specific IPM approaches. The result of strong agri-demand, supportive regulatory frameworks, and innovation has made Asia Pacific an essential market.
Europe Integrated Pest Management Pheromones Market Insights
Europe’s integrated pest management pheromones market is expanding due to strict environmental regulations, high adoption of organic farming, and consumer demand for pesticide-free produce. The European Union’s sustainability initiatives and funding for eco-friendly agriculture further accelerate market growth. Strong presence of leading manufacturers and ongoing R&D activities enhance the region’s role as a key innovator in pheromone-based pest control.
Latin America (LATAM) and Middle East & Africa (MEA) Integrated Pest Management Pheromones Market Insights
The LATAM and MEA markets for integrated pest management pheromones are growing steadily, driven by agricultural expansion, rising export demands, and government support for sustainable practices. In Latin America, countries like Brazil and Mexico are adopting pheromones to protect key crops. Meanwhile, Middle Eastern and African nations focus on reducing chemical pesticide reliance and promoting eco-friendly farming practices.
Get Customized Report as per your Business Requirement - Request For Customized Report
Integrated Pest Management Pheromones Market Key Players:
-
Active IPM (IPM PheroX, IPM PheroGuard)
-
Atlas Agro (AgroLure, AgroDisrupt)
-
AgrichemBio (AgriPhero, BioLure)
-
Laboratorio Agrochem S.L. (AgroChem Phero, BioControl Phero)
-
ATGC Biotech (ATGC PheroMax, ATGC LurePro)
-
Russell IPM (Russell PheroShield, Russell MateBlock)
-
Hercon Environmental Corporation (Hercon PheroTech, Hercon EcoLure)
-
AgriSense-BCS Ltd. (AgriSense PheroSmart, AgriSense MateGuard)
-
SemiosBIO Technologies (Semios PheroInsight, Semios Disruptor)
-
Shin-Etsu (Shin PheroLure, Shin MateLock)
-
Sumi Agro France (Sumi PheroActive, Sumi DisruptX)
-
Syngenta Bioline Ltd. (Syngenta PheroSecure, Syngenta MateStop)
-
Trece, Inc. (PheroControl, LureMax)
-
BASF (BASF PheroPlus, BASF MateGuard)
-
Bayer CropScience (Bayer PheroLink, Bayer DisruptX)
-
Corteva Agriscience (Corteva PheroAdvance, Corteva MateStop)
-
Dow AgroSciences (Dow PheroShield, Dow MateBlock)
-
Koppert Biological Systems (Koppert BioPhero, Koppert LureGuard)
-
Sumitomo Chemical (Sumitomo PheroFusion, Sumitomo EcoMate)
-
FMC Corporation (FMC PheroControl, FMC LureMax)
Competitive Landscape for Integrated Pest Management Pheromones Market:
Russell IPM is a leading provider of integrated pest management solutions, specializing in pheromone-based products that disrupt pest mating patterns. Its portfolio includes innovative pheromone dispensers and monitoring systems designed for sustainable agriculture. By offering eco-friendly alternatives to chemical pesticides, Russell IPM supports organic farming, enhances crop protection, and drives adoption of efficient, environmentally responsible pest management practices in the global IPM pheromones market.
-
In 2023, Russell IPM introduced a cutting-edge digital monitoring platform to integrate real-time data analytics into pest management. The platform employs advanced sensors and IoT connectivity to continuously track pest activity and environmental conditions.
Koppert Biological Systems is a global leader in integrated pest management, offering pheromone-based solutions and biological control products. The company focuses on sustainable agriculture by providing eco-friendly pest disruption technologies that reduce chemical pesticide use. Its advanced pheromone dispensers and monitoring systems help optimize crop protection, improve yield quality, and support the growing adoption of environmentally responsible practices in the global IPM pheromones market.
-
In 2023, Koppert Biological Systems expanded its portfolio with innovative pheromone products. These new products enhance the detection and monitoring of pest activity across diverse agricultural environments.
| Report Attributes | Details |
|---|---|
| Market Size in 2024 | USD 1060.74 Million |
| Market Size by 2032 | USD 2104.31 Million |
| CAGR | CAGR of 8.94% From 2025 to 2032 |
| Base Year | 2024 |
| Forecast Period | 2025-2032 |
| Historical Data | 2021-2023 |
| Report Scope & Coverage | Market Size, Segments Analysis, Competitive Landscape, Regional Analysis, DROC & SWOT Analysis, Forecast Outlook |
| Key Segments | • By Product (Sex Pheromones, Aggregation Pheromones, Alarm Pheromones, Others) • By Mode of Application (Monitoring & Detection, Mating Disruption, Mass Trapping, Others), • By Application (Agriculture, Others) |
| Regional Analysis/Coverage | North America (US, Canada), Europe (Germany, UK, France, Italy, Spain, Russia, Poland, Rest of Europe), Asia Pacific (China, India, Japan, South Korea, Australia, ASEAN Countries, Rest of Asia Pacific), Middle East & Africa (UAE, Saudi Arabia, Qatar, South Africa, Rest of Middle East & Africa), Latin America (Brazil, Argentina, Mexico, Colombia, Rest of Latin America). |
| Company Profiles | Active IPM, Atlas Agro, AgrichemBio, Laboratorio Agrochem S.L., ATGC Biotech, Russell IPM, Hercon Environmental Corporation, AgriSense-BCS Ltd., SemiosBIO Technologies, Shin-Etsu, Sumi Agro France, Syngenta Bioline Ltd., Trécé, Inc., BASF, Bayer CropScience, Corteva Agriscience, Dow AgroSciences, Koppert Biological Systems, Sumitomo Chemical, FMC Corporation |
