Get More Information on Insomnia Therapeutics Market - Request Sample Report
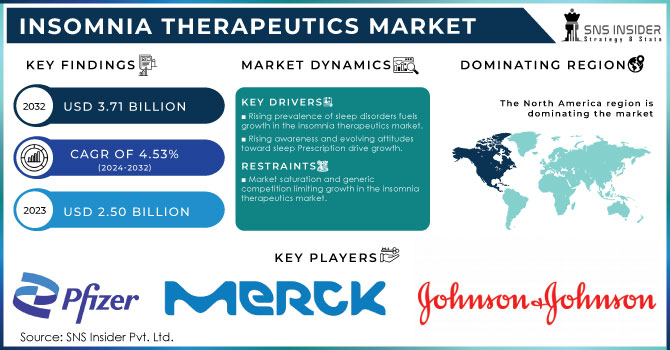
The Insomnia Therapeutics Market size was valued at USD 2.50 Billion in 2023 and is expected to reach USD 3.71 Billion by 2032 and grow at a CAGR of 4.53% over the forecast period 2024-2032.
The insomnia therapeutics market is experiencing significant growth as the global prevalence of insomnia and other sleep disorders continues to rise. This market includes various therapeutic methods such as medications, cognitive behavioral therapy, and upcoming alternative therapies. Medications like sedatives and sleep aids have always been essential in treating insomnia. Commonly used medications such as benzodiazepines and non-benzodiazepine sleep aids are widely utilized for temporary relief. In the United States, benzodiazepines are often recommended for issues such as anxiety, sleeplessness, and seizures; however, there are notable dangers associated with their usage, especially when used alongside opioids. In 2023, around 12.6% of American adults acknowledged using benzodiazepines, while 2.1% confessed to misusing them. Nevertheless, these drugs frequently carry the potential for addiction and adverse reactions, leading researchers to seek out safer and more efficient therapies. Consequently, there is a growing interest in new medications with better safety profiles and mechanisms of action in the market.
Recently, there has been a noticeable change in the use of cognitive behavioral therapy for insomnia (CBT-I). CBT-I is a method that is based on evidence and has a structured approach to address the psychological factors that cause disruptions in sleep. Research shows that Cognitive Behavioral Therapy for Insomnia (CBT-I) is a very successful remedy for chronic insomnia, helping roughly 70-80% of individuals dealing with this issue. Around 10-15% of adults in the U.S. are impacted by chronic insomnia, which is defined as having trouble falling or staying asleep at least three times a week for three months or longer. The price range for CBT-I sessions can be anywhere from USD 100 to USD 200, and although insurance coverage is getting better, it remains uneven. This alternative therapy has become more popular because of its effectiveness over time and few adverse reactions. The increasing availability of telemedicine has made it easier for people who couldn't access traditional therapy to utilize CBT-I.
Market Dynamics
Drivers
Rising prevalence of sleep disorders fuels growth in the insomnia therapeutics market.
The increasing occurrence of insomnia and other sleep disorders is a key factor for the growth of the insomnia therapeutics market. Research shows that a significant number of people around the world experience sleep problems, which range in severity. The increasing prevalence of insomnia is influenced by factors like stress, lifestyle adjustments, and undisclosed Prescription issues. An example of this is the rise in sleep disorders caused by today's high-stress levels and excessive use of screens. Chronic sleeplessness impacts daily activities, mental abilities, and general well-being, leading to a need for efficient treatment options. Pharmaceutical companies and research institutions are making significant investments in creating new drugs and therapies to meet the increasing demand. Emerging drug formulations, such as extended-release and combination therapies, are being developed to improve effectiveness and safety. Furthermore, the growing understanding of how sleep disorders affect mental Prescription and productivity is driving the need for effective insomnia treatments. The increasing number of people suffering from insomnia has led to a rise in demand for sleep aids, both prescription and over-the-counter, which is driving the growth of the market.
Rising awareness and evolving attitudes toward sleep Prescription drive growth.
More and more people are recognizing and embracing mental Prescription concerns like insomnia and sleep disorders. Efforts to raise public awareness, educate, and advocate have helped increase understanding of the significance of sleep Prescription. As societal views on mental Prescription progress, an increasing number of people are seeking assistance for their sleep disorders and are willing to consider different treatment choices. Prescription care providers are increasingly taking a proactive approach to addressing sleep disorders by incorporating sleep Prescription into comprehensive mental Prescription and wellness initiatives. The increasing importance placed on sleep Prescription is creating a need for efficient treatments for insomnia. The reduced stigma around seeking assistance for sleep issues is resulting in more people seeking help and being more open to trying out new treatments. The increase in societal attitudes is driving the expansion of the insomnia therapeutics market.
Restraints
Market saturation and generic competition limit growth in the insomnia therapeutics market.
The insomnia therapeutics market is significantly limited by market saturation and competition from generic products. With an increasing number of therapies on the market, competition between pharmaceutical companies is growing due to a wide range of available options. Having many products available for sale can result in a decrease in profit margins due to competition over prices. Moreover, the expiry of patents for common sleep disorder drugs paves the way for generic alternatives to be introduced in the market. Generic medications, usually less expensive than branded drugs, can greatly affect the sales of patented treatments. The presence of generic options can decrease market share for branded items and constrain revenue growth for pharmaceutical firms. Key factors like market saturation and generic competition can hinder the growth of the insomnia therapeutics market.
By Type
Benzodiazepines held a major market share of 30% in 2023 and led the market. These drugs function by amplifying the impact of a neurotransmitter known as gamma-aminobutyric acid (GABA), which helps with calming and decreasing anxiety, ultimately aiding in sleep. Benzodiazepines like diazepam and lorazepam are commonly utilized due to their rapid onset of action and efficacy in treating short-term and chronic insomnia. Big pharmaceutical companies such as Pfizer and Roche remain dedicated to creating and selling benzodiazepine-based sleep medications, securing their dominant position in the market.
Antidepressants are accounted to have a faster CAGR during 2024-2032. Trazodone and amitriptyline are becoming more popular because of their ability to treat both insomnia and mood disorders such as depression simultaneously. The rise in their development is spurred by a growing acknowledgment of mental Prescription and the demand for treatments with multiple functions. Leading companies such as Eli Lilly and GlaxoSmithKline, are working on creating new formulations and combinations to improve effectiveness while reducing side effects.
By Sales Channel
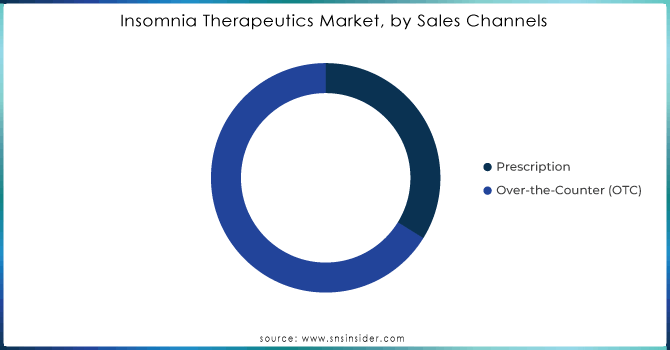
The over-the-counter (OTC) segment dominated in 2023 with a 59% market share. The segment's growth is driven by the growing trend towards self-treatment and the expanding range of safe, non-addictive sleep aids. Companies like GSK are extending their over-the-counter product lines in response to increased consumer knowledge about sleep Prescription and available options. The increasing popularity of melatonin supplements as natural sleep aids is contributing to the rapid growth of the insomnia therapeutics market segment.
The prescriptions are expected to grow at a faster rate during the forecast period because of their connection to specific treatments such as benzodiazepines and other medications that promote sleep. Valium (Diazepam) and Xanax (Alprazolam) are commonly used to treat short-term insomnia due to their strong sedative properties. Prescription care professionals commonly recommend these medications to patients with severe or chronic insomnia to effectively manage the condition. Major pharmaceutical companies such as Pfizer, the manufacturer of Ativan (Lorazepam), are crucial players in this industry, providing various medications for treating insomnia.
Need any customization research on Insomnia Therapeutics Market - Enquiry Now
Regional Analysis
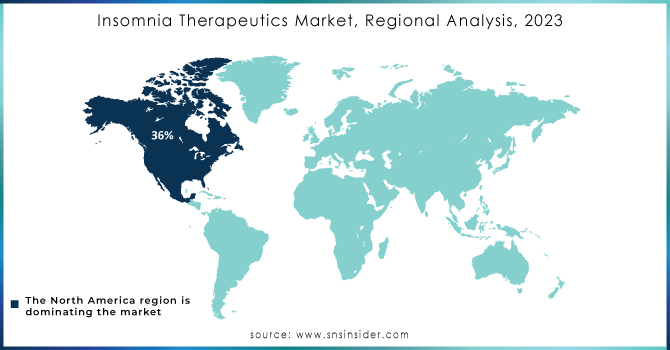
North America captured a market share of 36% in 2023 because of its high prescription care spending, advanced medical infrastructure, and well-established pharmaceutical sector. Big companies such as Eli Lilly, Pfizer, and Merck provide a range of treatments for insomnia, including both prescription drugs and behavioral therapies. These companies prioritize research and development to bring about groundbreaking treatments. Strong regulatory frameworks and high consumer awareness about sleep disorders continue to bolster North America's market strength.
The APAC region is accounted to grow at a faster rate during the forecast period 2024-2032. China and India play a major role in driving this growth. An uptick in insomnia cases and a rise in curiosity for pharmaceutical and non-pharmaceutical remedies are propelling the market. For example, Mylan's Ambien and Taro's Zolpidem are commonly utilized in these sectors. The rapid market growth in APAC is driven by the expansion of Prescriptioncare services and increased adoption of advanced treatments.
The major key players in the market are:
Pfizer Inc.
Merck & Co., Inc.
Takeda Pharmaceutical Company Limited
Novartis International AG
Astellas Pharma Inc.
Vanda Pharmaceuticals Inc.
Almore Bio
Neos Therapeutics
Axovant Gene Therapies Ltd.
Zyla Life Sciences
Recent Development
April 2024: Insomnia Therapeutics entered into a strategic partnership with SleepTech Innovations to integrate their AI-driven sleep monitoring Type with Insomnia Therapeutics’ treatment solutions, enhancing patient outcomes through personalized treatment plans.
August 8, 2024: Insomnia Therapeutics received FDA approval for "SlumberX," a new pharmaceutical treatment for insomnia. This drug aims to provide a fast-acting solution with minimal side effects, marking a significant advancement in its product portfolio.
| Report Attributes | Details |
|---|---|
| Market Size in 2023 | USD 2.50 Billion |
| Market Size by 2032 | USD 3.71 Billion |
| CAGR | CAGR of 4.53% From 2024 to 2032 |
| Base Year | 2023 |
| Forecast Period | 2024-2032 |
| Historical Data | 2020-2022 |
| Report Scope & Coverage | Market Size, Segments Analysis, Competitive Landscape, Regional Analysis, DROC & SWOT Analysis, Forecast Outlook |
| Key Segments | • By Type (Benzodiazepines, Nonbenzodiazepines, Antidepressants, Orexin Antagonists, Melatonin Antagonists, Others) • By Sales Channel (Prescription, OTC) |
| Regional Analysis/Coverage | North America (US, Canada, Mexico), Europe (Eastern Europe [Poland, Romania, Hungary, Turkey, Rest of Eastern Europe] Western Europe] Germany, France, UK, Italy, Spain, Netherlands, Switzerland, Austria, Rest of Western Europe]), Asia Pacific (China, India, Japan, South Korea, Vietnam, Singapore, Australia, Rest of Asia Pacific), Middle East & Africa (Middle East [UAE, Egypt, Saudi Arabia, Qatar, Rest of Middle East], Africa [Nigeria, South Africa, Rest of Africa], Latin America (Brazil, Argentina, Colombia, Rest of Latin America) |
| Company Profiles | Pfizer Inc., Merck & Co., Inc., Johnson & Johnson, Sanofi S.A., Takeda Pharmaceutical Company Limited, Novartis International AG, Astellas Pharma Inc., Sumitomo Dainippon Pharma Co., Ltd., SAGE Therapeutics, Vanda Pharmaceuticals Inc., Almore Bio, Neos Therapeutics, Axovant Gene Therapies Ltd., and Zyla Life Sciences |
| Key Drivers | • Rising prevalence of sleep disorders fuels growth in the insomnia therapeutics market. • Rising awareness and evolving attitudes toward sleep health drive growth. |
| Restraints | • Market saturation and generic competition limiting growth in the insomnia therapeutics market. |
Ans: The Insomnia Therapeutics Market is expected to grow at a CAGR of 4.53% during 2024-2032.
Ans: Insomnia Therapeutics Market size was USD 2.50 Billion in 2023 and is expected to Reach USD 3.71 Billion by 2032.
Ans: The rising prevalence of sleep disorders fuels growth in the insomnia therapeutics market.
Ans: The over-the-counter segment dominated the Insomnia Therapeutics Market.
Ans: North America dominated the Insomnia Therapeutics Market in 2023.
Table of Contents
1. Introduction
1.1 Market Definition
1.2 Scope (Inclusion and Exclusions)
1.3 Research Assumptions
2. Executive Summary
2.1 Market Overview
2.2 Regional Synopsis
2.3 Competitive Summary
3. Research Methodology
3.1 Top-Down Approach
3.2 Bottom-up Approach
3.3. Data Validation
3.4 Primary Interviews
4. Market Dynamics Impact Analysis
4.1 Market Driving Factors Analysis
4.1.2 Drivers
4.1.2 Restraints
4.1.3 Opportunities
4.1.4 Challenges
4.2 PESTLE Analysis
4.3 Porter’s Five Forces Model
5. Statistical Insights and Trends Reporting
5.1 Insomnia Therapeutics Incidence and Prevalence (2023)
5.2 Insomnia Therapeutics Prescription Trends, (2023), by Region
5.3 Insomnia Therapeutics Drug Volume: Production and usage volumes of pharmaceuticals.
5.4 Prescriptioncare Spending, by region, (Government, Commercial, Private, Out-of-Pocket), 2023
6. Competitive Landscape
6.1 List of Major Companies, By Region
6.2 Market Share Analysis, By Region
6.3 Product Benchmarking
6.3.1 Product specifications and features
6.3.2 Pricing
6.4 Strategic Initiatives
6.4.1 Marketing and promotional activities
6.4.2 Distribution and supply chain strategies
6.4.3 Expansion plans and new product launches
6.4.4 Strategic partnerships and collaborations
6.5 Technological Advancements
6.6 Market Positioning and Branding
7. Insomnia Therapeutics Market Segmentation, by Type
7.1 Chapter Overview
7.2 Benzodiazepines
7.2.1 Benzodiazepines Market Trends Analysis (2020-2032)
7.2.2 Benzodiazepines Market Size Estimates and Forecasts to 2032 (USD Billion)
7.3 Nonbenzodiazepines
7.3.1 Nonbenzodiazepines Market Trends Analysis (2020-2032)
7.3.2 Nonbenzodiazepines Market Size Estimates and Forecasts to 2032 (USD Billion)
7.4 Antidepressants
7.4.1 Antidepressants Market Trends Analysis (2020-2032)
7.4.2 Antidepressants Market Size Estimates and Forecasts to 2032 (USD Billion)
7.5 Orexin Antagonists
7.5.1 Orexin Antagonists Market Trends Analysis (2020-2032)
7.5.2 Orexin Antagonists Market Size Estimates and Forecasts to 2032 (USD Billion)
7.6 Melatonin Antagonists
7.6.1 Melatonin Antagonists Market Trends Analysis (2020-2032)
7.6.2 Melatonin Antagonists Market Size Estimates and Forecasts to 2032 (USD Billion)
7.7 Others
7.7.1 Others Market Trends Analysis (2020-2032)
7.7.2 Others Market Size Estimates and Forecasts to 2032 (USD Billion)
8. Insomnia Therapeutics Market Segmentation, by Sales Channel
8.1 Chapter Overview
8.2 Prescription
8.2.1 Prescription Market Trends Analysis (2020-2032)
8.2.2 Prescription Market Size Estimates and Forecasts to 2032 (USD Billion)
8.3 Over-the-counter (OTC)
8.3.1 Over-the-counter (OTC) Market Trends Analysis (2020-2032)
8.3.2 Over-the-counter (OTC) Market Size Estimates and Forecasts to 2032 (USD Billion)
9. Regional Analysis
9.1 Chapter Overview
9.2 North America
9.2.1 Trends Analysis
9.2.2 North America Insomnia Therapeutics Market Estimates and Forecasts, by Country (2020-2032) (USD Billion)
9.2.3 North America Insomnia Therapeutics Market Estimates and Forecasts, by Type (2020-2032) (USD Billion)
9.2.4 North America Insomnia Therapeutics Market Estimates and Forecasts, by Sales Channel (2020-2032) (USD Billion)
9.2.5 USA
9.2.5.1 USA Insomnia Therapeutics Market Estimates and Forecasts, by Type (2020-2032) (USD Billion)
9.2.5.2 USA Insomnia Therapeutics Market Estimates and Forecasts, by Sales Channel (2020-2032) (USD Billion)
9.2.6 Canada
9.2.6.1 Canada Insomnia Therapeutics Market Estimates and Forecasts, by Type (2020-2032) (USD Billion)
9.2.6.2 Canada Insomnia Therapeutics Market Estimates and Forecasts, by Sales Channel (2020-2032) (USD Billion)
9.2.7 Mexico
9.2.7.1 Mexico Insomnia Therapeutics Market Estimates and Forecasts, by Type (2020-2032) (USD Billion)
9.2.7.2 Mexico Insomnia Therapeutics Market Estimates and Forecasts, by Sales Channel (2020-2032) (USD Billion)
9.3 Europe
9.3.1 Eastern Europe
9.3.1.1 Trends Analysis
9.3.1.2 Eastern Europe Insomnia Therapeutics Market Estimates and Forecasts, by Country (2020-2032) (USD Billion)
9.3.1.3 Eastern Europe Insomnia Therapeutics Market Estimates and Forecasts, by Type (2020-2032) (USD Billion)
9.3.1.4 Eastern Europe Insomnia Therapeutics Market Estimates and Forecasts, by Sales Channel (2020-2032) (USD Billion)
9.3.1.5 Poland
9.3.1.5.1 Poland Insomnia Therapeutics Market Estimates and Forecasts, by Type (2020-2032) (USD Billion)
9.3.1.5.2 Poland Insomnia Therapeutics Market Estimates and Forecasts, by Sales Channel (2020-2032) (USD Billion)
9.3.1.6 Romania
9.3.1.6.1 Romania Insomnia Therapeutics Market Estimates and Forecasts, by Type (2020-2032) (USD Billion)
9.3.1.6.2 Romania Insomnia Therapeutics Market Estimates and Forecasts, by Sales Channel (2020-2032) (USD Billion)
9.3.1.7 Hungary
9.3.1.7.1 Hungary Insomnia Therapeutics Market Estimates and Forecasts, by Type (2020-2032) (USD Billion)
9.3.1.7.2 Hungary Insomnia Therapeutics Market Estimates and Forecasts, by Sales Channel (2020-2032) (USD Billion)
9.3.1.8 Turkey
9.3.1.8.1 Turkey Insomnia Therapeutics Market Estimates and Forecasts, by Type (2020-2032) (USD Billion)
9.3.1.8.2 Turkey Insomnia Therapeutics Market Estimates and Forecasts, by Sales Channel (2020-2032) (USD Billion)
9.3.1.9 Rest of Eastern Europe
9.3.1.9.1 Rest of Eastern Europe Insomnia Therapeutics Market Estimates and Forecasts, by Type (2020-2032) (USD Billion)
9.3.1.9.2 Rest of Eastern Europe Insomnia Therapeutics Market Estimates and Forecasts, by Sales Channel (2020-2032) (USD Billion)
9.3.2 Western Europe
9.3.2.1 Trends Analysis
9.3.2.2 Western Europe Insomnia Therapeutics Market Estimates and Forecasts, by Country (2020-2032) (USD Billion)
9.3.2.3 Western Europe Insomnia Therapeutics Market Estimates and Forecasts, by Type (2020-2032) (USD Billion)
9.3.2.4 Western Europe Insomnia Therapeutics Market Estimates and Forecasts, by Sales Channel (2020-2032) (USD Billion)
9.3.2.5 Germany
9.3.2.5.1 Germany Insomnia Therapeutics Market Estimates and Forecasts, by Type (2020-2032) (USD Billion)
9.3.2.5.2 Germany Insomnia Therapeutics Market Estimates and Forecasts, by Sales Channel (2020-2032) (USD Billion)
9.3.2.6 France
9.3.2.6.1 France Insomnia Therapeutics Market Estimates and Forecasts, by Type (2020-2032) (USD Billion)
9.3.2.6.2 France Insomnia Therapeutics Market Estimates and Forecasts, by Sales Channel (2020-2032) (USD Billion)
9.3.2.7 UK
9.3.2.7.1 UK Insomnia Therapeutics Market Estimates and Forecasts, by Type (2020-2032) (USD Billion)
9.3.2.7.2 UK Insomnia Therapeutics Market Estimates and Forecasts, by Sales Channel (2020-2032) (USD Billion)
9.3.2.8 Italy
9.3.2.8.1 Italy Insomnia Therapeutics Market Estimates and Forecasts, by Type (2020-2032) (USD Billion)
9.3.2.8.2 Italy Insomnia Therapeutics Market Estimates and Forecasts, by Sales Channel (2020-2032) (USD Billion)
9.3.2.9 Spain
9.3.2.9.1 Spain Insomnia Therapeutics Market Estimates and Forecasts, by Type (2020-2032) (USD Billion)
9.3.2.9.2 Spain Insomnia Therapeutics Market Estimates and Forecasts, by Sales Channel (2020-2032) (USD Billion)
9.3.2.10 Netherlands
9.3.2.10.1 Netherlands Insomnia Therapeutics Market Estimates and Forecasts, by Type (2020-2032) (USD Billion)
9.3.2.10.2 Netherlands Insomnia Therapeutics Market Estimates and Forecasts, by Sales Channel (2020-2032) (USD Billion)
9.3.2.11 Switzerland
9.3.2.11.1 Switzerland Insomnia Therapeutics Market Estimates and Forecasts, by Type (2020-2032) (USD Billion)
9.3.2.11.2 Switzerland Insomnia Therapeutics Market Estimates and Forecasts, by Sales Channel (2020-2032) (USD Billion)
9.3.2.12 Austria
9.3.2.12.1 Austria Insomnia Therapeutics Market Estimates and Forecasts, by Type (2020-2032) (USD Billion)
9.3.2.12.2 Austria Insomnia Therapeutics Market Estimates and Forecasts, by Sales Channel (2020-2032) (USD Billion)
9.3.2.13 Rest of Western Europe
9.3.2.13.1 Rest of Western Europe Insomnia Therapeutics Market Estimates and Forecasts, by Type (2020-2032) (USD Billion)
9.3.2.13.2 Rest of Western Europe Insomnia Therapeutics Market Estimates and Forecasts, by Sales Channel (2020-2032) (USD Billion)
9.4 Asia-Pacific
9.4.1 Trends Analysis
9.4.2 Asia-Pacific Insomnia Therapeutics Market Estimates and Forecasts, by Country (2020-2032) (USD Billion)
9.4.3 Asia-Pacific Insomnia Therapeutics Market Estimates and Forecasts, by Type (2020-2032) (USD Billion)
9.4.4 Asia-Pacific Insomnia Therapeutics Market Estimates and Forecasts, by Sales Channel (2020-2032) (USD Billion)
9.4.5 China
9.4.5.1 China Insomnia Therapeutics Market Estimates and Forecasts, by Type (2020-2032) (USD Billion)
9.4.5.2 China Insomnia Therapeutics Market Estimates and Forecasts, by Sales Channel (2020-2032) (USD Billion)
9.4.6 India
9.4.5.1 India Insomnia Therapeutics Market Estimates and Forecasts, by Type (2020-2032) (USD Billion)
9.4.5.2 India Insomnia Therapeutics Market Estimates and Forecasts, by Sales Channel (2020-2032) (USD Billion)
9.4.5 Japan
9.4.5.1 Japan Insomnia Therapeutics Market Estimates and Forecasts, by Type (2020-2032) (USD Billion)
9.4.5.2 Japan Insomnia Therapeutics Market Estimates and Forecasts, by Sales Channel (2020-2032) (USD Billion)
9.4.6 South Korea
9.4.6.1 South Korea Insomnia Therapeutics Market Estimates and Forecasts, by Type (2020-2032) (USD Billion)
9.4.6.2 South Korea Insomnia Therapeutics Market Estimates and Forecasts, by Sales Channel (2020-2032) (USD Billion)
9.4.7 Vietnam
9.4.7.1 Vietnam Insomnia Therapeutics Market Estimates and Forecasts, by Type (2020-2032) (USD Billion)
9.2.7.2 Vietnam Insomnia Therapeutics Market Estimates and Forecasts, by Sales Channel (2020-2032) (USD Billion)
9.4.8 Singapore
9.4.8.1 Singapore Insomnia Therapeutics Market Estimates and Forecasts, by Type (2020-2032) (USD Billion)
9.4.8.2 Singapore Insomnia Therapeutics Market Estimates and Forecasts, by Sales Channel (2020-2032) (USD Billion)
9.4.9 Australia
9.4.9.1 Australia Insomnia Therapeutics Market Estimates and Forecasts, by Type (2020-2032) (USD Billion)
9.4.9.2 Australia Insomnia Therapeutics Market Estimates and Forecasts, by Sales Channel (2020-2032) (USD Billion)
9.4.10 Rest of Asia-Pacific
9.4.10.1 Rest of Asia-Pacific Insomnia Therapeutics Market Estimates and Forecasts, by Type (2020-2032) (USD Billion)
9.4.10.2 Rest of Asia-Pacific Insomnia Therapeutics Market Estimates and Forecasts, by Sales Channel (2020-2032) (USD Billion)
9.5 Middle East and Africa
9.5.1 Middle East
9.5.1.1 Trends Analysis
9.5.1.2 Middle East Insomnia Therapeutics Market Estimates and Forecasts, by Country (2020-2032) (USD Billion)
9.5.1.3 Middle East Insomnia Therapeutics Market Estimates and Forecasts, by Type (2020-2032) (USD Billion)
9.5.1.4 Middle East Insomnia Therapeutics Market Estimates and Forecasts, by Sales Channel (2020-2032) (USD Billion)
9.5.1.5 UAE
9.5.1.5.1 UAE Insomnia Therapeutics Market Estimates and Forecasts, by Type (2020-2032) (USD Billion)
9.5.1.5.2 UAE Insomnia Therapeutics Market Estimates and Forecasts, by Sales Channel (2020-2032) (USD Billion)
9.5.1.6 Egypt
9.5.1.6.1 Egypt Insomnia Therapeutics Market Estimates and Forecasts, by Type (2020-2032) (USD Billion)
9.5.1.6.2 Egypt Insomnia Therapeutics Market Estimates and Forecasts, by Sales Channel (2020-2032) (USD Billion)
9.5.1.7 Saudi Arabia
9.5.1.7.1 Saudi Arabia Insomnia Therapeutics Market Estimates and Forecasts, by Type (2020-2032) (USD Billion)
9.5.1.7.2 Saudi Arabia Insomnia Therapeutics Market Estimates and Forecasts, by Sales Channel (2020-2032) (USD Billion)
9.5.1.8 Qatar
9.5.1.8.1 Qatar Insomnia Therapeutics Market Estimates and Forecasts, by Type (2020-2032) (USD Billion)
9.5.1.8.2 Qatar Insomnia Therapeutics Market Estimates and Forecasts, by Sales Channel (2020-2032) (USD Billion)
9.5.1.9 Rest of Middle East
9.5.1.9.1 Rest of Middle East Insomnia Therapeutics Market Estimates and Forecasts, by Type (2020-2032) (USD Billion)
9.5.1.9.2 Rest of Middle East Insomnia Therapeutics Market Estimates and Forecasts, by Sales Channel (2020-2032) (USD Billion)
9.5.2 Africa
9.5.2.1 Trends Analysis
9.5.2.2 Africa Insomnia Therapeutics Market Estimates and Forecasts, by Country (2020-2032) (USD Billion)
9.5.2.3 Africa Insomnia Therapeutics Market Estimates and Forecasts, by Type (2020-2032) (USD Billion)
9.5.2.4 Africa Insomnia Therapeutics Market Estimates and Forecasts, by Sales Channel (2020-2032) (USD Billion)
9.5.2.5 South Africa
9.5.2.5.1 South Africa Insomnia Therapeutics Market Estimates and Forecasts, by Type (2020-2032) (USD Billion)
9.5.2.5.2 South Africa Insomnia Therapeutics Market Estimates and Forecasts, by Sales Channel (2020-2032) (USD Billion)
9.5.2.6 Nigeria
9.5.2.6.1 Nigeria Insomnia Therapeutics Market Estimates and Forecasts, by Type (2020-2032) (USD Billion)
9.5.2.6.2 Nigeria Insomnia Therapeutics Market Estimates and Forecasts, by Sales Channel (2020-2032) (USD Billion)
9.5.2.7 Rest of Africa
9.5.2.7.1 Rest of Africa Insomnia Therapeutics Market Estimates and Forecasts, by Component (2020-2032) (USD Billion)
9.5.2.7.2 Rest of Africa Insomnia Therapeutics Market Estimates and Forecasts, by Type (2020-2032) (USD Billion)
9.6 Latin America
9.6.1 Trends Analysis
9.6.2 Latin America Insomnia Therapeutics Market Estimates and Forecasts, by Country (2020-2032) (USD Billion)
9.6.3 Latin America Insomnia Therapeutics Market Estimates and Forecasts, by Type (2020-2032) (USD Billion)
9.6.4 Latin America Insomnia Therapeutics Market Estimates and Forecasts, by Sales Channel (2020-2032) (USD Billion)
9.6.5 Brazil
9.6.5.1 Brazil Insomnia Therapeutics Market Estimates and Forecasts, by Type (2020-2032) (USD Billion)
9.6.5.2 Brazil Insomnia Therapeutics Market Estimates and Forecasts, by Sales Channel (2020-2032) (USD Billion)
9.6.6 Argentina
9.6.6.1 Argentina Insomnia Therapeutics Market Estimates and Forecasts, by Type (2020-2032) (USD Billion)
9.6.6.2 Argentina Insomnia Therapeutics Market Estimates and Forecasts, by Sales Channel (2020-2032) (USD Billion)
9.6.7 Colombia
9.6.7.1 Colombia Insomnia Therapeutics Market Estimates and Forecasts, by Type (2020-2032) (USD Billion)
9.6.7.2 Colombia Insomnia Therapeutics Market Estimates and Forecasts, by Sales Channel (2020-2032) (USD Billion)
9.6.8 Rest of Latin America
9.6.8.1 Rest of Latin America Insomnia Therapeutics Market Estimates and Forecasts, by Type (2020-2032) (USD Billion)
9.6.8.2 Rest of Latin America Insomnia Therapeutics Market Estimates and Forecasts, by Sales Channel (2020-2032) (USD Billion)
10. Company Profiles
10.1 Pfizer Inc.
10.1.1 Company Overview
10.1.2 Financial
10.1.3 Products/ Services Offered
110.1.4 SWOT Analysis
10.2 Merck & Co., Inc.
10.2.1 Company Overview
10.2.2 Financial
10.2.3 Products/ Services Offered
10.2.4 SWOT Analysis
10.3 Johnson & Johnson
10.3.1 Company Overview
10.3.2 Financial
10.3.3 Products/ Services Offered
10.3.4 SWOT Analysis
10.4 Sanofi S.A.
10.4.1 Company Overview
10.4.2 Financial
10.4.3 Products/ Services Offered
10.4.4 SWOT Analysis
10.5 Takeda Pharmaceutical Company Limited
10.5.1 Company Overview
10.5.2 Financial
10.5.3 Products/ Services Offered
10.5.4 SWOT Analysis
10.6 Novartis International AG
10.6.1 Company Overview
10.6.2 Financial
10.6.3 Products/ Services Offered
10.6.4 SWOT Analysis
10.7 Astellas Pharma Inc.
10.7.1 Company Overview
10.7.2 Financial
10.7.3 Products/ Services Offered
10.7.4 SWOT Analysis
10.8 Sumitomo Dainippon Pharma Co., Ltd.
10.8.1 Company Overview
10.8.2 Financial
10.8.3 Products/ Services Offered
10.8.4 SWOT Analysis
10.9 SAGE Therapeutics
10.9.1 Company Overview
10.9.2 Financial
10.9.3 Products/ Services Offered
10.9.4 SWOT Analysis
10.10 Vanda Pharmaceuticals Inc.
10.9.1 Company Overview
10.9.2 Financial
10.9.3 Products/ Services Offered
10.9.4 SWOT Analysis
11. Use Cases and Best Practices
12. Conclusion
An accurate research report requires proper strategizing as well as implementation. There are multiple factors involved in the completion of good and accurate research report and selecting the best methodology to compete the research is the toughest part. Since the research reports we provide play a crucial role in any company’s decision-making process, therefore we at SNS Insider always believe that we should choose the best method which gives us results closer to reality. This allows us to reach at a stage wherein we can provide our clients best and accurate investment to output ratio.
Each report that we prepare takes a timeframe of 350-400 business hours for production. Starting from the selection of titles through a couple of in-depth brain storming session to the final QC process before uploading our titles on our website we dedicate around 350 working hours. The titles are selected based on their current market cap and the foreseen CAGR and growth.
The 5 steps process:
Step 1: Secondary Research:
Secondary Research or Desk Research is as the name suggests is a research process wherein, we collect data through the readily available information. In this process we use various paid and unpaid databases which our team has access to and gather data through the same. This includes examining of listed companies’ annual reports, Journals, SEC filling etc. Apart from this our team has access to various associations across the globe across different industries. Lastly, we have exchange relationships with various university as well as individual libraries.

Step 2: Primary Research
When we talk about primary research, it is a type of study in which the researchers collect relevant data samples directly, rather than relying on previously collected data. This type of research is focused on gaining content specific facts that can be sued to solve specific problems. Since the collected data is fresh and first hand therefore it makes the study more accurate and genuine.
We at SNS Insider have divided Primary Research into 2 parts.
Part 1 wherein we interview the KOLs of major players as well as the upcoming ones across various geographic regions. This allows us to have their view over the market scenario and acts as an important tool to come closer to the accurate market numbers. As many as 45 paid and unpaid primary interviews are taken from both the demand and supply side of the industry to make sure we land at an accurate judgement and analysis of the market.
This step involves the triangulation of data wherein our team analyses the interview transcripts, online survey responses and observation of on filed participants. The below mentioned chart should give a better understanding of the part 1 of the primary interview.

Part 2: In this part of primary research the data collected via secondary research and the part 1 of the primary research is validated with the interviews from individual consultants and subject matter experts.
Consultants are those set of people who have at least 12 years of experience and expertise within the industry whereas Subject Matter Experts are those with at least 15 years of experience behind their back within the same space. The data with the help of two main processes i.e., FGDs (Focused Group Discussions) and IDs (Individual Discussions). This gives us a 3rd party nonbiased primary view of the market scenario making it a more dependable one while collation of the data pointers.
Step 3: Data Bank Validation
Once all the information is collected via primary and secondary sources, we run that information for data validation. At our intelligence centre our research heads track a lot of information related to the market which includes the quarterly reports, the daily stock prices, and other relevant information. Our data bank server gets updated every fortnight and that is how the information which we collected using our primary and secondary information is revalidated in real time.

Step 4: QA/QC Process
After all the data collection and validation our team does a final level of quality check and quality assurance to get rid of any unwanted or undesired mistakes. This might include but not limited to getting rid of the any typos, duplication of numbers or missing of any important information. The people involved in this process include technical content writers, research heads and graphics people. Once this process is completed the title gets uploader on our platform for our clients to read it.
Step 5: Final QC/QA Process:
This is the last process and comes when the client has ordered the study. In this process a final QA/QC is done before the study is emailed to the client. Since we believe in giving our clients a good experience of our research studies, therefore, to make sure that we do not lack at our end in any way humanly possible we do a final round of quality check and then dispatch the study to the client.
By Type
Benzodiazepines
Nonbenzodiazepines
Antidepressants
Orexin Antagonists
Melatonin Antagonists
Others
By Sales Channel
Prescription
Over-the-counter (OTC)
Request for Segment Customization as per your Business Requirement: Segment Customization Request
REGIONAL COVERAGE:
North America
US
Canada
Mexico
Europe
Eastern Europe
Poland
Romania
Hungary
Turkey
Rest of Eastern Europe
Western Europe
Germany
France
UK
Italy
Spain
Netherlands
Switzerland
Austria
Rest of Western Europe
Asia Pacific
China
India
Japan
South Korea
Vietnam
Singapore
Australia
Rest of Asia Pacific
Middle East & Africa
Middle East
UAE
Egypt
Saudi Arabia
Qatar
Rest of the Middle East
Africa
Nigeria
South Africa
Rest of Africa
Latin America
Brazil
Argentina
Colombia
Request for Country Level Research Report: Country Level Customization Request
Available Customization
With the given market data, SNS Insider offers customization as per the company’s specific needs. The following customization options are available for the report:
Product Analysis
Criss-Cross segment analysis (e.g. Product X Application)
Product Matrix which gives a detailed comparison of the product portfolio of each company
Geographic Analysis
Additional countries in any of the regions
Company Information
Detailed analysis and profiling of additional market players (Up to five)
Hair Transplant Market was valued at USD 18.43 billion in 2023 and is expected to reach USD 110.06 billion by 2032, growing at a CAGR of 21.99% from 2024-2032.
Coagulants Market was valued at USD 9.94 billion in 2023 and is expected to reach USD 17.63 billion by 2032, growing at a CAGR of 6.62% from 2024 to 2032.
The Leptospirosis Market was valued at USD 501.0 million in 2023 and is expected to reach USD 868.2 million by 2032 with a growing CAGR of 6.3% from 2024 to 2032.
The Angiography Equipment Market Size was valued at USD 10.53 Billion in 2023 and is expected to reach USD 17.92 Billion by 2032 and grow at a CAGR of 6.11% over the forecast period 2024-2032.
The Clinical Documentation Improvement Market Size was assessed to be worth USD 5.13 billion in 2023 and is expected to increase to USD 9.96 billion by 2032.
The Post-traumatic stress disorder treatment Market was valued at USD 15.00 Bn in 2023 and is expected to reach USD 22.85 Bn by 2032, growing at a CAGR of 4.81% from 2024-2032.

Hi! Click one of our member below to chat on Phone
© 2025 All Rights Reserved by SNS Insider Pvt Ltd


