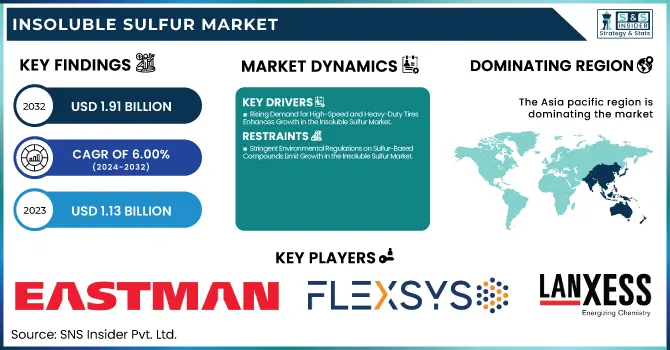
The Insoluble Sulfur Market Size was valued at USD 1.13 Billion in 2023 and is expected to reach USD 1.91 Billion by 2032, growing at a CAGR of 6.00% over the forecast period of 2024-2032.
To Get more information on Insoluble Sulfur Market - Request Free Sample Report
The Insoluble Sulfur Market is evolving rapidly, driven by increasing demand in tire manufacturing and industrial rubber applications. Our report provides an in-depth supply chain analysis, outlining raw material sourcing, logistics, and production hubs shaping market efficiency. A detailed study of pricing trends and cost structures highlights raw material fluctuations and their impact on profitability. Stringent regulatory and environmental factors influence production, with sustainability and compliance playing key roles. Investment and financial analysis explore capital expenditures, mergers, and acquisitions defining market competition. Additionally, a shifting distributor and supply network impacts global trade and supply chain resilience. Our report delivers exclusive insights, offering a strategic perspective on the market’s growth, challenges, and future opportunities.
Drivers
Rising Demand for High-Speed and Heavy-Duty Tires Enhances Growth in the Insoluble Sulfur Market
The global expansion of high-speed and heavy-duty transportation is fueling the Insoluble Sulfur Market. Tires designed for heavy commercial vehicles, aviation, and performance automobiles require superior heat resistance, tensile strength, and durability, which insoluble sulfur provides. With the rise in global logistics, freight transportation, and long-haul trucking, the demand for durable and high-load-bearing tires is increasing. Heavy-duty tires require optimized vulcanization processes to maintain strength under extreme weight and road conditions. Additionally, motorsports and high-speed vehicle manufacturers are pushing for advanced tire technologies that enhance grip, stability, and longevity. Insoluble sulfur plays a crucial role in these applications, ensuring the rubber compounds retain their integrity under high stress. Furthermore, as electric vehicles gain traction, the need for specialized tires with lower rolling resistance and enhanced wear resistance is driving research into optimized insoluble sulfur-based formulations. This growing focus on durability, efficiency, and safety across transportation industries is reinforcing the demand for high-quality vulcanizing agents like insoluble sulfur.
Restraints
Stringent Environmental Regulations on Sulfur-Based Compounds Limit Growth in the Insoluble Sulfur Market
Government-imposed environmental regulations on sulfur-based chemicals are restricting the Insoluble Sulfur Market. The production of insoluble sulfur involves chemical processes that release sulfur dioxide and other pollutants, leading to tighter industrial emission control policies. Many countries are enforcing strict environmental standards, compelling manufacturers to adopt costly compliance measures such as emission-reduction technologies and alternative processing methods. These additional costs impact the profitability of insoluble sulfur producers, limiting market expansion. Furthermore, the growing push for sustainable and biodegradable alternatives in the rubber industry has led some companies to explore alternative vulcanizing agents, reducing dependence on sulfur-based solutions. Regulatory scrutiny is particularly high in regions with strict environmental policies, such as Europe and North America, where industries must adhere to low-emission production standards. While technological advancements are helping mitigate these environmental concerns, the continuous evolution of regulations creates uncertainty in the market. Companies must invest heavily in research and sustainable manufacturing practices to maintain compliance, making market entry and expansion challenging for new and existing players.
Opportunities
Expansion of the Electric Vehicle Sector Drives Demand for Advanced Tire Solutions in the Insoluble Sulfur Market
The rapid expansion of the electric vehicle industry is creating new opportunities for the Insoluble Sulfur Market. Electric vehicles require specialized tires designed for low rolling resistance, high durability, and superior traction to optimize battery efficiency and vehicle performance. Unlike conventional vehicles, electric cars generate higher torque, increasing tire wear and necessitating more durable rubber compounds. Insoluble sulfur plays a crucial role in the vulcanization of these advanced rubber compounds, ensuring they meet the demanding performance standards of electric vehicles. Additionally, global government initiatives promoting electric mobility and sustainability are accelerating investments in innovative tire technologies. Leading tire manufacturers are investing in research and development to produce energy-efficient and environmentally friendly tire solutions tailored for electric vehicles. As the electric vehicle market grows, the need for high-performance rubber formulations using insoluble sulfur is set to rise, providing a lucrative opportunity for market expansion.
Challenge
Increasing Competition from Alternative Vulcanizing Agents Challenges the Growth of the Insoluble Sulfur Market
The Insoluble Sulfur Market is facing growing competition from alternative vulcanizing agents that offer improved performance and environmental benefits. Chemical companies are developing new cross-linking agents, such as peroxide-based and nitrogen-based vulcanization systems, which provide superior elasticity, faster curing times, and reduced sulfur emissions. Some of these alternatives are gaining traction due to their sustainability advantages and lower environmental impact. Additionally, the push for bio-based rubber solutions is leading to the exploration of novel vulcanization techniques that challenge the dominance of sulfur-based curing agents. As tire and rubber manufacturers seek eco-friendly solutions, the adoption of alternative vulcanization technologies is increasing. This competitive pressure is forcing insoluble sulfur manufacturers to invest in innovation and differentiation strategies to maintain their market position.
By Grade
Regular Grade dominated the Insoluble Sulfur Market in 2023 with a market share of 50.3%. This segment led due to its extensive use in standard tire manufacturing and general rubber processing. Regular grade insoluble sulfur is cost-effective and widely used in mass-produced automotive and commercial vehicle tires, aligning with the steady demand for passenger cars and commercial fleets worldwide. According to the U.S. Tire Manufacturers Association (USTMA), global tire production has been on the rise, with a significant share allocated to passenger and commercial vehicle tires, which predominantly use regular grade sulfur. Additionally, the European Tyre and Rubber Manufacturers’ Association (ETRMA) reported that European tire production rebounded post-pandemic, increasing the demand for insoluble sulfur. Governments worldwide, such as China's push for domestic tire production under the "Made in China 2025" initiative, have further supported this demand, solidifying the dominance of the regular-grade segment.
By Application
Tire Manufacturing dominated the Insoluble Sulfur Market in 2023 with a market share of 72.5%. The dominance is driven by the expanding global automotive industry, where tires require high-performance rubber compounds for enhanced durability and safety. The rising adoption of electric vehicles (EVs), which require specialized low-rolling-resistance tires, has further increased the demand for insoluble sulfur. The International Organization of Motor Vehicle Manufacturers (OICA) reported a steady rise in vehicle production, especially in Asia-Pacific and North America, where tire demand is highest. Additionally, the United Nations Environment Programme (UNEP) has been promoting sustainable mobility, indirectly influencing tire manufacturers to optimize formulations using insoluble sulfur. Government policies, such as India's PLI scheme for Advanced Chemistry Cells (ACC) Battery Manufacturing, indirectly fuel tire production by boosting EV manufacturing, ensuring tire demand remains robust. Leading tire manufacturers like Michelin, Bridgestone, and Goodyear have been expanding production facilities, reinforcing the segment’s dominance.
By End-Use Industry
The Automotive industry dominated the Insoluble Sulfur Market in 2023 with a market share of 68.2%. This dominance is attributed to the increased production of vehicles and the rising need for durable, high-performance tires. The International Energy Agency (IEA) reported that EV sales surpassed 14 million units in 2023, intensifying the demand for specialized rubber components. Additionally, the U.S. Department of Energy (DOE) has introduced incentives for fuel-efficient vehicles, indirectly boosting tire and rubber component manufacturing, where insoluble sulfur is crucial. The rise in commercial vehicle fleets due to the expansion of e-commerce and logistics services has further fueled the demand for high-load-bearing tires, increasing insoluble sulfur consumption. Moreover, global automotive leaders like Tesla, Toyota, and Volkswagen have been ramping up vehicle production, further cementing the automotive sector’s dominance in the insoluble sulfur market.
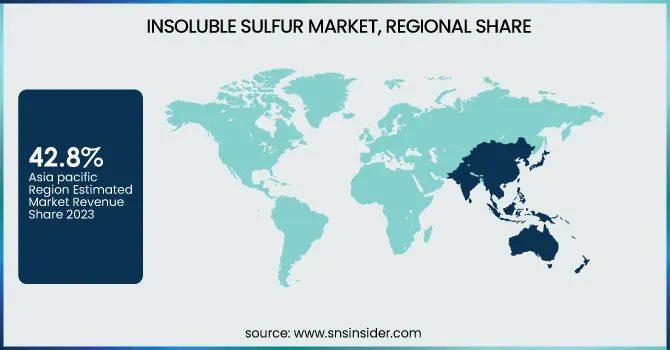
Asia Pacific dominated the Insoluble Sulfur Market in 2023, capturing 42.8% of the global market share, primarily due to its well-established tire manufacturing sector and increasing automotive production. Countries such as China, India, Japan, and South Korea drive the demand, with China leading as the largest producer and consumer of insoluble sulfur due to its dominance in automotive and rubber processing industries. According to the China Association of Automobile Manufacturers (CAAM), China produced over 30 million vehicles in 2023, significantly increasing the demand for high-performance tires that require insoluble sulfur for vulcanization. India follows with rapid industrialization and tire production growth, supported by initiatives like the PLI Scheme for Auto and Auto Components by the Government of India, aimed at boosting domestic manufacturing. Japan and South Korea, home to Toyota, Honda, Hyundai, and Kia, contribute significantly to the market due to their export-driven automotive industries. Additionally, Southeast Asian countries such as Thailand and Indonesia, known as global tire manufacturing hubs, further bolster the demand for insoluble sulfur. Investments from key players like Bridgestone, Michelin, and Sumitomo Rubber Industries in expanding production facilities across Asia Pacific have cemented the region’s leadership in the market.
Moreover, Europe emerged as the fastest-growing region in the Insoluble Sulfur Market, with an estimated CAGR of 6.5% during the forecast period, driven by sustainability initiatives, stringent environmental regulations, and increasing demand for green tires. The European Union’s Green Deal and Euro 7 emission standards are pushing tire manufacturers to adopt eco-friendly production methods, indirectly boosting the demand for insoluble sulfur. Germany leads the European market with its strong automotive sector, housing major manufacturers such as Volkswagen, BMW, and Mercedes-Benz, which increasingly rely on advanced rubber processing technologies. France follows closely, with Michelin investing in research for high-performance, long-lasting tires that utilize insoluble sulfur in vulcanization. The United Kingdom is also witnessing growth due to investments in electric vehicle (EV) infrastructure, driving the need for specialized EV tires. Moreover, Poland and Hungary have emerged as key tire manufacturing hubs, attracting investments from Continental, Pirelli, and Bridgestone, further propelling market growth in the region.
Get Customized Report as per Your Business Requirement - Enquiry Now
Key Players
Changde Dingyuan Chemical Industrial Limited
China Sunsine Chemical Holdings Ltd.
Eastman Chemical Company
Grupa Azoty S.A.
Henan Kailun Chemical Co., Ltd.
Heze Great Bridge Chemical Co., Ltd.
Lanxess AG
Ningbo Actmix Rubber Chemicals Co., Ltd.
Oriental Carbon & Chemicals Ltd. (OCCL)
Pelican Rubber Ltd.
SANSHIN CHEMICAL INDUSTRY CO., LTD.
Shandong Yanggu Huatai Chemical Co., Ltd.
Sunsine Chemical Holdings Ltd.
Wuxi Huasheng Rubber Technical Co., Ltd.
Leader Technologies Co., Ltd.
LIONS INDUSTRIES s.r.o.
Shandong Xiangyu Chemical Co., Ltd.
Recent Developments
August 2024: Flexsys increased global prices by up to 12% for Insoluble Sulfur, 6PPD, and 4-ADPA products from September 1, 2024, citing inflation. The company also invested in a Next Generation Antidegradant for sustainable tire manufacturing.
| Report Attributes | Details |
|---|---|
| Market Size in 2023 | USD 1.13 Billion |
| Market Size by 2032 | USD 1.91 Billion |
| CAGR | CAGR of 6.00% From 2024 to 2032 |
| Base Year | 2023 |
| Forecast Period | 2024-2032 |
| Historical Data | 2020-2022 |
| Report Scope & Coverage | Market Size, Segments Analysis, Competitive Landscape, Regional Analysis, DROC & SWOT Analysis, Forecast Outlook |
| Key Segments | •By Grade (High Thermal Stability (HTS), Medium Thermal Stability (MTS), Regular Grade) •By Application (Tire Manufacturing, Footwear, Industrial Rubber Goods, Adhesives & Sealants, Others) •By End-Use Industry (Automotive, Construction, Aerospace, Chemical & Petrochemical, Others) |
| Regional Analysis/Coverage | North America (US, Canada, Mexico), Europe (Eastern Europe [Poland, Romania, Hungary, Turkey, Rest of Eastern Europe] Western Europe] Germany, France, UK, Italy, Spain, Netherlands, Switzerland, Austria, Rest of Western Europe]), Asia Pacific (China, India, Japan, South Korea, Vietnam, Singapore, Australia, Rest of Asia Pacific), Middle East & Africa (Middle East [UAE, Egypt, Saudi Arabia, Qatar, Rest of Middle East], Africa [Nigeria, South Africa, Rest of Africa], Latin America (Brazil, Argentina, Colombia, Rest of Latin America) |
| Company Profiles | Oriental Carbon & Chemicals Ltd. (OCCL), Eastman Chemical Company, China Sunsine Chemical Holdings Ltd., Shikoku Chemicals Corporation, Henan Kailun Chemical Co., Ltd., Ningbo Actmix Rubber Chemicals Co., Ltd., Grupa Azoty S.A., Kuantum Corp, Pelican Rubber Ltd., Lanxess AG and other key players |
Ans: The Insoluble Sulfur Market is valued at USD 1.13 Billion in 2023.
Ans: The Insoluble Sulfur Market is expected to reach USD 1.91 Billion by 2032.
Ans: Leading players in the Insoluble Sulfur Market include Michelin, Bridgestone, and Sumitomo Rubber Industries.
Ans: Europe is projected to be the fastest-growing region in the Insoluble Sulfur Market with a 6.5% CAGR.
Ans: Asia Pacific led the Insoluble Sulfur Market in 2023 with a 42.8% market share.
Table of Contents:
1. Introduction
1.1 Market Definition
1.2 Scope (Inclusion and Exclusions)
1.3 Research Assumptions
2. Executive Summary
2.1 Market Overview
2.2 Regional Synopsis
2.3 Competitive Summary
3. Research Methodology
3.1 Top-Down Approach
3.2 Bottom-up Approach
3.3. Data Validation
3.4 Primary Interviews
4. Market Dynamics Impact Analysis
4.1 Market Driving Factors Analysis
4.1.1 Drivers
4.1.2 Restraints
4.1.3 Opportunities
4.1.4 Challenges
4.2 PESTLE Analysis
4.3 Porter’s Five Forces Model
5. Statistical Insights and Trends Reporting
5.1 Supply Chain Analysis
5.2 Pricing Trends & Cost Structure
5.3 Regulatory & Environmental Impact
5.4 Investment & Financial Analysis
5.5 Distributor & Supply Network Analysis
6. Competitive Landscape
6.1 List of Major Companies, By Region
6.2 Market Share Analysis, By Region
6.3 Product Benchmarking
6.3.1 Product specifications and features
6.3.2 Pricing
6.4 Strategic Initiatives
6.4.1 Marketing and promotional activities
6.4.2 Distribution and supply chain strategies
6.4.3 Expansion plans and new product launches
6.4.4 Strategic partnerships and collaborations
6.5 Technological Advancements
6.6 Market Positioning and Branding
7. Insoluble Sulfur Market Segmentation, by Grade
7.1 Chapter Overview
7.2 High Thermal Stability (HTS)
7.2.1 High Thermal Stability (HTS) Market Trends Analysis (2020-2032)
7.2.2 High Thermal Stability (HTS) Market Size Estimates and Forecasts to 2032 (USD Billion)
7.3 Medium Thermal Stability (MTS)
7.3.1 Medium Thermal Stability (MTS) Market Trends Analysis (2020-2032)
7.3.2 Medium Thermal Stability (MTS) Market Size Estimates and Forecasts to 2032 (USD Billion)
7.4 Regular Grade
7.4.1 Regular Grade Market Trends Analysis (2020-2032)
7.4.2 Regular Grade Market Size Estimates and Forecasts to 2032 (USD Billion)
8. Insoluble Sulfur Market Segmentation, by Application
8.1 Chapter Overview
8.2 Tire Manufacturing
8.2.1 Tire Manufacturing Market Trends Analysis (2020-2032)
8.2.2 Tire Manufacturing Market Size Estimates and Forecasts to 2032 (USD Billion)
8.3 Footwear
8.3.1 Footwear Market Trends Analysis (2020-2032)
8.3.2 Footwear Market Size Estimates and Forecasts to 2032 (USD Billion)
8.4 Industrial Rubber Goods
8.4.1 Industrial Rubber Goods Market Trends Analysis (2020-2032)
8.4.2 Industrial Rubber Goods Market Size Estimates and Forecasts to 2032 (USD Billion)
8.5 Adhesives & Sealants
8.5.1 Adhesives & Sealants Market Trends Analysis (2020-2032)
8.5.2 Adhesives & Sealants Market Size Estimates and Forecasts to 2032 (USD Billion)
8.6 Others
8.6.1 Others Market Trends Analysis (2020-2032)
8.6.2 Others Market Size Estimates and Forecasts to 2032 (USD Billion)
9. Insoluble Sulfur Market Segmentation, by End-Use Industry
9.1 Chapter Overview
9.2 Automotive
9.2.1 Automotive Market Trends Analysis (2020-2032)
9.2.2 Automotive Market Size Estimates and Forecasts to 2032 (USD Billion)
9.3 Construction
9.3.1 Construction Market Trends Analysis (2020-2032)
9.3.2 Construction Market Size Estimates and Forecasts to 2032 (USD Billion)
9.4 Aerospace
9.4.1 Aerospace Market Trends Analysis (2020-2032)
9.4.2 Aerospace Market Size Estimates and Forecasts to 2032 (USD Billion)
9.5 Chemical & Petrochemical
9.5.1 Chemical & Petrochemical Market Trends Analysis (2020-2032)
9.5.2 Chemical & Petrochemical Market Size Estimates and Forecasts to 2032 (USD Billion)
9.6 Others
9.6.1 Others Market Trends Analysis (2020-2032)
9.6.2 Others Market Size Estimates and Forecasts to 2032 (USD Billion)
10. Regional Analysis
10.1 Chapter Overview
10.2 North America
10.2.1 Trends Analysis
10.2.2 North America Insoluble Sulfur Market Estimates and Forecasts, by Country (2020-2032) (USD Billion)
10.2.3 North America Insoluble Sulfur Market Estimates and Forecasts, by Grade (2020-2032) (USD Billion)
10.2.4 North America Insoluble Sulfur Market Estimates and Forecasts, by Application (2020-2032) (USD Billion)
10.2.5 North America Insoluble Sulfur Market Estimates and Forecasts, by End-Use Industry (2020-2032) (USD Billion)
10.2.6 USA
10.2.6.1 USA Insoluble Sulfur Market Estimates and Forecasts, by Grade (2020-2032) (USD Billion)
10.2.6.2 USA Insoluble Sulfur Market Estimates and Forecasts, by Application (2020-2032) (USD Billion)
10.2.6.3 USA Insoluble Sulfur Market Estimates and Forecasts, by End-Use Industry (2020-2032) (USD Billion)
10.2.7 Canada
10.2.7.1 Canada Insoluble Sulfur Market Estimates and Forecasts, by Grade (2020-2032) (USD Billion)
10.2.7.2 Canada Insoluble Sulfur Market Estimates and Forecasts, by Application (2020-2032) (USD Billion)
10.2.7.3 Canada Insoluble Sulfur Market Estimates and Forecasts, by End-Use Industry (2020-2032) (USD Billion)
10.2.8 Mexico
10.2.8.1 Mexico Insoluble Sulfur Market Estimates and Forecasts, by Grade (2020-2032) (USD Billion)
10.2.8.2 Mexico Insoluble Sulfur Market Estimates and Forecasts, by Application (2020-2032) (USD Billion)
10.2.8.3 Mexico Insoluble Sulfur Market Estimates and Forecasts, by End-Use Industry (2020-2032) (USD Billion)
10.3 Europe
10.3.1 Eastern Europe
10.3.1.1 Trends Analysis
10.3.1.2 Eastern Europe Insoluble Sulfur Market Estimates and Forecasts, by Country (2020-2032) (USD Billion)
10.3.1.3 Eastern Europe Insoluble Sulfur Market Estimates and Forecasts, by Grade (2020-2032) (USD Billion)
10.3.1.4 Eastern Europe Insoluble Sulfur Market Estimates and Forecasts, by Application (2020-2032) (USD Billion)
10.3.1.5 Eastern Europe Insoluble Sulfur Market Estimates and Forecasts, by End-Use Industry (2020-2032) (USD Billion)
10.3.1.6 Poland
10.3.1.6.1 Poland Insoluble Sulfur Market Estimates and Forecasts, by Grade (2020-2032) (USD Billion)
10.3.1.6.2 Poland Insoluble Sulfur Market Estimates and Forecasts, by Application (2020-2032) (USD Billion)
10.3.1.6.3 Poland Insoluble Sulfur Market Estimates and Forecasts, by End-Use Industry (2020-2032) (USD Billion)
10.3.1.7 Romania
10.3.1.7.1 Romania Insoluble Sulfur Market Estimates and Forecasts, by Grade (2020-2032) (USD Billion)
10.3.1.7.2 Romania Insoluble Sulfur Market Estimates and Forecasts, by Application (2020-2032) (USD Billion)
10.3.1.7.3 Romania Insoluble Sulfur Market Estimates and Forecasts, by End-Use Industry (2020-2032) (USD Billion)
10.3.1.8 Hungary
10.3.1.8.1 Hungary Insoluble Sulfur Market Estimates and Forecasts, by Grade (2020-2032) (USD Billion)
10.3.1.8.2 Hungary Insoluble Sulfur Market Estimates and Forecasts, by Application (2020-2032) (USD Billion)
10.3.1.8.3 Hungary Insoluble Sulfur Market Estimates and Forecasts, by End-Use Industry (2020-2032) (USD Billion)
10.3.1.9 Turkey
10.3.1.9.1 Turkey Insoluble Sulfur Market Estimates and Forecasts, by Grade (2020-2032) (USD Billion)
10.3.1.9.2 Turkey Insoluble Sulfur Market Estimates and Forecasts, by Application (2020-2032) (USD Billion)
10.3.1.9.3 Turkey Insoluble Sulfur Market Estimates and Forecasts, by End-Use Industry (2020-2032) (USD Billion)
10.3.1.10 Rest of Eastern Europe
10.3.1.10.1 Rest of Eastern Europe Insoluble Sulfur Market Estimates and Forecasts, by Grade (2020-2032) (USD Billion)
10.3.1.10.2 Rest of Eastern Europe Insoluble Sulfur Market Estimates and Forecasts, by Application (2020-2032) (USD Billion)
10.3.1.10.3 Rest of Eastern Europe Insoluble Sulfur Market Estimates and Forecasts, by End-Use Industry (2020-2032) (USD Billion)
10.3.2 Western Europe
10.3.2.1 Trends Analysis
10.3.2.2 Western Europe Insoluble Sulfur Market Estimates and Forecasts, by Country (2020-2032) (USD Billion)
10.3.2.3 Western Europe Insoluble Sulfur Market Estimates and Forecasts, by Grade (2020-2032) (USD Billion)
10.3.2.4 Western Europe Insoluble Sulfur Market Estimates and Forecasts, by Application (2020-2032) (USD Billion)
10.3.2.5 Western Europe Insoluble Sulfur Market Estimates and Forecasts, by End-Use Industry (2020-2032) (USD Billion)
10.3.2.6 Germany
10.3.2.6.1 Germany Insoluble Sulfur Market Estimates and Forecasts, by Grade (2020-2032) (USD Billion)
10.3.2.6.2 Germany Insoluble Sulfur Market Estimates and Forecasts, by Application (2020-2032) (USD Billion)
10.3.2.6.3 Germany Insoluble Sulfur Market Estimates and Forecasts, by End-Use Industry (2020-2032) (USD Billion)
10.3.2.7 France
10.3.2.7.1 France Insoluble Sulfur Market Estimates and Forecasts, by Grade (2020-2032) (USD Billion)
10.3.2.7.2 France Insoluble Sulfur Market Estimates and Forecasts, by Application (2020-2032) (USD Billion)
10.3.2.7.3 France Insoluble Sulfur Market Estimates and Forecasts, by End-Use Industry (2020-2032) (USD Billion)
10.3.2.8 UK
10.3.2.8.1 UK Insoluble Sulfur Market Estimates and Forecasts, by Grade (2020-2032) (USD Billion)
10.3.2.8.2 UK Insoluble Sulfur Market Estimates and Forecasts, by Application (2020-2032) (USD Billion)
10.3.2.8.3 UK Insoluble Sulfur Market Estimates and Forecasts, by End-Use Industry (2020-2032) (USD Billion)
10.3.2.9 Italy
10.3.2.9.1 Italy Insoluble Sulfur Market Estimates and Forecasts, by Grade (2020-2032) (USD Billion)
10.3.2.9.2 Italy Insoluble Sulfur Market Estimates and Forecasts, by Application (2020-2032) (USD Billion)
10.3.2.9.3 Italy Insoluble Sulfur Market Estimates and Forecasts, by End-Use Industry (2020-2032) (USD Billion)
10.3.2.10 Spain
10.3.2.10.1 Spain Insoluble Sulfur Market Estimates and Forecasts, by Grade (2020-2032) (USD Billion)
10.3.2.10.2 Spain Insoluble Sulfur Market Estimates and Forecasts, by Application (2020-2032) (USD Billion)
10.3.2.10.3 Spain Insoluble Sulfur Market Estimates and Forecasts, by End-Use Industry (2020-2032) (USD Billion)
10.3.2.11 Netherlands
10.3.2.11.1 Netherlands Insoluble Sulfur Market Estimates and Forecasts, by Grade (2020-2032) (USD Billion)
10.3.2.11.2 Netherlands Insoluble Sulfur Market Estimates and Forecasts, by Application (2020-2032) (USD Billion)
10.3.2.11.3 Netherlands Insoluble Sulfur Market Estimates and Forecasts, by End-Use Industry (2020-2032) (USD Billion)
10.3.2.12 Switzerland
10.3.2.12.1 Switzerland Insoluble Sulfur Market Estimates and Forecasts, by Grade (2020-2032) (USD Billion)
10.3.2.12.2 Switzerland Insoluble Sulfur Market Estimates and Forecasts, by Application (2020-2032) (USD Billion)
10.3.2.12.3 Switzerland Insoluble Sulfur Market Estimates and Forecasts, by End-Use Industry (2020-2032) (USD Billion)
10.3.2.13 Austria
10.3.2.13.1 Austria Insoluble Sulfur Market Estimates and Forecasts, by Grade (2020-2032) (USD Billion)
10.3.2.13.2 Austria Insoluble Sulfur Market Estimates and Forecasts, by Application (2020-2032) (USD Billion)
10.3.2.13.3 Austria Insoluble Sulfur Market Estimates and Forecasts, by End-Use Industry (2020-2032) (USD Billion)
10.3.2.14 Rest of Western Europe
10.3.2.14.1 Rest of Western Europe Insoluble Sulfur Market Estimates and Forecasts, by Grade (2020-2032) (USD Billion)
10.3.2.14.2 Rest of Western Europe Insoluble Sulfur Market Estimates and Forecasts, by Application (2020-2032) (USD Billion)
10.3.2.14.3 Rest of Western Europe Insoluble Sulfur Market Estimates and Forecasts, by End-Use Industry (2020-2032) (USD Billion)
10.4 Asia Pacific
10.4.1 Trends Analysis
10.4.2 Asia Pacific Insoluble Sulfur Market Estimates and Forecasts, by Country (2020-2032) (USD Billion)
10.4.3 Asia Pacific Insoluble Sulfur Market Estimates and Forecasts, by Grade (2020-2032) (USD Billion)
10.4.4 Asia Pacific Insoluble Sulfur Market Estimates and Forecasts, by Application (2020-2032) (USD Billion)
10.4.5 Asia Pacific Insoluble Sulfur Market Estimates and Forecasts, by End-Use Industry (2020-2032) (USD Billion)
10.4.6 China
10.4.6.1 China Insoluble Sulfur Market Estimates and Forecasts, by Grade (2020-2032) (USD Billion)
10.4.6.2 China Insoluble Sulfur Market Estimates and Forecasts, by Application (2020-2032) (USD Billion)
10.4.6.3 China Insoluble Sulfur Market Estimates and Forecasts, by End-Use Industry (2020-2032) (USD Billion)
10.4.7 India
10.4.7.1 India Insoluble Sulfur Market Estimates and Forecasts, by Grade (2020-2032) (USD Billion)
10.4.7.2 India Insoluble Sulfur Market Estimates and Forecasts, by Application (2020-2032) (USD Billion)
10.4.7.3 India Insoluble Sulfur Market Estimates and Forecasts, by End-Use Industry (2020-2032) (USD Billion)
10.4.8 Japan
10.4.8.1 Japan Insoluble Sulfur Market Estimates and Forecasts, by Grade (2020-2032) (USD Billion)
10.4.8.2 Japan Insoluble Sulfur Market Estimates and Forecasts, by Application (2020-2032) (USD Billion)
10.4.8.3 Japan Insoluble Sulfur Market Estimates and Forecasts, by End-Use Industry (2020-2032) (USD Billion)
10.4.9 South Korea
10.4.9.1 South Korea Insoluble Sulfur Market Estimates and Forecasts, by Grade (2020-2032) (USD Billion)
10.4.9.2 South Korea Insoluble Sulfur Market Estimates and Forecasts, by Application (2020-2032) (USD Billion)
10.4.9.3 South Korea Insoluble Sulfur Market Estimates and Forecasts, by End-Use Industry (2020-2032) (USD Billion)
10.4.10 Vietnam
10.4.10.1 Vietnam Insoluble Sulfur Market Estimates and Forecasts, by Grade (2020-2032) (USD Billion)
10.4.10.2 Vietnam Insoluble Sulfur Market Estimates and Forecasts, by Application (2020-2032) (USD Billion)
10.4.10.3 Vietnam Insoluble Sulfur Market Estimates and Forecasts, by End-Use Industry (2020-2032) (USD Billion)
10.4.11 Singapore
10.4.11.1 Singapore Insoluble Sulfur Market Estimates and Forecasts, by Grade (2020-2032) (USD Billion)
10.4.11.2 Singapore Insoluble Sulfur Market Estimates and Forecasts, by Application (2020-2032) (USD Billion)
10.4.11.3 Singapore Insoluble Sulfur Market Estimates and Forecasts, by End-Use Industry (2020-2032) (USD Billion)
10.4.12 Australia
10.4.12.1 Australia Insoluble Sulfur Market Estimates and Forecasts, by Grade (2020-2032) (USD Billion)
10.4.12.2 Australia Insoluble Sulfur Market Estimates and Forecasts, by Application (2020-2032) (USD Billion)
10.4.12.3 Australia Insoluble Sulfur Market Estimates and Forecasts, by End-Use Industry (2020-2032) (USD Billion)
10.4.13 Rest of Asia Pacific
10.4.13.1 Rest of Asia Pacific Insoluble Sulfur Market Estimates and Forecasts, by Grade (2020-2032) (USD Billion)
10.4.13.2 Rest of Asia Pacific Insoluble Sulfur Market Estimates and Forecasts, by Application (2020-2032) (USD Billion)
10.4.13.3 Rest of Asia Pacific Insoluble Sulfur Market Estimates and Forecasts, by End-Use Industry (2020-2032) (USD Billion)
10.5 Middle East and Africa
10.5.1 Middle East
10.5.1.1 Trends Analysis
10.5.1.2 Middle East Insoluble Sulfur Market Estimates and Forecasts, by Country (2020-2032) (USD Billion)
10.5.1.3 Middle East Insoluble Sulfur Market Estimates and Forecasts, by Grade (2020-2032) (USD Billion)
10.5.1.4 Middle East Insoluble Sulfur Market Estimates and Forecasts, by Application (2020-2032) (USD Billion)
10.5.1.5 Middle East Insoluble Sulfur Market Estimates and Forecasts, by End-Use Industry (2020-2032) (USD Billion)
10.5.1.6 UAE
10.5.1.6.1 UAE Insoluble Sulfur Market Estimates and Forecasts, by Grade (2020-2032) (USD Billion)
10.5.1.6.2 UAE Insoluble Sulfur Market Estimates and Forecasts, by Application (2020-2032) (USD Billion)
10.5.1.6.3 UAE Insoluble Sulfur Market Estimates and Forecasts, by End-Use Industry (2020-2032) (USD Billion)
10.5.1.7 Egypt
10.5.1.7.1 Egypt Insoluble Sulfur Market Estimates and Forecasts, by Grade (2020-2032) (USD Billion)
10.5.1.7.2 Egypt Insoluble Sulfur Market Estimates and Forecasts, by Application (2020-2032) (USD Billion)
10.5.1.7.3 Egypt Insoluble Sulfur Market Estimates and Forecasts, by End-Use Industry (2020-2032) (USD Billion)
10.5.1.8 Saudi Arabia
10.5.1.8.1 Saudi Arabia Insoluble Sulfur Market Estimates and Forecasts, by Grade (2020-2032) (USD Billion)
10.5.1.8.2 Saudi Arabia Insoluble Sulfur Market Estimates and Forecasts, by Application (2020-2032) (USD Billion)
10.5.1.8.3 Saudi Arabia Insoluble Sulfur Market Estimates and Forecasts, by End-Use Industry (2020-2032) (USD Billion)
10.5.1.9 Qatar
10.5.1.9.1 Qatar Insoluble Sulfur Market Estimates and Forecasts, by Grade (2020-2032) (USD Billion)
10.5.1.9.2 Qatar Insoluble Sulfur Market Estimates and Forecasts, by Application (2020-2032) (USD Billion)
10.5.1.9.3 Qatar Insoluble Sulfur Market Estimates and Forecasts, by End-Use Industry (2020-2032) (USD Billion)
10.5.1.10 Rest of Middle East
10.5.1.10.1 Rest of Middle East Insoluble Sulfur Market Estimates and Forecasts, by Grade (2020-2032) (USD Billion)
10.5.1.10.2 Rest of Middle East Insoluble Sulfur Market Estimates and Forecasts, by Application (2020-2032) (USD Billion)
10.5.1.10.3 Rest of Middle East Insoluble Sulfur Market Estimates and Forecasts, by End-Use Industry (2020-2032) (USD Billion)
10.5.2 Africa
10.5.2.1 Trends Analysis
10.5.2.2 Africa Insoluble Sulfur Market Estimates and Forecasts, by Country (2020-2032) (USD Billion)
10.5.2.3 Africa Insoluble Sulfur Market Estimates and Forecasts, by Grade (2020-2032) (USD Billion)
10.5.2.4 Africa Insoluble Sulfur Market Estimates and Forecasts, by Application (2020-2032) (USD Billion)
10.5.2.5 Africa Insoluble Sulfur Market Estimates and Forecasts, by End-Use Industry (2020-2032) (USD Billion)
10.5.2.6 South Africa
10.5.2.6.1 South Africa Insoluble Sulfur Market Estimates and Forecasts, by Grade (2020-2032) (USD Billion)
10.5.2.6.2 South Africa Insoluble Sulfur Market Estimates and Forecasts, by Application (2020-2032) (USD Billion)
10.5.2.6.3 South Africa Insoluble Sulfur Market Estimates and Forecasts, by End-Use Industry (2020-2032) (USD Billion)
10.5.2.7 Nigeria
10.5.2.7.1 Nigeria Insoluble Sulfur Market Estimates and Forecasts, by Grade (2020-2032) (USD Billion)
10.5.2.7.2 Nigeria Insoluble Sulfur Market Estimates and Forecasts, by Application (2020-2032) (USD Billion)
10.5.2.7.3 Nigeria Insoluble Sulfur Market Estimates and Forecasts, by End-Use Industry (2020-2032) (USD Billion)
10.5.2.8 Rest of Africa
10.5.2.8.1 Rest of Africa Insoluble Sulfur Market Estimates and Forecasts, by Grade (2020-2032) (USD Billion)
10.5.2.8.2 Rest of Africa Insoluble Sulfur Market Estimates and Forecasts, by Application (2020-2032) (USD Billion)
10.5.2.8.3 Rest of Africa Insoluble Sulfur Market Estimates and Forecasts, by End-Use Industry (2020-2032) (USD Billion)
10.6 Latin America
10.6.1 Trends Analysis
10.6.2 Latin America Insoluble Sulfur Market Estimates and Forecasts, by Country (2020-2032) (USD Billion)
10.6.3 Latin America Insoluble Sulfur Market Estimates and Forecasts, by Grade (2020-2032) (USD Billion)
10.6.4 Latin America Insoluble Sulfur Market Estimates and Forecasts, by Application (2020-2032) (USD Billion)
10.6.5 Latin America Insoluble Sulfur Market Estimates and Forecasts, by End-Use Industry (2020-2032) (USD Billion)
10.6.6 Brazil
10.6.6.1 Brazil Insoluble Sulfur Market Estimates and Forecasts, by Grade (2020-2032) (USD Billion)
10.6.6.2 Brazil Insoluble Sulfur Market Estimates and Forecasts, by Application (2020-2032) (USD Billion)
10.6.6.3 Brazil Insoluble Sulfur Market Estimates and Forecasts, by End-Use Industry (2020-2032) (USD Billion)
10.6.7 Argentina
10.6.7.1 Argentina Insoluble Sulfur Market Estimates and Forecasts, by Grade (2020-2032) (USD Billion)
10.6.7.2 Argentina Insoluble Sulfur Market Estimates and Forecasts, by Application (2020-2032) (USD Billion)
10.6.7.3 Argentina Insoluble Sulfur Market Estimates and Forecasts, by End-Use Industry (2020-2032) (USD Billion)
10.6.8 Colombia
10.6.8.1 Colombia Insoluble Sulfur Market Estimates and Forecasts, by Grade (2020-2032) (USD Billion)
10.6.8.2 Colombia Insoluble Sulfur Market Estimates and Forecasts, by Application (2020-2032) (USD Billion)
10.6.8.3 Colombia Insoluble Sulfur Market Estimates and Forecasts, by End-Use Industry (2020-2032) (USD Billion)
10.6.9 Rest of Latin America
10.6.9.1 Rest of Latin America Insoluble Sulfur Market Estimates and Forecasts, by Grade (2020-2032) (USD Billion)
10.6.9.2 Rest of Latin America Insoluble Sulfur Market Estimates and Forecasts, by Application (2020-2032) (USD Billion)
10.6.9.3 Rest of Latin America Insoluble Sulfur Market Estimates and Forecasts, by End-Use Industry (2020-2032) (USD Billion)
11. Company Profiles
11.1 Oriental Carbon & Chemicals Ltd. (OCCL)
11.1.1 Company Overview
11.1.2 Financial
11.1.3 Products/ Services Offered
11.1.4 SWOT Analysis
11.2 Eastman Chemical Company
11.2.1 Company Overview
11.2.2 Financial
11.2.3 Products/ Services Offered
11.2.4 SWOT Analysis
11.3 China Sunsine Chemical Holdings Ltd.
11.3.1 Company Overview
11.3.2 Financial
11.3.3 Products/ Services Offered
11.3.4 SWOT Analysis
11.4 Shikoku Chemicals Corporation
11.4.1 Company Overview
11.4.2 Financial
11.4.3 Products/ Services Offered
11.4.4 SWOT Analysis
11.5 Henan Kailun Chemical Co., Ltd.
11.5.1 Company Overview
11.5.2 Financial
11.5.3 Products/ Services Offered
11.5.4 SWOT Analysis
11.6 Ningbo Actmix Rubber Chemicals Co., Ltd.
11.6.1 Company Overview
11.6.2 Financial
11.6.3 Products/ Services Offered
11.6.4 SWOT Analysis
11.7 Grupa Azoty S.A.
11.7.1 Company Overview
11.7.2 Financial
11.7.3 Products/ Services Offered
11.7.4 SWOT Analysis
11.8 Kuantum Corp
11.8.1 Company Overview
11.8.2 Financial
11.8.3 Products/ Services Offered
11.8.4 SWOT Analysis
11.9 Pelican Rubber Ltd.
11.9.1 Company Overview
11.9.2 Financial
11.9.3 Products/ Services Offered
11.9.4 SWOT Analysis
11.10 Lanxess AG
11.10.1 Company Overview
11.10.2 Financial
11.10.3 Products/ Services Offered
11.10.4 SWOT Analysis
12. Use Cases and Best Practices
13. Conclusion
An accurate research report requires proper strategizing as well as implementation. There are multiple factors involved in the completion of good and accurate research report and selecting the best methodology to compete the research is the toughest part. Since the research reports we provide play a crucial role in any company’s decision-making process, therefore we at SNS Insider always believe that we should choose the best method which gives us results closer to reality. This allows us to reach at a stage wherein we can provide our clients best and accurate investment to output ratio.
Each report that we prepare takes a timeframe of 350-400 business hours for production. Starting from the selection of titles through a couple of in-depth brain storming session to the final QC process before uploading our titles on our website we dedicate around 350 working hours. The titles are selected based on their current market cap and the foreseen CAGR and growth.
The 5 steps process:
Step 1: Secondary Research:
Secondary Research or Desk Research is as the name suggests is a research process wherein, we collect data through the readily available information. In this process we use various paid and unpaid databases which our team has access to and gather data through the same. This includes examining of listed companies’ annual reports, Journals, SEC filling etc. Apart from this our team has access to various associations across the globe across different industries. Lastly, we have exchange relationships with various university as well as individual libraries.

Step 2: Primary Research
When we talk about primary research, it is a type of study in which the researchers collect relevant data samples directly, rather than relying on previously collected data. This type of research is focused on gaining content specific facts that can be sued to solve specific problems. Since the collected data is fresh and first hand therefore it makes the study more accurate and genuine.
We at SNS Insider have divided Primary Research into 2 parts.
Part 1 wherein we interview the KOLs of major players as well as the upcoming ones across various geographic regions. This allows us to have their view over the market scenario and acts as an important tool to come closer to the accurate market numbers. As many as 45 paid and unpaid primary interviews are taken from both the demand and supply side of the industry to make sure we land at an accurate judgement and analysis of the market.
This step involves the triangulation of data wherein our team analyses the interview transcripts, online survey responses and observation of on filed participants. The below mentioned chart should give a better understanding of the part 1 of the primary interview.

Part 2: In this part of primary research the data collected via secondary research and the part 1 of the primary research is validated with the interviews from individual consultants and subject matter experts.
Consultants are those set of people who have at least 12 years of experience and expertise within the industry whereas Subject Matter Experts are those with at least 15 years of experience behind their back within the same space. The data with the help of two main processes i.e., FGDs (Focused Group Discussions) and IDs (Individual Discussions). This gives us a 3rd party nonbiased primary view of the market scenario making it a more dependable one while collation of the data pointers.
Step 3: Data Bank Validation
Once all the information is collected via primary and secondary sources, we run that information for data validation. At our intelligence centre our research heads track a lot of information related to the market which includes the quarterly reports, the daily stock prices, and other relevant information. Our data bank server gets updated every fortnight and that is how the information which we collected using our primary and secondary information is revalidated in real time.

Step 4: QA/QC Process
After all the data collection and validation our team does a final level of quality check and quality assurance to get rid of any unwanted or undesired mistakes. This might include but not limited to getting rid of the any typos, duplication of numbers or missing of any important information. The people involved in this process include technical content writers, research heads and graphics people. Once this process is completed the title gets uploader on our platform for our clients to read it.
Step 5: Final QC/QA Process:
This is the last process and comes when the client has ordered the study. In this process a final QA/QC is done before the study is emailed to the client. Since we believe in giving our clients a good experience of our research studies, therefore, to make sure that we do not lack at our end in any way humanly possible we do a final round of quality check and then dispatch the study to the client.
Key Segments:
By Grade
High Thermal Stability (HTS)
Medium Thermal Stability (MTS)
Regular Grade
By Application
Tire Manufacturing
Footwear
Industrial Rubber Goods
Adhesives & Sealants
Others
By End-Use Industry
Automotive
Construction
Aerospace
Chemical & Petrochemical
Others
Request for Segment Customization as per your Business Requirement: Segment Customization Request
Regional Coverage:
North America
US
Canada
Mexico
Europe
Eastern Europe
Poland
Romania
Hungary
Turkey
Rest of Eastern Europe
Western Europe
Germany
France
UK
Italy
Spain
Netherlands
Switzerland
Austria
Rest of Western Europe
Asia Pacific
China
India
Japan
South Korea
Vietnam
Singapore
Australia
Rest of Asia Pacific
Middle East & Africa
Middle East
UAE
Egypt
Saudi Arabia
Qatar
Rest of Middle East
Africa
Nigeria
South Africa
Rest of Africa
Latin America
Brazil
Argentina
Colombia
Rest of Latin America
Request for Country Level Research Report: Country Level Customization Request
Available Customization
With the given market data, SNS Insider offers customization as per the company’s specific needs. The following customization options are available for the report:
Detailed Volume Analysis
Criss-Cross segment analysis (e.g. Product X Application)
Competitive Product Benchmarking
Geographic Analysis
Additional countries in any of the regions
Customized Data Representation
Detailed analysis and profiling of additional market players
Biocompatible Coatings Market was valued at USD 16.23 Billion in 2023 and is expected to reach USD 41.18 Billion by 2032, at a CAGR of 10.90% from 2024-2032.
Erosion and Sediment Control Market was USD 3.5 billion in 2023 and is expected to reach USD 5.9 billion by 2032, growing at a CAGR of 6.1% from 2024-2032.
Sulfuric Acid Market was valued at USD 15.7 Billion in 2023. It is expected to grow to USD 50.7 Billion by 2032, growing at a CAGR of 13.8% from 2024-2032.
Roof Coating Market was valued at USD 2.66 Billion in 2023 and is expected to reach USD 3.64 Billion by 2032, growing at a CAGR of 3.54% from 2024 to 2032.
The Chelating Agents Market size was USD 6.36 billion in 2023 and is expected to reach USD 9.19 billion by 2032 and grow at a CAGR of 4.16% over the forecast period of 2024-2032.
Silicone Surfactants Market was valued at USD 1.9 Billion in 2023 and is expected to grow to USD 2.8 Billion by 2032, growing at a CAGR of 4.5% from 2024-2032.

Hi! Click one of our member below to chat on Phone
© 2025 All Rights Reserved by SNS Insider Pvt Ltd


