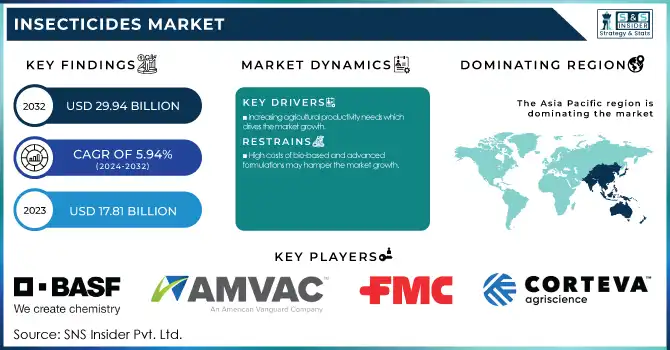
The Insecticides Market size was USD 17.81 Billion in 2023 and is expected to reach USD 29.94 Billion by 2032 and grow at a CAGR of 5.94 % over the forecast period of 2024-2032. This report provides statistical insights and trends in the Insecticides Market, covering production volume and utilization by country and type in 2023 and active ingredient pricing trends across key regions. It examines the regulatory landscape, highlighting bans and regional restrictions on specific insecticides. Additionally, the report explores environmental and toxicity metrics, including residue levels, soil and water contamination, and sustainability efforts. It delves into innovation and R&D investments in bio-based and synthetic insecticides, reflecting the industry's shift toward eco-friendly solutions. The study also evaluates the adoption of precision application technologies and digital pest management systems by region. These insights help stakeholders understand market dynamics, regulatory changes, and technological advancements shaping the insecticide sector.
Drivers
Increasing agricultural productivity needs which drives the market growth.
The world population increasing, there is a need to increase the agricultural productivity to meet the food security. Facing challenges like land degradation, loss of soil fertility and unpredictability of climate elements, farmers are compelled to produce maximum yield from every inch of land. Insect pests are one of the great enemies of the health of crops, and, if they are not controlled in an adequate way, they can cause very significant losses for farmers. This has led to a high demand for insecticides (to protect crops from pests) in order to keep agricultural production at a high rate. Also, with natural scarcity of arable land the farmers are adopting intensive farming practices where insecticides perform a decisive role in productivity augmentation by facilitating effective pest control. In parallel, governments and agricultural organizations are advocating the utilization of novel chemistries and integrated pest management approaches as a pathway to increasing food production and security.
Restraint
High costs of bio-based and advanced formulations may hamper the market growth.
Increasing environmental concerns and stringent regulations on chemical pesticides have led to the increasing shift towards eco-friendly and bio-based insecticides. The major roadblock to the widespread use of these custom formulations – especially for small- and medium-scale farmers is the expense. Manufacturing costs are more expensive and because of this, the production of bio-based insecticides involves extraction, fermentation, and stabilization processes as well. Furthermore, the development of new insecticide products, including nano insecticides and microencapsulation technologies, sets high financial costs, significantly influencing product pricing. The more limited production scale and distribution difficulty over pricing issues also make the bio-based alternatives not as competitive as traditional synthetic insecticides.
Opportunity
A growing international trade of agricultural products, coupled with a growing recognition of the need for food security, is fueling the demand for effective insecticides for stored product protection. Insect pests on grains, cereals, pulses, and other storage commodities often lead to post-harvest losses, which in turn cause huge economic losses to farmers, food processors, and supply chain operators. Increasing urbanization and new specifications regarding methods of assault are probably to lead to the maximization of the pest control market for wholesalers, silos, and storage progress facilities. Moreover, strict food safety regulations and quality standards are driving the adoption of insecticides which give long-lasting protection against pests without compromising the integrity of the products. Emerging fumigant, IGR, and residue-free formulations are paving the way for market players to develop better-fit solutions for post-harvest pest control.
Challenges
The market for insecticides and insect pest control is invariably linked with the availability and price of materials such as active ingredients, solvents, and stabilizers, Production costs of manufacturers are highly impacted by price volatility in key raw materials, which can be attributed to multitude of factors including geopolitical tensions, trade restrictions, and fluctuations in crude oil prices. Supply chain disruptions due to shipping delays, labor shortages, and even government actions like bans on transporting certain chemicals can also make it difficult for products to get to market in the first place. Thus, the insecticide market players are combating these uncertainties through alternative sourcing, optimized inventory, and localized production to overcome risks from raw material price and supply chain fluctuations.
By Type
Organophosphate segment held the largest market share around 28% in 2023. owing to the broad-spectrum efficacy of these products and their cost-effectiveness, which makes them popular among farmers worldwide. They disrupt the nervous system of the pest, making them effective against many insects including aphids, caterpillars, and beetles. Due to its inherent ability to act fast and the quick environmental degradation compared to organochlorines this agricultural pesticide the widely used in crop protection. In addition to that, organophosphates are useful pre-harvest and post-harvest based on their wide application, which is essential to obtain the maximum yield & food security.
By Application
The cereals and grains segment held the largest market share around 40% in 2023. It is a widely cultivated and economically important crop, also susceptible to pest infestations globally. Wheat, rice, maize, and barley are major crops that serve as staple foods for much of the world's population, thus protection of these traits is important for food security. Crops are also vulnerable to many insect stem borers, aphids, armyworms, and weevils are the commonest, and yields withstand the widespread application of insecticides to avert loss. The demand for cereals and grains in industrialized countries has been further accelerated by the growing needs of animal feed, biofuel production, and processed food industries thus, increasing the growth of pest control market value addition.
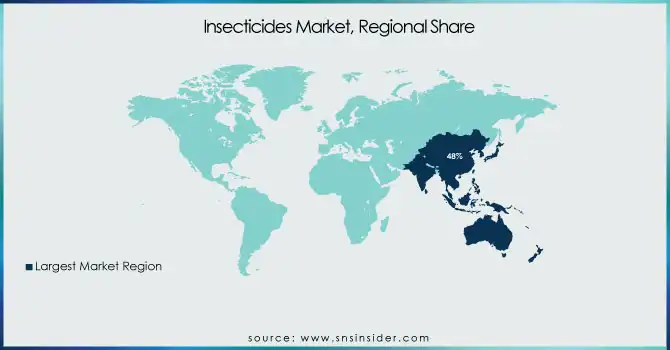
Asia Pacific held the largest market share around 48% in 2023. It is due to the vast agricultural land with multiple crops cultivated in a single season and increasing people attracts the region in producing a large quantity of edible food. Being some of the largest producers of rice, wheat, and maize globally, countries such as China, India, and Indonesia require effective pest control solutions to limit crop losses. The climate of the region is predominantly tropical and subtropical, which provides an ideal environment for the occurrence of insects, thereby, driving the growth of the insecticide market. Meanwhile, a growing population coupled with an increasing demand for food has encouraged governments to adopt measures to improve agricultural output through increased subsidies and pest management programs. The strength of the region is complemented by the presence of large agrochemical companies along with lower production costs and increasing agricultural exports. In addition, continuous development of bio-based and bio-degradable insecticides is being examined which seem to be facilitating and maintaining the market growth in the future.
The insecticide market in North America is prominent due to large commercial farms, advanced technology practiced in crop cultivation, and the government implementing strict guidelines for protecting crops in the region. Due to the high vulnerability of crops like corn, soybeans, and wheat, high demand for pest control solutions is generated with the USA and Canada being high producers of such crops. Further adding strength to this market are lagging agrochemical companies like Corteva Agriscience, FMC Corporation, and Bayer CropScience, who are relentless in developing innovative insecticide formulations, bio-based and precision-targeted solutions to stay competitive in insecticide formulations.
AMVAC Chemical Corp. (Orthene, Naled)
UPL Ltd. (Phoskill, Ulala)
Bayer AG (Confidor, Decis)
BASF SE (Nealta, Alverde)
FMC Corp. (Brigade, Talstar)
Corteva Agriscience (Intrepid, Radiant)
Nufarm Ltd. (Assail, Triadimefon)
Bioworks, Inc. (BotaniGard, Mycotrol)
Syngenta Group (Actara, Karate)
Sumitomo Chemical (Sumithion, Danitol)
Adama Agricultural Solutions (Mavrik, Pyrinex)
Valent BioSciences (DiPel, XenTari)
Mitsui Chemicals Agro, Inc. (Trebon, Albarin)
Gowan Company (Ecozin, PyGanic)
Nippon Soda Co., Ltd. (Mospilan, Nichino)
Helm AG (Helmstar, HelmForce)
Isagro S.p.A. (Azatin, Domark)
Rotam Global AgroSciences (Lambda, Bifenthrin)
Rallis India Ltd. (Asataf, Nova)
PI Industries Ltd. (Osheen, Nominee Gold)
In 2024, Bayer CropScience AG announced its plan to launch the world’s first bioinsecticide for arable crops, developed in partnership with AlphaBio Control. This innovative solution aims to help farmers manage pests sustainably while reducing environmental impact.
In 2023, ADAMA introduced Almada, a fungicide formulated with fluxapyroxade, mancozeb, and prothioconazole to combat soybean diseases in Brazil. This innovative solution offers broad-spectrum disease control, enhancing crop protection and yield.
In 2023, BASF began the registration process for Prexio Active, a new insecticide designed to control all four rice hopper species effectively. This development aims to enhance pest management in rice cultivation, improving yield protection.
Report Attributes | Details |
---|---|
Market Size in 2023 | USD 17.81 Billion |
Market Size by 2032 | USD 29.94 Billion |
CAGR | CAGR of5.94% From 2024 to 2032 |
Base Year | 2023 |
Forecast Period | 2024-2032 |
Historical Data | 2020-2022 |
Report Scope & Coverage | Market Size, Segments Analysis, Competitive Landscape, Regional Analysis, DROC & SWOT Analysis, Forecast Outlook |
Key Segments | • By Type (Pyrethroids, Organophosphates, Carbamates, Chlorinated Hydrocarbons, Botanical, Others) • By Application, (Cereals & Grains, Oilseeds & Pulses, Fruits & Vegetables, Others) |
Regional Analysis/Coverage | North America (US, Canada, Mexico), Europe (Eastern Europe [Poland, Romania, Hungary, Turkey, Rest of Eastern Europe] Western Europe] Germany, France, UK, Italy, Spain, Netherlands, Switzerland, Austria, Rest of Western Europe]), Asia Pacific (China, India, Japan, South Korea, Vietnam, Singapore, Australia, Rest of Asia Pacific), Middle East & Africa (Middle East [UAE, Egypt, Saudi Arabia, Qatar, Rest of Middle East], Africa [Nigeria, South Africa, Rest of Africa], Latin America (Brazil, Argentina, Colombia, Rest of Latin America) |
Company Profiles | AMVAC Chemical Corp., UPL Ltd., Bayer AG, BASF SE, FMC Corp., Corteva Agriscience, Nufarm Ltd., Bioworks, Inc., Syngenta Group, Sumitomo Chemical, Adama Agricultural Solutions, Valent BioSciences, Mitsui Chemicals Agro, Inc., Gowan Company, Nippon Soda Co., Ltd., Helm AG, Isagro S.p.A., Rotam Global AgroSciences, Rallis India Ltd., PI Industries Ltd.. |
Ans: Asia Pacific led the Insecticides Market in the region with the highest revenue share in 2023.
Ans: Increasing agricultural productivity needs which drive market growth.
Ans: The cereals & grains will grow rapidly in the Insecticides Market from 2024-2032.
Ans: The expected CAGR of the global Insecticides Market during the forecast period is 5.94%
Ans: The Insecticides Market was valued at USD 17.81 Billion in 2023.
Table of Content
1. Introduction
1.1 Market Definition
1.2 Scope (Inclusion and Exclusions)
1.3 Research Assumptions
2. Executive Summary
2.1 Market Overview
2.2 Regional Synopsis
2.3 Competitive Summary
3. Research Methodology
3.1 Top-Down Approach
3.2 Bottom-up Approach
3.3. Data Validation
3.4 Primary Interviews
4. Market Dynamics Impact Analysis
4.1 Market Driving Factors Analysis
4.1.2 Drivers
4.1.2 Restraints
4.1.3 Opportunities
4.1.4 Challenges
4.2 PESTLE Analysis
4.3 Porter’s Five Forces Model
5. Statistical Insights and Trends Reporting
5.1 Production Capacity and Utilization, by Country, By Type, 2023
5.2 Feedstock Prices, by Country, By Type, 2023
5.3 Regulatory Impact, by Country, By Type 2023.
5.4 Environmental Metrics: Emissions Data, Waste Management Practices, and Sustainability Initiatives, by Region
5.5 Innovation and R&D, Type, 2023
6. Competitive Landscape
6.1 List of Major Companies, By Region
6.2 Market Share Analysis, By Region
6.3 Product Benchmarking
6.3.1 Product specifications and features
6.3.2 Pricing
6.4 Strategic Initiatives
6.4.1 Marketing and promotional activities
6.4.2 Distribution and Supply Chain Strategies
6.4.3 Expansion Plans and New Product Launches
6.4.4 Strategic partnerships and collaborations
6.5 Technological Advancements
6.6 Market Positioning and Branding
7. Insecticides Market Segmentation, By Type
7.1 Chapter Overview
7.2 Pyrethroids
7.2.1 Pyrethroids Trends Analysis (2020-2032)
7.2.2 Pyrethroids Market Size Estimates and Forecasts to 2032 (USD Billion)
7.3 Organophosphates
7.3.1 Organophosphates Market Trends Analysis (2020-2032)
7.3.2 Organophosphates Market Size Estimates and Forecasts to 2032 (USD Billion)
7.4 Carbamates
7.4.1 Carbamates Trends Analysis (2020-2032)
7.4.2 Carbamates Market Size Estimates and Forecasts to 2032 (USD Billion)
7.5 Chlorinated Hydrocarbons
7.5.1 Chlorinated Hydrocarbons Market Trends Analysis (2020-2032)
7.5.2 Chlorinated Hydrocarbons Market Size Estimates and Forecasts to 2032 (USD Billion)
7.6 Botanical
7.6.1 Botanical Trends Analysis (2020-2032)
7.6.2 Botanical Market Size Estimates and Forecasts to 2032 (USD Billion)
7.7 Others
7.7.1 Others Market Trends Analysis (2020-2032)
7.7.2 Others Market Size Estimates and Forecasts to 2032 (USD Billion)
8. Insecticides Market Segmentation, by Application
8.1 Chapter Overview
8.2 Cereals & Grains
8.2.1 Cereals & Grains Market Trends Analysis (2020-2032)
8.2.2 Cereals & Grains Market Size Estimates and Forecasts to 2032 (USD Billion)
8.3 Oilseeds & Pulses
8.3.1 Oilseeds & Pulses Market Trends Analysis (2020-2032)
8.3.2 Oilseeds & Pulses Market Size Estimates and Forecasts to 2032 (USD Billion)
8.4 Fruits & Vegetables
8.4.1 Fruits & Vegetables Market Trends Analysis (2020-2032)
8.4.2 Fruits & Vegetables Market Size Estimates and Forecasts to 2032 (USD Billion)
8.5 Others
8.5.1 Others Market Trends Analysis (2020-2032)
8.5.2 Others Market Size Estimates and Forecasts to 2032 (USD Billion)
9. Regional Analysis
9.1 Chapter Overview
9.2 North America
9.2.1 Trends Analysis
9.2.2 North America Insecticides Market Estimates and Forecasts, by Country (2020-2032) (USD Billion)
9.2.3 North America Insecticides Market Estimates and Forecasts, By Type (2020-2032) (USD Billion)
9.2.4 North America Insecticides Market Estimates and Forecasts, by Application (2020-2032) (USD Billion)
9.2.5 USA
9.2.5.1 USA Insecticides Market Estimates and Forecasts, By Type (2020-2032) (USD Billion)
9.2.5.2 USA Insecticides Market Estimates and Forecasts, by Application (2020-2032) (USD Billion)
9.2.6 Canada
9.2.6.1 Canada Insecticides Market Estimates and Forecasts, By Type (2020-2032) (USD Billion)
9.2.6.2 Canada Insecticides Market Estimates and Forecasts, by Application (2020-2032) (USD Billion)
9.2.7 Mexico
9.2.7.1 Mexico Insecticides Market Estimates and Forecasts, By Type (2020-2032) (USD Billion)
9.2.7.2 Mexico Insecticides Market Estimates and Forecasts, by Application (2020-2032) (USD Billion)
9.3 Europe
9.3.1 Eastern Europe
9.3.1.1 Trends Analysis
9.3.1.2 Eastern Europe Insecticides Market Estimates and Forecasts, by Country (2020-2032) (USD Billion)
9.3.1.3 Eastern Europe Insecticides Market Estimates and Forecasts, By Type (2020-2032) (USD Billion)
9.3.1.4 Eastern Europe Insecticides Market Estimates and Forecasts, by Application (2020-2032) (USD Billion)
9.3.1.5 Poland
9.3.1.5.1 Poland Insecticides Market Estimates and Forecasts, By Type (2020-2032) (USD Billion)
9.3.1.5.2 Poland Insecticides Market Estimates and Forecasts, by Application (2020-2032) (USD Billion)
9.3.1.6 Romania
9.3.1.6.1 Romania Insecticides Market Estimates and Forecasts, By Type (2020-2032) (USD Billion)
9.3.1.6.2 Romania Insecticides Market Estimates and Forecasts, by Application (2020-2032) (USD Billion)
9.3.1.7 Hungary
9.3.1.7.1 Hungary Insecticides Market Estimates and Forecasts, By Type (2020-2032) (USD Billion)
9.3.1.7.2 Hungary Insecticides Market Estimates and Forecasts, by Application (2020-2032) (USD Billion)
9.3.1.8 Turkey
9.3.1.8.1 Turkey Insecticides Market Estimates and Forecasts, By Type (2020-2032) (USD Billion)
9.3.1.8.2 Turkey Insecticides Market Estimates and Forecasts, by Application (2020-2032) (USD Billion)
9.3.1.9 Rest of Eastern Europe
9.3.1.9.1 Rest of Eastern Europe Insecticides Market Estimates and Forecasts, By Type (2020-2032) (USD Billion)
9.3.1.9.2 Rest of Eastern Europe Insecticides Market Estimates and Forecasts, by Application (2020-2032) (USD Billion)
9.3.2 Western Europe
9.3.2.1 Trends Analysis
9.3.2.2 Western Europe Insecticides Market Estimates and Forecasts, by Country (2020-2032) (USD Billion)
9.3.2.3 Western Europe Insecticides Market Estimates and Forecasts, By Type (2020-2032) (USD Billion)
9.3.2.4 Western Europe Insecticides Market Estimates and Forecasts, by Application (2020-2032) (USD Billion)
9.3.2.5 Germany
9.3.2.5.1 Germany Insecticides Market Estimates and Forecasts, By Type (2020-2032) (USD Billion)
9.3.2.5.2 Germany Insecticides Market Estimates and Forecasts, by Application (2020-2032) (USD Billion)
9.3.2.6 France
9.3.2.6.1 France Insecticides Market Estimates and Forecasts, By Type (2020-2032) (USD Billion)
9.3.2.6.2 France Insecticides Market Estimates and Forecasts, by Application (2020-2032) (USD Billion)
9.3.2.7 UK
9.3.2.7.1 UK Insecticides Market Estimates and Forecasts, By Type (2020-2032) (USD Billion)
9.3.2.7.2 UK Insecticides Market Estimates and Forecasts, by Application (2020-2032) (USD Billion)
9.3.2.8 Italy
9.3.2.8.1 Italy Insecticides Market Estimates and Forecasts, By Type (2020-2032) (USD Billion)
9.3.2.8.2 Italy Insecticides Market Estimates and Forecasts, by Application (2020-2032) (USD Billion)
9.3.2.9 Spain
9.3.2.9.1 Spain Insecticides Market Estimates and Forecasts, By Type (2020-2032) (USD Billion)
9.3.2.9.2 Spain Insecticides Market Estimates and Forecasts, by Application (2020-2032) (USD Billion)
9.3.2.10 Netherlands
9.3.2.10.1 Netherlands Insecticides Market Estimates and Forecasts, By Type (2020-2032) (USD Billion)
9.3.2.10.2 Netherlands Insecticides Market Estimates and Forecasts, by Application (2020-2032) (USD Billion)
9.3.2.11 Switzerland
9.3.2.11.1 Switzerland Insecticides Market Estimates and Forecasts, By Type (2020-2032) (USD Billion)
9.3.2.11.2 Switzerland Insecticides Market Estimates and Forecasts, by Application (2020-2032) (USD Billion)
9.3.2.12 Austria
9.3.2.12.1 Austria Insecticides Market Estimates and Forecasts, By Type (2020-2032) (USD Billion)
9.3.2.12.2 Austria Insecticides Market Estimates and Forecasts, by Application (2020-2032) (USD Billion)
9.3.2.13 Rest of Western Europe
9.3.2.13.1 Rest of Western Europe Insecticides Market Estimates and Forecasts, By Type (2020-2032) (USD Billion)
9.3.2.13.2 Rest of Western Europe Insecticides Market Estimates and Forecasts, by Application (2020-2032) (USD Billion)
9.4 Asia Pacific
9.4.1 Trends Analysis
9.4.2 Asia Pacific Insecticides Market Estimates and Forecasts, by Country (2020-2032) (USD Billion)
9.4.3 Asia Pacific Insecticides Market Estimates and Forecasts, By Type (2020-2032) (USD Billion)
9.4.4 Asia Pacific Insecticides Market Estimates and Forecasts, by Application (2020-2032) (USD Billion)
9.4.5 China
9.4.5.1 China Insecticides Market Estimates and Forecasts, By Type (2020-2032) (USD Billion)
9.4.5.2 China Insecticides Market Estimates and Forecasts, by Application (2020-2032) (USD Billion)
9.4.6 India
9.4.5.1 India Insecticides Market Estimates and Forecasts, By Type (2020-2032) (USD Billion)
9.4.5.2 India Insecticides Market Estimates and Forecasts, by Application (2020-2032) (USD Billion)
9.4.5 Japan
9.4.5.1 Japan Insecticides Market Estimates and Forecasts, By Type (2020-2032) (USD Billion)
9.4.5.2 Japan Insecticides Market Estimates and Forecasts, by Application (2020-2032) (USD Billion)
9.4.6 South Korea
9.4.6.1 South Korea Insecticides Market Estimates and Forecasts, By Type (2020-2032) (USD Billion)
9.4.6.2 South Korea Insecticides Market Estimates and Forecasts, by Application (2020-2032) (USD Billion)
9.4.7 Vietnam
9.4.7.1 Vietnam Insecticides Market Estimates and Forecasts, By Type (2020-2032) (USD Billion)
9.2.7.2 Vietnam Insecticides Market Estimates and Forecasts, by Application (2020-2032) (USD Billion)
9.4.8 Singapore
9.4.8.1 Singapore Insecticides Market Estimates and Forecasts, By Type (2020-2032) (USD Billion)
9.4.8.2 Singapore Insecticides Market Estimates and Forecasts, by Application (2020-2032) (USD Billion)
9.4.9 Australia
9.4.9.1 Australia Insecticides Market Estimates and Forecasts, By Type (2020-2032) (USD Billion)
9.4.9.2 Australia Insecticides Market Estimates and Forecasts, by Application (2020-2032) (USD Billion)
9.4.10 Rest of Asia Pacific
9.4.10.1 Rest of Asia Pacific Insecticides Market Estimates and Forecasts, By Type (2020-2032) (USD Billion)
9.4.10.2 Rest of Asia Pacific Insecticides Market Estimates and Forecasts, by Application (2020-2032) (USD Billion)
9.5 Middle East and Africa
9.5.1 Middle East
9.5.1.1 Trends Analysis
9.5.1.2 Middle East Insecticides Market Estimates and Forecasts, by Country (2020-2032) (USD Billion)
9.5.1.3 Middle East Insecticides Market Estimates and Forecasts, By Type (2020-2032) (USD Billion)
9.5.1.4 Middle East Insecticides Market Estimates and Forecasts, by Application (2020-2032) (USD Billion)
9.5.1.5 UAE
9.5.1.5.1 UAE Insecticides Market Estimates and Forecasts, By Type (2020-2032) (USD Billion)
9.5.1.5.2 UAE Insecticides Market Estimates and Forecasts, by Application (2020-2032) (USD Billion)
9.5.1.6 Egypt
9.5.1.6.1 Egypt Insecticides Market Estimates and Forecasts, By Type (2020-2032) (USD Billion)
9.5.1.6.2 Egypt Insecticides Market Estimates and Forecasts, by Application (2020-2032) (USD Billion)
9.5.1.7 Saudi Arabia
9.5.1.7.1 Saudi Arabia Insecticides Market Estimates and Forecasts, By Type (2020-2032) (USD Billion)
9.5.1.7.2 Saudi Arabia Insecticides Market Estimates and Forecasts, by Application (2020-2032) (USD Billion)
9.5.1.8 Qatar
9.5.1.8.1 Qatar Insecticides Market Estimates and Forecasts, By Type (2020-2032) (USD Billion)
9.5.1.8.2 Qatar Insecticides Market Estimates and Forecasts, by Application (2020-2032) (USD Billion)
9.5.1.9 Rest of Middle East
9.5.1.9.1 Rest of Middle East Insecticides Market Estimates and Forecasts, By Type (2020-2032) (USD Billion)
9.5.1.9.2 Rest of Middle East Insecticides Market Estimates and Forecasts, by Application (2020-2032) (USD Billion)
9.5.2 Africa
9.5.2.1 Trends Analysis
9.5.2.2 Africa Insecticides Market Estimates and Forecasts, by Country (2020-2032) (USD Billion)
9.5.2.3 Africa Insecticides Market Estimates and Forecasts, By Type (2020-2032) (USD Billion)
9.5.2.4 Africa Insecticides Market Estimates and Forecasts, by Application (2020-2032) (USD Billion)
9.5.2.5 South Africa
9.5.2.5.1 South Africa Insecticides Market Estimates and Forecasts, By Type (2020-2032) (USD Billion)
9.5.2.5.2 South Africa Insecticides Market Estimates and Forecasts, by Application (2020-2032) (USD Billion)
9.5.2.6 Nigeria
9.5.2.6.1 Nigeria Insecticides Market Estimates and Forecasts, By Type (2020-2032) (USD Billion)
9.5.2.6.2 Nigeria Insecticides Market Estimates and Forecasts, by Application (2020-2032) (USD Billion)
9.6 Latin America
9.6.1 Trends Analysis
9.6.2 Latin America Insecticides Market Estimates and Forecasts, by Country (2020-2032) (USD Billion)
9.6.3 Latin America Insecticides Market Estimates and Forecasts, By Type (2020-2032) (USD Billion)
9.6.4 Latin America Insecticides Market Estimates and Forecasts, by Application (2020-2032) (USD Billion)
9.6.5 Brazil
9.6.5.1 Brazil Insecticides Market Estimates and Forecasts, By Type (2020-2032) (USD Billion)
9.6.5.2 Brazil Insecticides Market Estimates and Forecasts, by Application (2020-2032) (USD Billion)
9.6.6 Argentina
9.6.6.1 Argentina Insecticides Market Estimates and Forecasts, By Type (2020-2032) (USD Billion)
9.6.6.2 Argentina Insecticides Market Estimates and Forecasts, by Application (2020-2032) (USD Billion)
9.6.7 Colombia
9.6.7.1 Colombia Insecticides Market Estimates and Forecasts, By Type (2020-2032) (USD Billion)
9.6.7.2 Colombia Insecticides Market Estimates and Forecasts, by Application (2020-2032) (USD Billion)
9.6.8 Rest of Latin America
9.6.8.1 Rest of Latin America Insecticides Market Estimates and Forecasts, By Type (2020-2032) (USD Billion)
9.6.8.2 Rest of Latin America Insecticides Market Estimates and Forecasts, by Application (2020-2032) (USD Billion)
10. Company Profiles
10.1 AMVAC Chemical Corp.
10.1.1 Company Overview
10.1.2 Financial
10.1.3 Product / Services Offered
10.1.4 SWOT Analysis
10.2 UPL Ltd.
10.2.1 Company Overview
10.2.2 Financial
10.2.3 Product/ Services Offered
10.2.4 SWOT Analysis
10.3 Bayer AG
10.3.1 Company Overview
10.3.2 Financial
10.3.3 Product/ Services Offered
10.3.4 SWOT Analysis
10.4 BASF SE
10.4.1 Company Overview
10.4.2 Financial
10.4.3 Product/ Services Offered
10.4.4 SWOT Analysis
10.5 FMC Corp.
10.5.1 Company Overview
10.5.2 Financial
10.5.3 Product/ Services Offered
10.5.4 SWOT Analysis
10.6 Corteva Agriscience
10.6.1 Company Overview
10.6.2 Financial
10.6.3 Product/ Services Offered
10.6.4 SWOT Analysis
10.7 Nufarm Ltd.
10.7.1 Company Overview
10.7.2 Financial
10.7.3 Product/ Services Offered
10.7.4 SWOT Analysis
10.8 Bioworks, Inc.
10.8.1 Company Overview
10.8.2 Financial
10.8.3 Product/ Services Offered
10.8.4 SWOT Analysis
10.9 Syngenta Group
10.9.1 Company Overview
10.9.2 Financial
10.9.3 Product/ Services Offered
10.9.4 SWOT Analysis
10.10 Sumitomo Chemical
10.10.1 Company Overview
10.10.2 Financial
10.10.3 Product/ Services Offered
10.10.4 SWOT Analysis
11. Use Cases and Best Practices
12. Conclusion
An accurate research report requires proper strategizing as well as implementation. There are multiple factors involved in the completion of good and accurate research report and selecting the best methodology to compete the research is the toughest part. Since the research reports we provide play a crucial role in any company’s decision-making process, therefore we at SNS Insider always believe that we should choose the best method which gives us results closer to reality. This allows us to reach at a stage wherein we can provide our clients best and accurate investment to output ratio.
Each report that we prepare takes a timeframe of 350-400 business hours for production. Starting from the selection of titles through a couple of in-depth brain storming session to the final QC process before uploading our titles on our website we dedicate around 350 working hours. The titles are selected based on their current market cap and the foreseen CAGR and growth.
The 5 steps process:
Step 1: Secondary Research:
Secondary Research or Desk Research is as the name suggests is a research process wherein, we collect data through the readily available information. In this process we use various paid and unpaid databases which our team has access to and gather data through the same. This includes examining of listed companies’ annual reports, Journals, SEC filling etc. Apart from this our team has access to various associations across the globe across different industries. Lastly, we have exchange relationships with various university as well as individual libraries.
Step 2: Primary Research
When we talk about primary research, it is a type of study in which the researchers collect relevant data samples directly, rather than relying on previously collected data. This type of research is focused on gaining content specific facts that can be sued to solve specific problems. Since the collected data is fresh and first hand therefore it makes the study more accurate and genuine.
We at SNS Insider have divided Primary Research into 2 parts.
Part 1 wherein we interview the KOLs of major players as well as the upcoming ones across various geographic regions. This allows us to have their view over the market scenario and acts as an important tool to come closer to the accurate market numbers. As many as 45 paid and unpaid primary interviews are taken from both the demand and supply side of the industry to make sure we land at an accurate judgement and analysis of the market.
This step involves the triangulation of data wherein our team analyses the interview transcripts, online survey responses and observation of on filed participants. The below mentioned chart should give a better understanding of the part 1 of the primary interview.
Part 2: In this part of primary research the data collected via secondary research and the part 1 of the primary research is validated with the interviews from individual consultants and subject matter experts.
Consultants are those set of people who have at least 12 years of experience and expertise within the industry whereas Subject Matter Experts are those with at least 15 years of experience behind their back within the same space. The data with the help of two main processes i.e., FGDs (Focused Group Discussions) and IDs (Individual Discussions). This gives us a 3rd party nonbiased primary view of the market scenario making it a more dependable one while collation of the data pointers.
Step 3: Data Bank Validation
Once all the information is collected via primary and secondary sources, we run that information for data validation. At our intelligence centre our research heads track a lot of information related to the market which includes the quarterly reports, the daily stock prices, and other relevant information. Our data bank server gets updated every fortnight and that is how the information which we collected using our primary and secondary information is revalidated in real time.
Step 4: QA/QC Process
After all the data collection and validation our team does a final level of quality check and quality assurance to get rid of any unwanted or undesired mistakes. This might include but not limited to getting rid of the any typos, duplication of numbers or missing of any important information. The people involved in this process include technical content writers, research heads and graphics people. Once this process is completed the title gets uploader on our platform for our clients to read it.
Step 5: Final QC/QA Process:
This is the last process and comes when the client has ordered the study. In this process a final QA/QC is done before the study is emailed to the client. Since we believe in giving our clients a good experience of our research studies, therefore, to make sure that we do not lack at our end in any way humanly possible we do a final round of quality check and then dispatch the study to the client.
Key Segments
By Type
Pyrethroids
Organophosphates
Carbamates
Chlorinated Hydrocarbons
Botanical
Others
By Application
Cereals & Grains
Oilseeds & Pulses
Fruits & Vegetables
Others
Request for Segment Customization as per your Business Requirement: Segment Customization Request
Regional Coverage:
North America
US
Canada
Mexico
Europe
Eastern Europe
Poland
Romania
Hungary
Turkey
Rest of Eastern Europe
Western Europe
Germany
France
UK
Italy
Spain
Netherlands
Switzerland
Austria
Rest of Western Europe
Asia Pacific
China
India
Japan
South Korea
Vietnam
Singapore
Australia
Rest of Asia Pacific
Middle East & Africa
Middle East
UAE
Egypt
Saudi Arabia
Qatar
Rest of Middle East
Africa
Nigeria
South Africa
Rest of Africa
Latin America
Brazil
Argentina
Colombia
Rest of Latin America
Request for Country Level Research Report: Country Level Customization Request
Available Customization
With the given market data, SNS Insider offers customization as per the company’s specific needs. The following customization options are available for the report:
Detailed Volume Analysis
Criss-Cross segment analysis (e.g. Product X Application)
Competitive Product Benchmarking
Geographic Analysis
Additional countries in any of the regions
Customized Data Representation
Detailed analysis and profiling of additional market players
The Flexible Foam Market Size was valued at USD 45.52 Billion in 2023 and is expected to reach USD 71.75 Billion by 2032, growing at a CAGR of 5.19% over the forecast period of 2024-2032.
The Solid Waste Management Market Size was valued at USD 325.7 billion in 2023 and is expected to reach USD 440.1 billion by 2032, and grow at a CAGR of 3.4% over the forecast period 2024-2032.
The Chrome Plating Market Size was USD 17.9 billion in 2023 and is expected to reach USD 26.53 billion by 2032, growing at a CAGR of 4.49% by 2024-2032.
The Flexible Paper Market size was USD 73 billion in 2023 and is expected to reach USD 111.1 billion by 2032 and grow at a CAGR of 4.8% over the forecast period of 2024-2032.
Silicone Fabrics Market size was USD 4.7 billion in 2023 and is expected to reach USD 8.5 billion by 2032, growing at a CAGR of 6.8% from 2024 to 2032.
The Emission Control Catalysts Market Size was USD 48.8 billion in 2023 and is expected to reach USD 88.2 Bn by 2032 & grow at a CAGR of 6.8% by 2024-2032.
Hi! Click one of our member below to chat on Phone