Get E-PDF Sample Report on Infrared Thermography Market - Request Sample Report
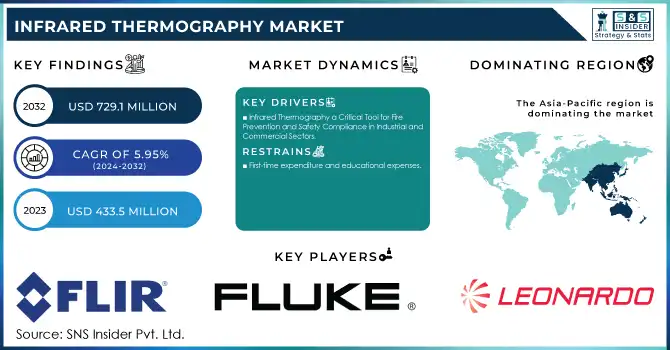
The Infrared Thermography Market Size was valued at USD 433.5 Million in 2023 and is expected to grow to USD 729.1 Million by 2032 and grow at a CAGR of 5.95% over the forecast period of 2024-2032.
The infrared thermography market is experiencing significant growth, driven by the increasing demand for predictive maintenance across various industries, including manufacturing, energy, and utilities. This non-invasive diagnostic tool enables early detection of potential issues, thereby reducing downtime and maintenance costs.In the manufacturing sector, infrared thermography is utilized to monitor equipment such as motors, bearings, and electrical systems, facilitating timely interventions and enhancing operational efficiency. Similarly, in the energy sector, it aids in inspecting power lines, transformers, and substations, ensuring the reliability of energy distribution networks. Notably, 30% of all fires in industrial settings originate from electrical malfunctions. Power lines, being the backbone of energy supply for equipment and operations, require regular maintenance to avoid disruptions. Infrared thermography plays a critical role here by detecting potential electrical problems that could lead to failures in power transmission and distribution, preventing costly downtime and hazards. Utilities employ infrared thermography to assess infrastructure like pipelines and electrical grids, identifying faults before they lead to service disruptions. The adoption of infrared thermography is also expanding in building inspections, where it is used to detect hidden fire and electrical hazards, moisture intrusion, and insulation deficiencies. This capability is crucial for maintaining building safety and energy efficiency. Moreover, with 40% of global energy consumption originating from buildings, retrofitting to improve building envelopes presents an effective solution to reduce energy usage, further driving demand for thermographic technologies. Advancements in infrared camera technologies have made these systems more affordable and accessible, further propelling market growth. Integration with Internet of Things (IoT) devices and artificial intelligence (AI) enhances real-time monitoring and data analysis, providing actionable insights for preventive maintenance strategies. Government regulations focusing on energy efficiency and safety are also contributing to the market's expansion. For instance, compliance with standards such as OSHA and NFPA 70 necessitates regular thermographic inspections of electrical distribution systems, underscoring the importance of infrared thermography in maintaining workplace safety.
Drivers
Infrared Thermography a Critical Tool for Fire Prevention and Safety Compliance in Industrial and Commercial Sectors
The increasing focus on safety and fire prevention in industrial and commercial sectors is a significant driver of the infrared thermography market these risks highlight the need for advanced tools like infrared thermography, which offers a non-invasive and efficient means to identify potential hazards. By detecting heat signatures and anomalies such as hot spots, loose connections, or overloaded circuits, thermography enables timely interventions, minimizing downtime and enhancing the operational safety of critical systems. In commercial settings, thermographic inspections are critical for detecting insulation deficiencies, moisture intrusion, and concealed faults in electrical infrastructure. This is especially vital for large facilities like office complexes, warehouses, and shopping malls, where fire risks pose significant safety and operational challenges. The integration of infrared thermography with technologies like IoT and AI amplifies its effectiveness, enabling real-time monitoring and predictive analytics to proactively address safety concerns. By providing actionable insights, these advancements enhance risk management and ensure facilities remain compliant with safety protocols. Overall, the growing emphasis on fire prevention and safety across industrial and commercial sectors underscores the indispensable role of infrared thermography in safeguarding assets, protecting lives, and ensuring regulatory compliance.
RESTRAIN:
First-time expenditure and educational expenses
The use of infrared thermography for building inspections requires the purchase of thermal imaging equipment up front, which entails expensive infrared cameras along with related hardware and software. These upfront expenses can add up, particularly for startups or smaller organizations with tighter budgets. The cost of operating thermal imaging equipment is increased by regular calibrations, accuracy checks, and maintenance. Maintaining the quality of thermal images and guaranteeing accurate findings during inspections require routine maintenance.
Restraints
Economic uncertainties, particularly during downturns, lead to budget constraints that affect the growth of the infrared thermography market.
As companies to reduce operational costs, there is often a tendency to delay or scale down investments in advanced diagnostic tools such as infrared thermography systems. These systems, which are essential for predictive maintenance and safety monitoring, require significant upfront capital for purchase and ongoing maintenance, making them less attractive in times of financial instability. According to research, economic factors such as recessions and financial crises can lead to a decline in capital expenditures, including the adoption of technologies like infrared thermography, which are seen as non-essential or high-cost investments in the short term. Furthermore, the uncertainty surrounding global economic conditions can also slow the pace of technological advancements, leading to hesitation in adopting the latest infrared thermography solutions. While the technology offers long-term benefits, including reducing downtime, improving safety, and preventing costly breakdowns, its high initial cost and maintenance requirements can deter potential customers, especially in emerging markets or among smaller businesses that lack the financial flexibility to invest in such tools. As a result, the market faces challenges in widespread adoption, particularly in regions or industries where cost control is a top priority. Economic uncertainties not only limit the purchasing power of organizations but also affect the overall confidence in making long-term investments in diagnostic technologies, thus slowing the growth of the infrared thermography market. Despite these challenges, the growing awareness of the long-term cost savings and safety benefits associated with infrared thermography may help mitigate these economic constraints over time.
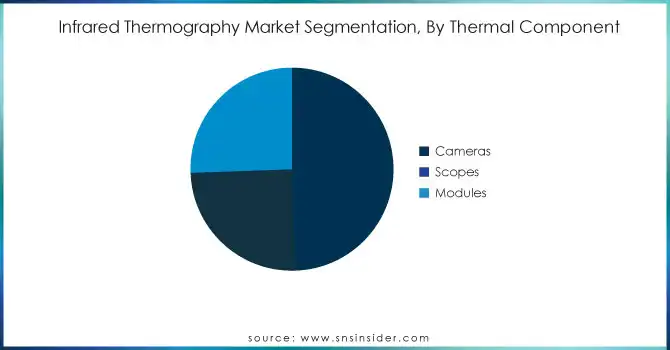
By Thermal Component
In 2023, the Cameras segment dominated the infrared thermography market, accounting for approximately 50% of the market share. This dominance is attributed to the growing demand for high-resolution, portable, and cost-effective infrared cameras used in various applications such as predictive maintenance, building inspections, and safety monitoring. These cameras provide real-time thermal images, allowing for quick detection of anomalies like overheating components, electrical faults, and insulation deficiencies. As industries increasingly adopt preventive maintenance practices, infrared cameras have become essential for identifying potential issues before they lead to costly failures or safety hazards. Additionally, advancements in camera technology, including integration with AI and IoT, have enhanced their capabilities, making them even more attractive for both industrial and commercial sectors.
By End Use Industry
In 2023, the Industrial segment dominated the infrared thermography market, holding around 55% of the market share. This dominance is driven by the widespread adoption of infrared thermography in industrial applications such as predictive maintenance, equipment monitoring, and safety inspections. Industries like manufacturing, energy, and utilities rely heavily on thermography to detect electrical faults, overheating components, and mechanical wear, which helps reduce downtime and improve operational efficiency. The technology’s ability to identify potential issues before they result in costly failures or safety hazards has made it an essential tool in industrial environments. Additionally, the increasing focus on automation, Industry 4.0, and the integration of AI and IoT further enhance the relevance and utility of infrared thermography in industrial settings, ensuring its continued market dominance.
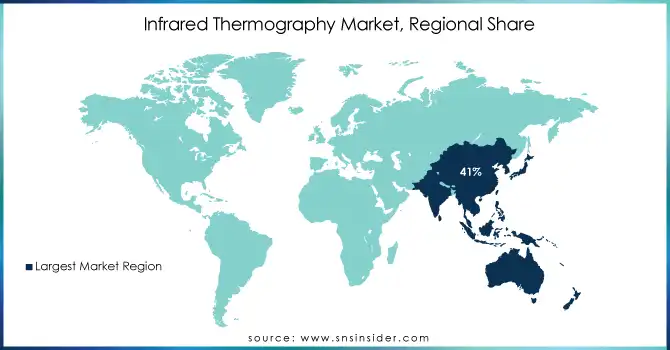
In 2023, the Asia-Pacific region held the largest share of the infrared thermography market, accounting for approximately 41% of the total revenue. The region's dominance is driven by rapid industrialization, significant technological advancements, and increasing demand for predictive maintenance across sectors such as manufacturing, energy, and utilities. China, Japan, and India are key contributors, with China leading due to its massive manufacturing base, while Japan's advanced technology and precision industries boost the demand for thermography solutions. Additionally, the growing emphasis on energy efficiency, safety, and compliance with international standards in sectors like construction and automotive further accelerates market adoption. Government initiatives, along with the integration of AI, IoT, and automation technologies, are strengthening the region’s leadership in the infrared thermography market.
North America is the fastest-growing region in the infrared thermography market over the forecast period from 2024 to 2032. The growth is primarily driven by the increasing demand for predictive maintenance, safety inspections, and energy efficiency solutions across industries such as manufacturing, construction, and utilities. The United States, in particular, is a major contributor to this growth, driven by advancements in technology, regulatory requirements, and the widespread adoption of infrared thermography for electrical inspections, fire prevention, and building assessments. The integration of artificial intelligence (AI) and Internet of Things (IoT) technologies into thermography systems enhances real-time monitoring, making them more effective and efficient.
Get Customized Report as Per Your Business Requirement - Request For Customized Report
Some of the major players in Infrared Thermography Market with their product:
FLIR Systems (Teledyne FLIR) - (Infrared Thermography Cameras)
Fluke Corporation - (Thermal Imaging Cameras for Diagnostics)
Leonardo DRS - (Thermal Imaging Modules for Defense Applications)
BAE Systems - (Thermal Imaging Devices for Military and Surveillance)
Raytheon Technologies - (Infrared Sensors and Thermography Systems)
L3Harris Technologies - (Infrared Imaging Systems for Industrial Use)
Seek Thermal - (Compact Infrared Thermography Cameras)
Opgal Optronic Industries - (Thermography Solutions for Industrial Monitoring)
Bosch Security Systems - (Thermal Cameras for Building Inspections)
Honeywell International - (Infrared Thermography Sensors for Automation)
Axis Communications - (Thermal Network Cameras for Security)
Thermoteknix Systems Ltd. - (Wearable Infrared Thermography Devices)
Excelitas Technologies - (Infrared Detectors for Thermography Applications)
Hikvision - (Thermal Imaging Cameras for Perimeter Security)
InfraTec GmbH - (Infrared Thermography Measurement Systems)
ULIS (Lynred) - (Microbolometers for Thermal Imaging and Thermography)
Dahua Technology - (Thermal Cameras for Safety and Surveillance)
Wuhan Guide Infrared Co., Ltd. - (Handheld Thermography Cameras)
Infrared Cameras Inc. (ICI) - (Thermal Cameras for Industrial Inspections)
Testo SE & Co. KGaA - (Thermography Cameras for HVAC Applications)
Keysight Technologies - (Infrared Testing and Thermography Solutions)
Rohde & Schwarz GmbH & Co KG - (Infrared Thermography and Testing Systems)
Anritsu Corporation - (Infrared Imaging Systems for Industrial Use)
Teledyne Technologies Incorporated - (Infrared Thermography Cameras and Components)
B&K Precision Corporation - (Infrared Thermography Analyzers)
Tektronix Inc. - (Infrared Thermography Testing Equipment)
National Instruments Corporation - (Thermography and Measurement Systems)
Keithley Instruments Inc. - (Thermal Testing and Thermography Instruments)
Leader Electronics Corp. - (Infrared Inspection Systems for Thermography)
Vaunix Technology Corporation - (Infrared Control Components for Thermography)
List of companies that supply raw materials and components for the infrared thermography market:
Infrared Materials Inc.
VIGO Photonics
Vital Materials
SemiConductor Devices (SCD)
InfraTec GmbH
Excelitas Technologies
Lynred
Teledyne Judson Technologies
Amorphous Materials Inc.
5N Plus Inc.
December 16, 2024 – Leonardo DRS’s Land Systems unit has assured there are no capacity constraints in meeting projected demand for short-range air defense and counter-drone platforms. With ample manufacturing capacity at its St. Louis and West Plains facilities, DRS is prepared to meet both current and future requirements, including the Army's expanding demand for force protection capabilities.
April 8, 2024 – Raytheon, an RTX business, has successfully completed thermal vacuum testing of the fourth VIIRS sensor, J4, ahead of schedule. This milestone ensures the VIIRS program remains on track for timely delivery and integration into the NASA-NOAA Joint Polar Satellite System (JPSS) in 2024.
November 12, 2024 – Tektronix has unveiled its groundbreaking power instrumentation lineup, including the world’s first RF isolated current probes and a three-channel bidirectional power supply, designed to accelerate innovation in industries requiring enhanced power efficiency and capacity.
| Report Attributes | Details |
| Market Size in 2023 | USD 433.5 Million |
| Market Size by 2032 | USD 729.1 Million |
| CAGR | CAGR of 5.95% From 2024 to 2032 |
| Base Year | 2023 |
| Forecast Period | 2024-2032 |
| Historical Data | 2020-2022 |
| Report Scope & Coverage | Market Size, Segments Analysis, Competitive Landscape, Regional Analysis, DROC & SWOT Analysis, Forecast Outlook |
| Key Segments | • By Thermal Component (Cameras, Scopes, Modules) • By Modes (Energy Auditing, HVAC System Inspection, Electrical System Inspection, Insulation Inspection, Structural Analysis, Fire/Flare Detection, Others) • By End Use End Use Industry (Industrial, Commercial, Residential) |
| Regional Analysis/Coverage | North America (US, Canada, Mexico), Europe (Eastern Europe [Poland, Romania, Hungary, Turkey, Rest of Eastern Europe] Western Europe] Germany, France, UK, Italy, Spain, Netherlands, Switzerland, Austria, Rest of Western Europe]), Asia Pacific (China, India, Japan, South Korea, Vietnam, Singapore, Australia, Rest of Asia Pacific), Middle East & Africa (Middle East [UAE, Egypt, Saudi Arabia, Qatar, Rest of Middle East], Africa [Nigeria, South Africa, Rest of Africa], Latin America (Brazil, Argentina, Colombia, Rest of Latin America) |
| Company Profiles | FLIR Systems (Teledyne FLIR), Fluke Corporation, Leonardo DRS, BAE Systems, Raytheon Technologies, L3Harris Technologies, Seek Thermal, Opgal Optronic Industries, Bosch Security Systems, Honeywell International, Axis Communications, Thermoteknix Systems Ltd., Excelitas Technologies, Hikvision, InfraTec GmbH, ULIS (Lynred), Dahua Technology, Wuhan Guide Infrared Co., Ltd., Infrared Cameras Inc. (ICI), Testo SE & Co. KGaA, Keysight Technologies, Rohde & Schwarz GmbH & Co KG, Anritsu Corporation, Teledyne Technologies Incorporated, B&K Precision Corporation, Tektronix Inc., National Instruments Corporation, Keithley Instruments Inc., Leader Electronics Corp., and Vaunix Technology Corporation are key players in the infrared thermography market. |
| Key Drivers | • Infrared Thermography a Critical Tool for Fire Prevention and Safety Compliance in Industrial and Commercial Sectors. |
| Restraints | • Economic uncertainties, particularly during downturns, lead to budget constraints that affect the growth of the infrared thermography market. |
Ans: North America is dominating the Infrared Thermography Market.
Ans: The Infrared Thermography Market size was valued at USD 433.5 million in 2023.
Ans: Increasing demand for non-invasive and accurate temperature monitoring solutions across industrial, commercial, and residential applications.
Ans: The Infrared Thermography Market is anticipated to expand by 5.95% from 2024 to 2032.
Table of Content
1. Introduction
1.1 Market Definition
1.2 Scope (Inclusion and Exclusions)
1.3 Research Assumptions
2. Executive Summary
2.1 Market Overview
2.2 Regional Synopsis
2.3 Competitive Summary
3. Research Methodology
3.1 Top-Down Approach
3.2 Bottom-up Approach
3.3. Data Validation
3.4 Primary Interviews
4. Market Dynamics Impact Analysis
4.1 Market Driving Factors Analysis
4.1.1 Drivers
4.1.2 Restraints
4.2 PESTLE Analysis
4.3 Porter’s Five Forces Model
5. Statistical Insights and Trends Reporting
5.1 Unit Shipments
5.2 Production and Supply Data
5.3 Technology Penetration
5.4 Incident Reduction Data
5.5 R&D Investments
6. Competitive Landscape
6.1 List of Major Companies, By Region
6.2 Market Share Analysis, By Region
6.3 Product Benchmarking
6.3.1 Product specifications and features
6.3.2 Pricing
6.4 Strategic Initiatives
6.4.1 Marketing and promotional activities
6.4.2 Distribution and supply chain strategies
6.4.3 Expansion plans and new product launches
6.4.4 Strategic partnerships and collaborations
6.5 Technological Advancements
6.6 Market Positioning and Branding
7. Infrared Thermography Market Segmentation, by Thermal Component
7.1 Chapter Overview
7.2 Cameras
7.2.1 Cameras Market Trends Analysis (2020-2032)
7.2.2 Cameras Market Size Estimates and Forecasts to 2032 (USD Million)
7.3 Scopes
7.3.1 Scopes Market Trends Analysis (2020-2032)
7.3.2 Scopes Market Size Estimates and Forecasts to 2032 (USD Million)
7.4 Modules
7.4.1 Modules Market Trends Analysis (2020-2032)
7.4.2 Modules Market Size Estimates and Forecasts to 2032 (USD Million)
8. Infrared Thermography Market Segmentation, by Modes
8.1 Chapter Overview
8.2 Energy Auditing
8.2.1 Energy Auditing Market Trends Analysis (2020-2032)
8.2.2 Energy Auditing Market Size Estimates and Forecasts to 2032 (USD Million)
8.3 HVAC System Inspection
8.3.1 HVAC System Inspection Market Trends Analysis (2020-2032)
8.3.2 HVAC System Inspection Market Size Estimates and Forecasts to 2032 (USD Million)
8.4 Electrical System Inspection
8.4.1 Electrical System Inspection Market Trends Analysis (2020-2032)
8.4.2 Electrical System Inspection Market Size Estimates and Forecasts to 2032 (USD Million)
8.5 Insulation Inspection
8.5.1 Insulation Inspection Market Trends Analysis (2020-2032)
8.5.2 Insulation Inspection Market Size Estimates and Forecasts to 2032 (USD Million)
8.6 Structural Analysis
8.6.1 Structural Analysis Market Trends Analysis (2020-2032)
8.6.2 Structural Analysis Market Size Estimates and Forecasts to 2032 (USD Million)
8.7 Fire/Flare Detection
8.7.1 Fire/Flare Detection Market Trends Analysis (2020-2032)
8.7.2 Fire/Flare Detection Market Size Estimates and Forecasts to 2032 (USD Million)
8.7 Others
8.7.1 Others Market Trends Analysis (2020-2032)
8.7.2 Others Market Size Estimates and Forecasts to 2032 (USD Million)
9. Infrared Thermography Market Segmentation, by End Use Industry
9.1 Chapter Overview
9.2 Industrial
9.2.1 Industrial Market Trends Analysis (2020-2032)
9.2.2 Industrial Market Size Estimates and Forecasts to 2032 (USD Million)
9.3 Commercial
9.3.1 Commercial Market Trends Analysis (2020-2032)
9.3.2 Commercial Market Size Estimates and Forecasts to 2032 (USD Million)
9.4 Residential
9.4.1 Residential Market Trends Analysis (2020-2032)
9.4.2 Residential Market Size Estimates and Forecasts to 2032 (USD Million)
10. Regional Analysis
10.1 Chapter Overview
10.2 North America
10.2.1 Trends Analysis
10.2.2 North America Infrared Thermography Market Estimates and Forecasts, by Country (2020-2032) (USD Million)
10.2.3 North America Infrared Thermography Market Estimates and Forecasts, by Thermal Component (2020-2032) (USD Million)
10.2.4 North America Infrared Thermography Market Estimates and Forecasts, by Modes (2020-2032) (USD Million)
10.2.5 North America Infrared Thermography Market Estimates and Forecasts, by End Use Industry (2020-2032) (USD Million)
10.2.6 USA
10.2.6.1 USA Infrared Thermography Market Estimates and Forecasts, by Thermal Component (2020-2032) (USD Million)
10.2.6.2 USA Infrared Thermography Market Estimates and Forecasts, by Modes (2020-2032) (USD Million)
10.2.6.3 USA Infrared Thermography Market Estimates and Forecasts, by End Use Industry (2020-2032) (USD Million)
10.2.7 Canada
10.2.7.1 Canada Infrared Thermography Market Estimates and Forecasts, by Thermal Component (2020-2032) (USD Million)
10.2.7.2 Canada Infrared Thermography Market Estimates and Forecasts, by Modes (2020-2032) (USD Million)
10.2.7.3 Canada Infrared Thermography Market Estimates and Forecasts, by End Use Industry (2020-2032) (USD Million)
10.2.8 Mexico
10.2.8.1 Mexico Infrared Thermography Market Estimates and Forecasts, by Thermal Component (2020-2032) (USD Million)
10.2.8.2 Mexico Infrared Thermography Market Estimates and Forecasts, by Modes (2020-2032) (USD Million)
10.2.8.3 Mexico Infrared Thermography Market Estimates and Forecasts, by End Use Industry (2020-2032) (USD Million)
10.3 Europe
10.3.1 Eastern Europe
10.3.1.1 Trends Analysis
10.3.1.2 Eastern Europe Infrared Thermography Market Estimates and Forecasts, by Country (2020-2032) (USD Million)
10.3.1.3 Eastern Europe Infrared Thermography Market Estimates and Forecasts, by Thermal Component (2020-2032) (USD Million)
10.3.1.4 Eastern Europe Infrared Thermography Market Estimates and Forecasts, by Modes (2020-2032) (USD Million)
10.3.1.5 Eastern Europe Infrared Thermography Market Estimates and Forecasts, by End Use Industry (2020-2032) (USD Million)
10.3.1.6 Poland
10.3.1.6.1 Poland Infrared Thermography Market Estimates and Forecasts, by Thermal Component (2020-2032) (USD Million)
10.3.1.6.2 Poland Infrared Thermography Market Estimates and Forecasts, by Modes (2020-2032) (USD Million)
10.3.1.6.3 Poland Infrared Thermography Market Estimates and Forecasts, by End Use Industry (2020-2032) (USD Million)
10.3.1.7 Romania
10.3.1.7.1 Romania Infrared Thermography Market Estimates and Forecasts, by Thermal Component (2020-2032) (USD Million)
10.3.1.7.2 Romania Infrared Thermography Market Estimates and Forecasts, by Modes (2020-2032) (USD Million)
10.3.1.7.3 Romania Infrared Thermography Market Estimates and Forecasts, by End Use Industry (2020-2032) (USD Million)
10.3.1.8 Hungary
10.3.1.8.1 Hungary Infrared Thermography Market Estimates and Forecasts, by Thermal Component (2020-2032) (USD Million)
10.3.1.8.2 Hungary Infrared Thermography Market Estimates and Forecasts, by Modes (2020-2032) (USD Million)
10.3.1.8.3 Hungary Infrared Thermography Market Estimates and Forecasts, by End Use Industry (2020-2032) (USD Million)
10.3.1.9 Turkey
10.3.1.9.1 Turkey Infrared Thermography Market Estimates and Forecasts, by Thermal Component (2020-2032) (USD Million)
10.3.1.9.2 Turkey Infrared Thermography Market Estimates and Forecasts, by Modes (2020-2032) (USD Million)
10.3.1.9.3 Turkey Infrared Thermography Market Estimates and Forecasts, by End Use Industry (2020-2032) (USD Million)
10.3.1.10 Rest of Eastern Europe
10.3.1.10.1 Rest of Eastern Europe Infrared Thermography Market Estimates and Forecasts, by Thermal Component (2020-2032) (USD Million)
10.3.1.10.2 Rest of Eastern Europe Infrared Thermography Market Estimates and Forecasts, by Modes (2020-2032) (USD Million)
10.3.1.10.3 Rest of Eastern Europe Infrared Thermography Market Estimates and Forecasts, by End Use Industry (2020-2032) (USD Million)
10.3.2 Western Europe
10.3.2.1 Trends Analysis
10.3.2.2 Western Europe Infrared Thermography Market Estimates and Forecasts, by Country (2020-2032) (USD Million)
10.3.2.3 Western Europe Infrared Thermography Market Estimates and Forecasts, by Thermal Component (2020-2032) (USD Million)
10.3.2.4 Western Europe Infrared Thermography Market Estimates and Forecasts, by Modes (2020-2032) (USD Million)
10.3.2.5 Western Europe Infrared Thermography Market Estimates and Forecasts, by End Use Industry (2020-2032) (USD Million)
10.3.2.6 Germany
10.3.2.6.1 Germany Infrared Thermography Market Estimates and Forecasts, by Thermal Component (2020-2032) (USD Million)
10.3.2.6.2 Germany Infrared Thermography Market Estimates and Forecasts, by Modes (2020-2032) (USD Million)
10.3.2.6.3 Germany Infrared Thermography Market Estimates and Forecasts, by End Use Industry (2020-2032) (USD Million)
10.3.2.7 France
10.3.2.7.1 France Infrared Thermography Market Estimates and Forecasts, by Thermal Component (2020-2032) (USD Million)
10.3.2.7.2 France Infrared Thermography Market Estimates and Forecasts, by Modes (2020-2032) (USD Million)
10.3.2.7.3 France Infrared Thermography Market Estimates and Forecasts, by End Use Industry (2020-2032) (USD Million)
10.3.2.8 UK
10.3.2.8.1 UK Infrared Thermography Market Estimates and Forecasts, by Thermal Component (2020-2032) (USD Million)
10.3.2.8.2 UK Infrared Thermography Market Estimates and Forecasts, by Modes (2020-2032) (USD Million)
10.3.2.8.3 UK Infrared Thermography Market Estimates and Forecasts, by End Use Industry (2020-2032) (USD Million)
10.3.2.9 Italy
10.3.2.9.1 Italy Infrared Thermography Market Estimates and Forecasts, by Thermal Component (2020-2032) (USD Million)
10.3.2.9.2 Italy Infrared Thermography Market Estimates and Forecasts, by Modes (2020-2032) (USD Million)
10.3.2.9.3 Italy Infrared Thermography Market Estimates and Forecasts, by End Use Industry (2020-2032) (USD Million)
10.3.2.10 Spain
10.3.2.10.1 Spain Infrared Thermography Market Estimates and Forecasts, by Thermal Component (2020-2032) (USD Million)
10.3.2.10.2 Spain Infrared Thermography Market Estimates and Forecasts, by Modes (2020-2032) (USD Million)
10.3.2.10.3 Spain Infrared Thermography Market Estimates and Forecasts, by End Use Industry (2020-2032) (USD Million)
10.3.2.11 Netherlands
10.3.2.11.1 Netherlands Infrared Thermography Market Estimates and Forecasts, by Thermal Component (2020-2032) (USD Million)
10.3.2.11.2 Netherlands Infrared Thermography Market Estimates and Forecasts, by Modes (2020-2032) (USD Million)
10.3.2.11.3 Netherlands Infrared Thermography Market Estimates and Forecasts, by End Use Industry (2020-2032) (USD Million)
10.3.2.12 Switzerland
10.3.2.12.1 Switzerland Infrared Thermography Market Estimates and Forecasts, by Thermal Component (2020-2032) (USD Million)
10.3.2.12.2 Switzerland Infrared Thermography Market Estimates and Forecasts, by Modes (2020-2032) (USD Million)
10.3.2.12.3 Switzerland Infrared Thermography Market Estimates and Forecasts, by End Use Industry (2020-2032) (USD Million)
10.3.2.13 Austria
10.3.2.13.1 Austria Infrared Thermography Market Estimates and Forecasts, by Thermal Component (2020-2032) (USD Million)
10.3.2.13.2 Austria Infrared Thermography Market Estimates and Forecasts, by Modes (2020-2032) (USD Million)
10.3.2.13.3 Austria Infrared Thermography Market Estimates and Forecasts, by End Use Industry (2020-2032) (USD Million)
10.3.2.14 Rest of Western Europe
10.3.2.14.1 Rest of Western Europe Infrared Thermography Market Estimates and Forecasts, by Thermal Component (2020-2032) (USD Million)
10.3.2.14.2 Rest of Western Europe Infrared Thermography Market Estimates and Forecasts, by Modes (2020-2032) (USD Million)
10.3.2.14.3 Rest of Western Europe Infrared Thermography Market Estimates and Forecasts, by End Use Industry (2020-2032) (USD Million)
10.4 Asia-Pacific
10.4.1 Trends Analysis
10.4.2 Asia-Pacific Infrared Thermography Market Estimates and Forecasts, by Country (2020-2032) (USD Million)
10.4.3 Asia-Pacific Infrared Thermography Market Estimates and Forecasts, by Thermal Component (2020-2032) (USD Million)
10.4.4 Asia-Pacific Infrared Thermography Market Estimates and Forecasts, by Modes (2020-2032) (USD Million)
10.4.5 Asia-Pacific Infrared Thermography Market Estimates and Forecasts, by End Use Industry (2020-2032) (USD Million)
10.4.6 China
10.4.6.1 China Infrared Thermography Market Estimates and Forecasts, by Thermal Component (2020-2032) (USD Million)
10.4.6.2 China Infrared Thermography Market Estimates and Forecasts, by Modes (2020-2032) (USD Million)
10.4.6.3 China Infrared Thermography Market Estimates and Forecasts, by End Use Industry (2020-2032) (USD Million)
10.4.7 India
10.4.7.1 India Infrared Thermography Market Estimates and Forecasts, by Thermal Component (2020-2032) (USD Million)
10.4.7.2 India Infrared Thermography Market Estimates and Forecasts, by Modes (2020-2032) (USD Million)
10.4.7.3 India Infrared Thermography Market Estimates and Forecasts, by End Use Industry (2020-2032) (USD Million)
10.4.8 Japan
10.4.8.1 Japan Infrared Thermography Market Estimates and Forecasts, by Thermal Component (2020-2032) (USD Million)
10.4.8.2 Japan Infrared Thermography Market Estimates and Forecasts, by Modes (2020-2032) (USD Million)
10.4.8.3 Japan Infrared Thermography Market Estimates and Forecasts, by End Use Industry (2020-2032) (USD Million)
10.4.9 South Korea
10.4.9.1 South Korea Infrared Thermography Market Estimates and Forecasts, by Thermal Component (2020-2032) (USD Million)
10.4.9.2 South Korea Infrared Thermography Market Estimates and Forecasts, by Modes (2020-2032) (USD Million)
10.4.9.3 South Korea Infrared Thermography Market Estimates and Forecasts, by End Use Industry (2020-2032) (USD Million)
10.4.10 Vietnam
10.4.10.1 Vietnam Infrared Thermography Market Estimates and Forecasts, by Thermal Component (2020-2032) (USD Million)
10.4.10.2 Vietnam Infrared Thermography Market Estimates and Forecasts, by Modes (2020-2032) (USD Million)
10.4.10.3 Vietnam Infrared Thermography Market Estimates and Forecasts, by End Use Industry (2020-2032) (USD Million)
10.4.11 Singapore
10.4.11.1 Singapore Infrared Thermography Market Estimates and Forecasts, by Thermal Component (2020-2032) (USD Million)
10.4.11.2 Singapore Infrared Thermography Market Estimates and Forecasts, by Modes (2020-2032) (USD Million)
10.4.11.3 Singapore Infrared Thermography Market Estimates and Forecasts, by End Use Industry (2020-2032) (USD Million)
10.4.12 Australia
10.4.12.1 Australia Infrared Thermography Market Estimates and Forecasts, by Thermal Component (2020-2032) (USD Million)
10.4.12.2 Australia Infrared Thermography Market Estimates and Forecasts, by Modes (2020-2032) (USD Million)
10.4.12.3 Australia Infrared Thermography Market Estimates and Forecasts, by End Use Industry (2020-2032) (USD Million)
10.4.13 Rest of Asia-Pacific
10.4.13.1 Rest of Asia-Pacific Infrared Thermography Market Estimates and Forecasts, by Thermal Component (2020-2032) (USD Million)
10.4.13.2 Rest of Asia-Pacific Infrared Thermography Market Estimates and Forecasts, by Modes (2020-2032) (USD Million)
10.4.13.3 Rest of Asia-Pacific Infrared Thermography Market Estimates and Forecasts, by End Use Industry (2020-2032) (USD Million)
10.5 Middle East and Africa
10.5.1 Middle East
10.5.1.1 Trends Analysis
10.5.1.2 Middle East Infrared Thermography Market Estimates and Forecasts, by Country (2020-2032) (USD Million)
10.5.1.3 Middle East Infrared Thermography Market Estimates and Forecasts, by Thermal Component (2020-2032) (USD Million)
10.5.1.4 Middle East Infrared Thermography Market Estimates and Forecasts, by Modes (2020-2032) (USD Million)
10.5.1.5 Middle East Infrared Thermography Market Estimates and Forecasts, by End Use Industry (2020-2032) (USD Million)
10.5.1.6 UAE
10.5.1.6.1 UAE Infrared Thermography Market Estimates and Forecasts, by Thermal Component (2020-2032) (USD Million)
10.5.1.6.2 UAE Infrared Thermography Market Estimates and Forecasts, by Modes (2020-2032) (USD Million)
10.5.1.6.3 UAE Infrared Thermography Market Estimates and Forecasts, by End Use Industry (2020-2032) (USD Million)
10.5.1.7 Egypt
10.5.1.7.1 Egypt Infrared Thermography Market Estimates and Forecasts, by Thermal Component (2020-2032) (USD Million)
10.5.1.7.2 Egypt Infrared Thermography Market Estimates and Forecasts, by Modes (2020-2032) (USD Million)
10.5.1.7.3 Egypt Infrared Thermography Market Estimates and Forecasts, by End Use Industry (2020-2032) (USD Million)
10.5.1.8 Saudi Arabia
10.5.1.8.1 Saudi Arabia Infrared Thermography Market Estimates and Forecasts, by Thermal Component (2020-2032) (USD Million)
10.5.1.8.2 Saudi Arabia Infrared Thermography Market Estimates and Forecasts, by Modes (2020-2032) (USD Million)
10.5.1.8.3 Saudi Arabia Infrared Thermography Market Estimates and Forecasts, by End Use Industry (2020-2032) (USD Million)
10.5.1.9 Qatar
10.5.1.9.1 Qatar Infrared Thermography Market Estimates and Forecasts, by Thermal Component (2020-2032) (USD Million)
10.5.1.9.2 Qatar Infrared Thermography Market Estimates and Forecasts, by Modes (2020-2032) (USD Million)
10.5.1.9.3 Qatar Infrared Thermography Market Estimates and Forecasts, by End Use Industry (2020-2032) (USD Million)
10.5.1.10 Rest of Middle East
10.5.1.10.1 Rest of Middle East Infrared Thermography Market Estimates and Forecasts, by Thermal Component (2020-2032) (USD Million)
10.5.1.10.2 Rest of Middle East Infrared Thermography Market Estimates and Forecasts, by Modes (2020-2032) (USD Million)
10.5.1.10.3 Rest of Middle East Infrared Thermography Market Estimates and Forecasts, by End Use Industry (2020-2032) (USD Million)
10.5.2 Africa
10.5.2.1 Trends Analysis
10.5.2.2 Africa Infrared Thermography Market Estimates and Forecasts, by Country (2020-2032) (USD Million)
10.5.2.3 Africa Infrared Thermography Market Estimates and Forecasts, by Thermal Component (2020-2032) (USD Million)
10.5.2.4 Africa Infrared Thermography Market Estimates and Forecasts, by Modes (2020-2032) (USD Million)
10.5.2.5 Africa Infrared Thermography Market Estimates and Forecasts, by End Use Industry (2020-2032) (USD Million)
10.5.2.6 South Africa
10.5.2.6.1 South Africa Infrared Thermography Market Estimates and Forecasts, by Thermal Component (2020-2032) (USD Million)
10.5.2.6.2 South Africa Infrared Thermography Market Estimates and Forecasts, by Modes (2020-2032) (USD Million)
10.5.2.6.3 South Africa Infrared Thermography Market Estimates and Forecasts, by End Use Industry (2020-2032) (USD Million)
10.5.2.7 Nigeria
10.5.2.7.1 Nigeria Infrared Thermography Market Estimates and Forecasts, by Thermal Component (2020-2032) (USD Million)
10.5.2.7.2 Nigeria Infrared Thermography Market Estimates and Forecasts, by Modes (2020-2032) (USD Million)
10.5.2.7.3 Nigeria Infrared Thermography Market Estimates and Forecasts, by End Use Industry (2020-2032) (USD Million)
10.5.2.8 Rest of Africa
10.5.2.8.1 Rest of Africa Infrared Thermography Market Estimates and Forecasts, by Thermal Component (2020-2032) (USD Million)
10.5.2.8.2 Rest of Africa Infrared Thermography Market Estimates and Forecasts, by Modes (2020-2032) (USD Million)
10.5.2.8.3 Rest of Africa Infrared Thermography Market Estimates and Forecasts, by End Use Industry (2020-2032) (USD Million)
10.6 Latin America
10.6.1 Trends Analysis
10.6.2 Latin America Infrared Thermography Market Estimates and Forecasts, by Country (2020-2032) (USD Million)
10.6.3 Latin America Infrared Thermography Market Estimates and Forecasts, by Thermal Component (2020-2032) (USD Million)
10.6.4 Latin America Infrared Thermography Market Estimates and Forecasts, by Modes (2020-2032) (USD Million)
10.6.5 Latin America Infrared Thermography Market Estimates and Forecasts, by End Use Industry (2020-2032) (USD Million)
10.6.6 Brazil
10.6.6.1 Brazil Infrared Thermography Market Estimates and Forecasts, by Thermal Component (2020-2032) (USD Million)
10.6.6.2 Brazil Infrared Thermography Market Estimates and Forecasts, by Modes (2020-2032) (USD Million)
10.6.6.3 Brazil Infrared Thermography Market Estimates and Forecasts, by End Use Industry (2020-2032) (USD Million)
10.6.7 Argentina
10.6.7.1 Argentina Infrared Thermography Market Estimates and Forecasts, by Thermal Component (2020-2032) (USD Million)
10.6.7.2 Argentina Infrared Thermography Market Estimates and Forecasts, by Modes (2020-2032) (USD Million)
10.6.7.3 Argentina Infrared Thermography Market Estimates and Forecasts, by End Use Industry (2020-2032) (USD Million)
10.6.8 Colombia
10.6.8.1 Colombia Infrared Thermography Market Estimates and Forecasts, by Thermal Component (2020-2032) (USD Million)
10.6.8.2 Colombia Infrared Thermography Market Estimates and Forecasts, by Modes (2020-2032) (USD Million)
10.6.8.3 Colombia Infrared Thermography Market Estimates and Forecasts, by End Use Industry (2020-2032) (USD Million)
10.6.9 Rest of Latin America
10.6.9.1 Rest of Latin America Infrared Thermography Market Estimates and Forecasts, by Thermal Component (2020-2032) (USD Million)
10.6.9.2 Rest of Latin America Infrared Thermography Market Estimates and Forecasts, by Modes (2020-2032) (USD Million)
10.6.9.3 Rest of Latin America Infrared Thermography Market Estimates and Forecasts, by End Use Industry (2020-2032) (USD Million)
11. Company Profiles
11.1 FLIR Systems (Teledyne FLIR)
11.1.1 Company Overview
11.1.2 Financial
11.1.3 Products/ Services Offered
11.1.4 SWOT Analysis
11.2 Fluke Corporation
11.2.1 Company Overview
11.2.2 Financial
11.2.3 Products/ Services Offered
11.2.4 SWOT Analysis
11.3 Leonardo DRS
11.3.1 Company Overview
11.3.2 Financial
11.3.3 Products/ Services Offered
11.3.4 SWOT Analysis
11.4 BAE Systems
11.4.1 Company Overview
11.4.2 Financial
11.4.3 Products/ Services Offered
11.4.4 SWOT Analysis
11.5 Raytheon Technologies
11.5.1 Company Overview
11.5.2 Financial
11.5.3 Products/ Services Offered
11.5.4 SWOT Analysis
11.6 L3Harris Technologies
11.6.1 Company Overview
11.6.2 Financial
11.6.3 Products/ Services Offered
11.6.4 SWOT Analysis
11.7 Seek Thermal
11.7.1 Company Overview
11.7.2 Financial
11.7.3 Products/ Services Offered
11.7.4 SWOT Analysis
11.8 Opgal Optronic Industries
11.8.1 Company Overview
11.8.2 Financial
11.8.3 Products/ Services Offered
11.8.4 SWOT Analysis
11.9 Bosch Security Systems
11.9.1 Company Overview
11.9.2 Financial
11.9.3 Products/ Services Offered
11.9.4 SWOT Analysis
11.10 Honeywell International
11.10.1 Company Overview
11.10.2 Financial
11.10.3 Products/ Services Offered
11.10.4 SWOT Analysis
12. Use Cases and Best Practices
13. Conclusion
An accurate research report requires proper strategizing as well as implementation. There are multiple factors involved in the completion of good and accurate research report and selecting the best methodology to compete the research is the toughest part. Since the research reports we provide play a crucial role in any company’s decision-making process, therefore we at SNS Insider always believe that we should choose the best method which gives us results closer to reality. This allows us to reach at a stage wherein we can provide our clients best and accurate investment to output ratio.
Each report that we prepare takes a timeframe of 350-400 business hours for production. Starting from the selection of titles through a couple of in-depth brain storming session to the final QC process before uploading our titles on our website we dedicate around 350 working hours. The titles are selected based on their current market cap and the foreseen CAGR and growth.
The 5 steps process:
Step 1: Secondary Research:
Secondary Research or Desk Research is as the name suggests is a research process wherein, we collect data through the readily available information. In this process we use various paid and unpaid databases which our team has access to and gather data through the same. This includes examining of listed companies’ annual reports, Journals, SEC filling etc. Apart from this our team has access to various associations across the globe across different industries. Lastly, we have exchange relationships with various university as well as individual libraries.

Step 2: Primary Research
When we talk about primary research, it is a type of study in which the researchers collect relevant data samples directly, rather than relying on previously collected data. This type of research is focused on gaining content specific facts that can be sued to solve specific problems. Since the collected data is fresh and first hand therefore it makes the study more accurate and genuine.
We at SNS Insider have divided Primary Research into 2 parts.
Part 1 wherein we interview the KOLs of major players as well as the upcoming ones across various geographic regions. This allows us to have their view over the market scenario and acts as an important tool to come closer to the accurate market numbers. As many as 45 paid and unpaid primary interviews are taken from both the demand and supply side of the industry to make sure we land at an accurate judgement and analysis of the market.
This step involves the triangulation of data wherein our team analyses the interview transcripts, online survey responses and observation of on filed participants. The below mentioned chart should give a better understanding of the part 1 of the primary interview.

Part 2: In this part of primary research the data collected via secondary research and the part 1 of the primary research is validated with the interviews from individual consultants and subject matter experts.
Consultants are those set of people who have at least 12 years of experience and expertise within the industry whereas Subject Matter Experts are those with at least 15 years of experience behind their back within the same space. The data with the help of two main processes i.e., FGDs (Focused Group Discussions) and IDs (Individual Discussions). This gives us a 3rd party nonbiased primary view of the market scenario making it a more dependable one while collation of the data pointers.
Step 3: Data Bank Validation
Once all the information is collected via primary and secondary sources, we run that information for data validation. At our intelligence centre our research heads track a lot of information related to the market which includes the quarterly reports, the daily stock prices, and other relevant information. Our data bank server gets updated every fortnight and that is how the information which we collected using our primary and secondary information is revalidated in real time.

Step 4: QA/QC Process
After all the data collection and validation our team does a final level of quality check and quality assurance to get rid of any unwanted or undesired mistakes. This might include but not limited to getting rid of the any typos, duplication of numbers or missing of any important information. The people involved in this process include technical content writers, research heads and graphics people. Once this process is completed the title gets uploader on our platform for our clients to read it.
Step 5: Final QC/QA Process:
This is the last process and comes when the client has ordered the study. In this process a final QA/QC is done before the study is emailed to the client. Since we believe in giving our clients a good experience of our research studies, therefore, to make sure that we do not lack at our end in any way humanly possible we do a final round of quality check and then dispatch the study to the client.
By Thermal Component
Cameras
Scopes
Modules
By Modes
Energy Auditing
HVAC System Inspection
Electrical System Inspection
Insulation Inspection
Structural Analysis
Fire/Flare Detection
Others
By End Use Industry
Industrial
Commercial
Residential
Request for Segment Customization as per your Business Requirement: Segment Customization Request
REGIONAL COVERAGE:
North America
US
Canada
Mexico
Europe
Eastern Europe
Poland
Romania
Hungary
Turkey
Rest of Eastern Europe
Western Europe
Germany
France
UK
Italy
Spain
Netherlands
Switzerland
Austria
Rest of Western Europe
Asia-Pacific
China
India
Japan
South Korea
Vietnam
Singapore
Australia
Rest of Asia Pacific
Middle East & Africa
Middle East
UAE
Egypt
Saudi Arabia
Qatar
Rest of the Middle East
Africa
Nigeria
South Africa
Rest of Africa
Latin America
Brazil
Argentina
Colombia
Rest of Latin America
Request for Country Level Research Report: Country Level Customization Request
Available Customization
With the given market data, SNS Insider offers customization as per the company’s specific needs. The following customization options are available for the report:
Product Analysis
Criss-Cross segment analysis (e.g. Product X Application)
Product Matrix which gives a detailed comparison of the product portfolio of each company
Geographic Analysis
Additional countries in any of the regions
Company Information
Detailed analysis and profiling of additional market players (Up to five)
The Arbitrary Waveform Generator Market Size was valued at USD 444.98 Million in 2023 and is expected to grow at a CAGR of 8.79% During 2024-2032.
Explore the Semiconductor Annealing System Market, focusing on rapid thermal processing, laser annealing, and advanced furnace systems. Discover key trends, innovations, and players driving growth in annealing solutions for semiconductor manufacturing pro
The Image Sensor Market size was valued at USD 25.12 billion in 2023 and is expected to grow to USD 50.77 billion by 2032 and grow at a CAGR of 8.13% over the forecast period of 2024-2032
The Volumetric 3D Displays Market Size was valued at USD 322.95 Million in 2023 and is expected to grow at 23.98% CAGR to reach USD 2232.20 Million by 2032
The Liquid Crystal on Silicon (LCoS) Market size was valued at 1.94 Billion in 2023 and is projected to reach USD 3.42 Billion by 2032 with a growing CAGR of 6.49% Over the Forecast Period of 2024-2032.
The Electronic Toll Collection Market Size was valued at USD 9.33 billion in 2023, is expected to grow at 8.34% CAGR to reach USD 19.17 billion by 2032.

Hi! Click one of our member below to chat on Phone
© 2025 All Rights Reserved by SNS Insider Pvt Ltd


