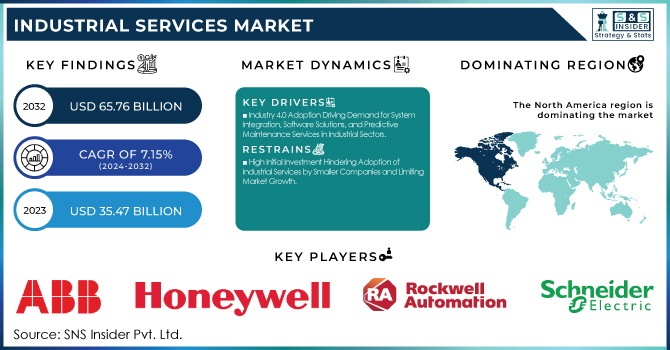
The Industrial Services Market was valued at USD 35.47 billion in 2023 and is expected to reach USD 65.76 billion by 2032, growing at a CAGR of 7.15% from 2024-2032. This report includes insights on the adoption rate of new technologies, industrial service cost analysis, service efficiency metrics, and customer preference trends. The market is driven by increasing digitalization, automation, and the need for cost-effective maintenance solutions. Companies are investing in advanced analytics and AI-driven service models to enhance operational efficiency. Additionally, shifting customer preferences toward predictive maintenance and integrated service solutions are shaping the market’s future.
To get more information on Industrial Services Market - Request Free Sample Report
Drivers
Industry 4.0 Adoption Driving Demand for System Integration, Software Solutions, and Predictive Maintenance Services in Industrial Sectors
As industries transforming quickly through digitalization, services that facilitate effortless integration of sophisticated technologies are in greater demand. System integration services to link different digital platforms, devices, and sources of data are being required more. Software applications such as enterprise resource planning solutions and cloud solutions are being asked for to maximize processes as well as enhance data management. Furthermore, predictive maintenance services are becoming essential, allowing industries to proactively monitor and maintain equipment to reduce downtime and operational costs. This shift toward Industry 4.0 solutions is driving the need for specialized industrial services that support smarter, more efficient operations across manufacturing, logistics, and other industrial sectors.
Restraints
High Initial Investment Hindering Adoption of Industrial Services by Smaller Companies and Limiting Market Growth
The cost of implementing new-age technologies and retrofitting old industrial infrastructure is still a major obstacle for most firms, especially small and medium-sized enterprises. Such firms usually struggle to make investments in automation, system integration, and high-end maintenance solutions, thereby slowing down their digital transformation journey. The upfront cost to invest in technology enhancements, training, and support services might appear daunting, particularly if the advantages of these solutions are far from immediate. This market entry barrier will hinder SMEs from embracing critical industrial services, which in turn will limit the growth of the overall market. Consequently, organizations might resist investing in long-term solutions, which will have an impact on the speed of innovation and modernization in the industrial economy.
Opportunities
Growing Demand for Data Analytics and AI Services to Optimize Operational Efficiency in the Industrial Services Market
As industries increasingly prioritize data-driven decision-making, the need for advanced analytical tools and AI technologies is growing rapidly. Businesses are turning to big data analytics, machine learning, and predictive modeling to optimize processes, reduce operational costs, and enhance decision-making capabilities. By leveraging vast amounts of data, companies can uncover valuable insights, predict future trends, and identify potential risks before they arise. This increased usage of data technology creates massive opportunities for analytics specialists, AI solution providers, and data infrastructure services. As businesses concentrate on streamlining processes for better efficiency, eliminating waste, and increasing productivity, these services are becoming fundamental to staying competitive in the continually changing industrial economy.
Challenges
Global supply chain disruptions remain a major obstacle for the industrial services market. Procurement delays for key components and materials may cause project delay and cost escalation for service providers. Disruptions usually impact the timely delivery of services like system integration, equipment maintenance, and infrastructure upgrade. When the global logistics networks are disrupted, it is increasingly hard to deliver client orders within time, which decreases customers' satisfaction and constrains business opportunities. Besides, businesses can also incur increasing costs as the material shortage causes a problem, and indirectly affect businesses' competitiveness. These persistent problems create a stumbling block to market operations smoothly, and may impede growth and innovation in the industrial services sector.
By Type
The Operational Improvement & Maintenance segment dominated the Industrial Services Market in 2023, capturing the highest revenue share of about 47%. This dominance can be attributed to the critical need for industries to minimize downtime, optimize operations, and extend the life of machinery. As businesses focus on efficiency and cost reduction, maintenance and continuous operational improvements become essential, driving sustained demand for these services across sectors.
The Installation & Commissioning segment is expected to grow at the fastest CAGR of about 8.64% from 2024 to 2032. This rapid growth is driven by the increasing demand for the integration of advanced technologies and new systems across industries. As companies adopt automation, IoT, and digital solutions, the need for professional installation and seamless commissioning services becomes crucial for ensuring optimal functionality and system performance.
By Application
The Distributed Control System segment led the Industrial Services Market in 2023 with the largest revenue share of approximately 27%. DCS systems play a vital role in industries needing accurate, ongoing control of complicated processes, e.g., chemical and power plants. Their potential to enhance efficiency, guarantee safety, and deliver real-time monitoring and control renders them indispensable, fueling broad use and market leadership.
The Manufacturing Execution System segment is also anticipated to grow at the fastest CAGR of approximately 9.96% during 2024-2032. Due to the industries' growing importance on real-time production data, MES solutions are essential for driving operational efficiency, quality, and supply chain performance. Their function to streamline the production process, minimize lead time, and align with regulatory guidelines is driving organizations to adopt these solutions, fuelling the sector's high growth in the subsequent years.
By End Use
The Oil and Gas segment dominated the Industrial Services Market in 2023, capturing the highest revenue share of about 34%. This dominance is due to the sector’s large-scale infrastructure, complex operational needs, and ongoing demand for maintenance, repair, and efficiency improvement services. The oil and gas industry’s critical role in the global economy, alongside its emphasis on safety, automation, and cost reduction, drives continuous investment in industrial services.
The Pharmaceuticals segment is expected to grow at the fastest CAGR of about 9.43% from 2024 to 2032. This rapid growth is driven by the increasing demand for high-quality, precision manufacturing processes, along with the need for regulatory compliance in drug production. The rising emphasis on biotechnology, personalized medicine, and advanced manufacturing technologies is further fueling demand for specialized industrial services in the pharmaceutical sector.
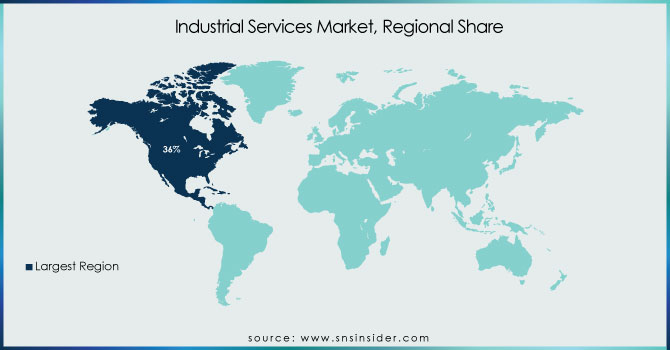
North America dominated the Industrial Services Market in 2023, holding the highest revenue share of about 36%. This dominance is largely driven by the region’s advanced industrial infrastructure, strong demand for automation, and the significant adoption of Industry 4.0 technologies. North America also benefits from a robust manufacturing sector, high levels of investment in R&D, and a favorable regulatory environment, which creates sustained demand for operational improvements, maintenance, and technology-driven industrial services.
Asia Pacific is expected to grow at the fastest CAGR of about 8.81% from 2024 to 2032. The rapid industrialization in emerging markets, such as China and India, is driving this growth. The increasing adoption of automation, IoT, and smart technologies in manufacturing processes, along with investments in infrastructure and energy, is fueling demand for industrial services. Additionally, the region’s large labor force and cost-effective production models contribute to the accelerated market expansion.
Get Customized Report as per Your Business Requirement - Enquiry Now
ABB (Robotic Automation Solutions, Process Control Systems)
Honeywell International Inc. (Industrial Cybersecurity, Building Automation Solutions)
Rockwell Automation (Industrial Control Systems, Manufacturing Execution Systems)
Schneider Electric (Energy Management Solutions, Industrial Automation Software)
Siemens (SCADA Systems, Digital Twin Technology)
General Electric (Predictive Maintenance Solutions, Power Automation Systems)
Emerson Electric Co. (Flow Control Solutions, Industrial IoT Solutions)
Yokogawa Electric Corporation (Process Automation Systems, Industrial AI Solutions)
Eaton (Power Quality Solutions, Industrial Energy Management)
Mitsubishi Electric Corporation (Factory Automation Systems, Servo Motors)
Metso (Mining Automation Solutions, Valve Control Systems)
Samson (Industrial Valves, Process Control Equipment)
SKF (Predictive Maintenance Solutions, Asset Management Systems)
John Wood Group PLC (Engineering Consulting, Industrial Asset Optimization)
ATS Automation Tooling Systems Inc. (Automated Assembly Systems, Industrial Robotics)
Dynamysk Automation Ltd. (Process Automation Engineering, Control System Integration)
Wunderlich-Malec Engineering, Inc. (SCADA Integration, Industrial Automation Design)
Yaskawa America, Inc. (Motion Control Systems, Robotics Solutions)
Fuji Electric Co., Ltd. (Industrial Power Electronics, Factory Automation Solutions)
Genpact (Industrial Analytics Solutions, Digital Process Transformation)
ICONICS, Inc. (HMI/SCADA Software, Industrial IoT Solutions)
In February 2025, ABB and Bilfinger formed a partnership to enhance operational efficiency in industries like energy, chemicals, and pharma by offering advanced instrumentation and digital technologies. The collaboration focuses on sustainable energy solutions, including hydrogen and carbon capture, to drive industry performance and sustainability improvements.
In November 2024, Rockwell Automation and Microsoft expanded their strategic collaboration to accelerate industrial transformation by providing advanced cloud and AI solutions that enhance data insights, streamline operations, and improve scalability for manufacturers.
| Report Attributes | Details |
|---|---|
| Market Size in 2023 | USD 35.47 Billion |
| Market Size by 2032 | USD 65.76 Billion |
| CAGR | CAGR of 7.15% From 2024 to 2032 |
| Base Year | 2023 |
| Forecast Period | 2024-2032 |
| Historical Data | 2020-2022 |
| Report Scope & Coverage | Market Size, Segments Analysis, Competitive Landscape, Regional Analysis, DROC & SWOT Analysis, Forecast Outlook |
| Key Segments | • By Type (Engineering & Consulting, Installation & Commissioning, Operational Improvement & Maintenance) • By Application (Distributed Control System (DCS), Programmable Controller Logic (PLC), Supervisory Control and Data Acquisition (SCADA), Electric Motors & Drives, Valves & Actuators, Manufacturing Execution System, Others) • By End Use (Oil and Gas, Chemicals, Automotive, Pharmaceuticals, Others) |
| Regional Analysis/Coverage | North America (US, Canada, Mexico), Europe (Eastern Europe [Poland, Romania, Hungary, Turkey, Rest of Eastern Europe] Western Europe] Germany, France, UK, Italy, Spain, Netherlands, Switzerland, Austria, Rest of Western Europe]), Asia Pacific (China, India, Japan, South Korea, Vietnam, Singapore, Australia, Rest of Asia Pacific), Middle East & Africa (Middle East [UAE, Egypt, Saudi Arabia, Qatar, Rest of Middle East], Africa [Nigeria, South Africa, Rest of Africa], Latin America (Brazil, Argentina, Colombia, Rest of Latin America) |
| Company Profiles | ABB, Honeywell International Inc., Rockwell Automation, Schneider Electric, Siemens, General Electric, Emerson Electric Co., Yokogawa Electric Corporation, Eaton, Mitsubishi Electric Corporation, Metso, Samson, SKF, John Wood Group PLC, ATS Automation Tooling Systems Inc., Dynamysk Automation Ltd., Wunderlich-Malec Engineering, Inc., Yaskawa America, Inc., Fuji Electric Co., Ltd., Genpact, ICONICS, Inc. |
ANS: Industrial Services Market was valued at USD 35.47 billion in 2023 and is expected to reach USD 65.76 billion by 2032, growing at a CAGR of 7.15% from 2024-2032.
ANS: The Operational Improvement & Maintenance segment dominated with the highest revenue share of about 47%.
ANS: The Distributed Control System (DCS) segment dominated with about 27% of the market share.
ANS: North America dominated the market with a revenue share of about 36%.
ANS: The increasing digitalization, automation, and demand for cost-effective maintenance solutions are driving the market growth.
Table of Contents:
1. Introduction
1.1 Market Definition
1.2 Scope (Inclusion and Exclusions)
1.3 Research Assumptions
2. Executive Summary
2.1 Market Overview
2.2 Regional Synopsis
2.3 Competitive Summary
3. Research Methodology
3.1 Top-Down Approach
3.2 Bottom-up Approach
3.3. Data Validation
3.4 Primary Interviews
4. Market Dynamics Impact Analysis
4.1 Market Driving Factors Analysis
4.1.1 Drivers
4.1.2 Restraints
4.1.3 Opportunities
4.1.4 Challenges
4.2 PESTLE Analysis
4.3 Porter’s Five Forces Model
5. Statistical Insights and Trends Reporting
5.1 Adoption Rate of New Technologies
5.2 Industrial Service Cost Analysis
5.3 Service Efficiency Metrics
5.4 Customer Preference Trends
6. Competitive Landscape
6.1 List of Major Companies, By Region
6.2 Market Share Analysis, By Region
6.3 Product Benchmarking
6.3.1 Product specifications and features
6.3.2 Pricing
6.4 Strategic Initiatives
6.4.1 Marketing and promotional activities
6.4.2 Distribution and supply chain strategies
6.4.3 Expansion plans and new product launches
6.4.4 Strategic partnerships and collaborations
6.5 Technological Advancements
6.6 Market Positioning and Branding
7. Industrial Services Market Segmentation, By Type
7.1 Chapter Overview
7.2 Engineering & Consulting
7.2.1 Engineering & Consulting Market Trends Analysis (2020-2032)
7.2.2 Engineering & Consulting Market Size Estimates and Forecasts to 2032 (USD Billion)
7.3 Installation & Commissioning
7.3.1 Installation & Commissioning Market Trends Analysis (2020-2032)
7.3.2 Installation & Commissioning Market Size Estimates and Forecasts to 2032 (USD Billion)
7.4 Operational Improvement & Maintenance
7.4.1 Operational Improvement & Maintenance Market Trends Analysis (2020-2032)
7.4.2 Operational Improvement & Maintenance Market Size Estimates and Forecasts to 2032 (USD Billion)
8. Industrial Services Market Segmentation, By Application
8.1 Chapter Overview
8.2 Distributed Control System (DCS)
8.2.1 Distributed Control System (DCS) Market Trends Analysis (2020-2032)
8.2.2 Distributed Control System (DCS) Market Size Estimates and Forecasts to 2032 (USD Billion)
8.3 Programmable Controller Logic (PLC)
8.3.1 Programmable Controller Logic (PLC) Market Trends Analysis (2020-2032)
8.3.2 Programmable Controller Logic (PLC) Market Size Estimates and Forecasts to 2032 (USD Billion)
8.4 Supervisory Control and Data Acquisition (SCADA)
8.4.1 Supervisory Control and Data Acquisition (SCADA) Market Trends Analysis (2020-2032)
8.4.2 Supervisory Control and Data Acquisition (SCADA) Market Size Estimates and Forecasts to 2032 (USD Billion)
8.5 Electric Motors & Drives
8.5.1 Electric Motors & Drives Market Trends Analysis (2020-2032)
8.5.2 Electric Motors & Drives Market Size Estimates and Forecasts to 2032 (USD Billion)
8.6 Valves & Actuators
8.6.1 Valves & Actuators Market Trends Analysis (2020-2032)
8.6.2 Valves & Actuators Market Size Estimates and Forecasts to 2032 (USD Billion)
8.7 Manufacturing Execution System
8.7.1 Manufacturing Execution System Market Trends Analysis (2020-2032)
8.7.2 Manufacturing Execution System Market Size Estimates and Forecasts to 2032 (USD Billion)
8.8 Others
8.8.1 Others Market Trends Analysis (2020-2032)
8.8.2 Others Market Size Estimates and Forecasts to 2032 (USD Billion)
9. Industrial Services Market Segmentation, By End Use
9.1 Chapter Overview
9.2 Oil and Gas
9.2.1 Oil and Gas Market Trends Analysis (2020-2032)
9.2.2 Oil and Gas Market Size Estimates and Forecasts to 2032 (USD Billion)
9.3 Chemicals
9.3.1 Chemicals Market Trends Analysis (2020-2032)
9.3.2 Chemicals Market Size Estimates and Forecasts to 2032 (USD Billion)
9.4 Automotive
9.4.1 Automotive Market Trends Analysis (2020-2032)
9.4.2 Automotive Market Size Estimates and Forecasts to 2032 (USD Billion)
9.5 Pharmaceuticals
9.5.1 Pharmaceuticals Market Trends Analysis (2020-2032)
9.5.2 Pharmaceuticals Market Size Estimates and Forecasts to 2032 (USD Billion)
9.6 Others
9.6.1 Others Market Trends Analysis (2020-2032)
9.6.2 Others Market Size Estimates and Forecasts to 2032 (USD Billion)
10. Regional Analysis
10.1 Chapter Overview
10.2 North America
10.2.1 Trends Analysis
10.2.2 North America Industrial Services Market Estimates and Forecasts, by Country (2020-2032) (USD Billion)
10.2.3 North America Industrial Services Market Estimates and Forecasts, By Type (2020-2032) (USD Billion)
10.2.4 North America Industrial Services Market Estimates and Forecasts, By Application (2020-2032) (USD Billion)
10.2.5 North America Industrial Services Market Estimates and Forecasts, By End Use (2020-2032) (USD Billion)
10.2.6 USA
10.2.6.1 USA Industrial Services Market Estimates and Forecasts, By Type (2020-2032) (USD Billion)
10.2.6.2 USA Industrial Services Market Estimates and Forecasts, By Application (2020-2032) (USD Billion)
10.2.6.3 USA Industrial Services Market Estimates and Forecasts, By End Use (2020-2032) (USD Billion)
10.2.7 Canada
10.2.7.1 Canada Industrial Services Market Estimates and Forecasts, By Type (2020-2032) (USD Billion)
10.2.7.2 Canada Industrial Services Market Estimates and Forecasts, By Application (2020-2032) (USD Billion)
10.2.7.3 Canada Industrial Services Market Estimates and Forecasts, By End Use (2020-2032) (USD Billion)
10.2.8 Mexico
10.2.8.1 Mexico Industrial Services Market Estimates and Forecasts, By Type (2020-2032) (USD Billion)
10.2.8.2 Mexico Industrial Services Market Estimates and Forecasts, By Application (2020-2032) (USD Billion)
10.2.8.3 Mexico Industrial Services Market Estimates and Forecasts, By End Use (2020-2032) (USD Billion)
10.3 Europe
10.3.1 Eastern Europe
10.3.1.1 Trends Analysis
10.3.1.2 Eastern Europe Industrial Services Market Estimates and Forecasts, by Country (2020-2032) (USD Billion)
10.3.1.3 Eastern Europe Industrial Services Market Estimates and Forecasts, By Type (2020-2032) (USD Billion)
10.3.1.4 Eastern Europe Industrial Services Market Estimates and Forecasts, By Application (2020-2032) (USD Billion)
10.3.1.5 Eastern Europe Industrial Services Market Estimates and Forecasts, By End Use (2020-2032) (USD Billion)
10.3.1.6 Poland
10.3.1.6.1 Poland Industrial Services Market Estimates and Forecasts, By Type (2020-2032) (USD Billion)
10.3.1.6.2 Poland Industrial Services Market Estimates and Forecasts, By Application (2020-2032) (USD Billion)
10.3.1.6.3 Poland Industrial Services Market Estimates and Forecasts, By End Use (2020-2032) (USD Billion)
10.3.1.7 Romania
10.3.1.7.1 Romania Industrial Services Market Estimates and Forecasts, By Type (2020-2032) (USD Billion)
10.3.1.7.2 Romania Industrial Services Market Estimates and Forecasts, By Application (2020-2032) (USD Billion)
10.3.1.7.3 Romania Industrial Services Market Estimates and Forecasts, By End Use (2020-2032) (USD Billion)
10.3.1.8 Hungary
10.3.1.8.1 Hungary Industrial Services Market Estimates and Forecasts, By Type (2020-2032) (USD Billion)
10.3.1.8.2 Hungary Industrial Services Market Estimates and Forecasts, By Application (2020-2032) (USD Billion)
10.3.1.8.3 Hungary Industrial Services Market Estimates and Forecasts, By End Use (2020-2032) (USD Billion)
10.3.1.9 Turkey
10.3.1.9.1 Turkey Industrial Services Market Estimates and Forecasts, By Type (2020-2032) (USD Billion)
10.3.1.9.2 Turkey Industrial Services Market Estimates and Forecasts, By Application (2020-2032) (USD Billion)
10.3.1.9.3 Turkey Industrial Services Market Estimates and Forecasts, By End Use (2020-2032) (USD Billion)
10.3.1.10 Rest of Eastern Europe
10.3.1.10.1 Rest of Eastern Europe Industrial Services Market Estimates and Forecasts, By Type (2020-2032) (USD Billion)
10.3.1.10.2 Rest of Eastern Europe Industrial Services Market Estimates and Forecasts, By Application (2020-2032) (USD Billion)
10.3.1.10.3 Rest of Eastern Europe Industrial Services Market Estimates and Forecasts, By End Use (2020-2032) (USD Billion)
10.3.2 Western Europe
10.3.2.1 Trends Analysis
10.3.2.2 Western Europe Industrial Services Market Estimates and Forecasts, by Country (2020-2032) (USD Billion)
10.3.2.3 Western Europe Industrial Services Market Estimates and Forecasts, By Type (2020-2032) (USD Billion)
10.3.2.4 Western Europe Industrial Services Market Estimates and Forecasts, By Application (2020-2032) (USD Billion)
10.3.2.5 Western Europe Industrial Services Market Estimates and Forecasts, By End Use (2020-2032) (USD Billion)
10.3.2.6 Germany
10.3.2.6.1 Germany Industrial Services Market Estimates and Forecasts, By Type (2020-2032) (USD Billion)
10.3.2.6.2 Germany Industrial Services Market Estimates and Forecasts, By Application (2020-2032) (USD Billion)
10.3.2.6.3 Germany Industrial Services Market Estimates and Forecasts, By End Use (2020-2032) (USD Billion)
10.3.2.7 France
10.3.2.7.1 France Industrial Services Market Estimates and Forecasts, By Type (2020-2032) (USD Billion)
10.3.2.7.2 France Industrial Services Market Estimates and Forecasts, By Application (2020-2032) (USD Billion)
10.3.2.7.3 France Industrial Services Market Estimates and Forecasts, By End Use (2020-2032) (USD Billion)
10.3.2.8 UK
10.3.2.8.1 UK Industrial Services Market Estimates and Forecasts, By Type (2020-2032) (USD Billion)
10.3.2.8.2 UK Industrial Services Market Estimates and Forecasts, By Application (2020-2032) (USD Billion)
10.3.2.8.3 UK Industrial Services Market Estimates and Forecasts, By End Use (2020-2032) (USD Billion)
10.3.2.9 Italy
10.3.2.9.1 Italy Industrial Services Market Estimates and Forecasts, By Type (2020-2032) (USD Billion)
10.3.2.9.2 Italy Industrial Services Market Estimates and Forecasts, By Application (2020-2032) (USD Billion)
10.3.2.9.3 Italy Industrial Services Market Estimates and Forecasts, By End Use (2020-2032) (USD Billion)
10.3.2.10 Spain
10.3.2.10.1 Spain Industrial Services Market Estimates and Forecasts, By Type (2020-2032) (USD Billion)
10.3.2.10.2 Spain Industrial Services Market Estimates and Forecasts, By Application (2020-2032) (USD Billion)
10.3.2.10.3 Spain Industrial Services Market Estimates and Forecasts, By End Use (2020-2032) (USD Billion)
10.3.2.11 Netherlands
10.3.2.11.1 Netherlands Industrial Services Market Estimates and Forecasts, By Type (2020-2032) (USD Billion)
10.3.2.11.2 Netherlands Industrial Services Market Estimates and Forecasts, By Application (2020-2032) (USD Billion)
10.3.2.11.3 Netherlands Industrial Services Market Estimates and Forecasts, By End Use (2020-2032) (USD Billion)
10.3.2.12 Switzerland
10.3.2.12.1 Switzerland Industrial Services Market Estimates and Forecasts, By Type (2020-2032) (USD Billion)
10.3.2.12.2 Switzerland Industrial Services Market Estimates and Forecasts, By Application (2020-2032) (USD Billion)
10.3.2.12.3 Switzerland Industrial Services Market Estimates and Forecasts, By End Use (2020-2032) (USD Billion)
10.3.2.13 Austria
10.3.2.13.1 Austria Industrial Services Market Estimates and Forecasts, By Type (2020-2032) (USD Billion)
10.3.2.13.2 Austria Industrial Services Market Estimates and Forecasts, By Application (2020-2032) (USD Billion)
10.3.2.13.3 Austria Industrial Services Market Estimates and Forecasts, By End Use (2020-2032) (USD Billion)
10.3.2.14 Rest of Western Europe
10.3.2.14.1 Rest of Western Europe Industrial Services Market Estimates and Forecasts, By Type (2020-2032) (USD Billion)
10.3.2.14.2 Rest of Western Europe Industrial Services Market Estimates and Forecasts, By Application (2020-2032) (USD Billion)
10.3.2.14.3 Rest of Western Europe Industrial Services Market Estimates and Forecasts, By End Use (2020-2032) (USD Billion)
10.4 Asia Pacific
10.4.1 Trends Analysis
10.4.2 Asia Pacific Industrial Services Market Estimates and Forecasts, by Country (2020-2032) (USD Billion)
10.4.3 Asia Pacific Industrial Services Market Estimates and Forecasts, By Type (2020-2032) (USD Billion)
10.4.4 Asia Pacific Industrial Services Market Estimates and Forecasts, By Application (2020-2032) (USD Billion)
10.4.5 Asia Pacific Industrial Services Market Estimates and Forecasts, By End Use (2020-2032) (USD Billion)
10.4.6 China
10.4.6.1 China Industrial Services Market Estimates and Forecasts, By Type (2020-2032) (USD Billion)
10.4.6.2 China Industrial Services Market Estimates and Forecasts, By Application (2020-2032) (USD Billion)
10.4.6.3 China Industrial Services Market Estimates and Forecasts, By End Use (2020-2032) (USD Billion)
10.4.7 India
10.4.7.1 India Industrial Services Market Estimates and Forecasts, By Type (2020-2032) (USD Billion)
10.4.7.2 India Industrial Services Market Estimates and Forecasts, By Application (2020-2032) (USD Billion)
10.4.7.3 India Industrial Services Market Estimates and Forecasts, By End Use (2020-2032) (USD Billion)
10.4.8 Japan
10.4.8.1 Japan Industrial Services Market Estimates and Forecasts, By Type (2020-2032) (USD Billion)
10.4.8.2 Japan Industrial Services Market Estimates and Forecasts, By Application (2020-2032) (USD Billion)
10.4.8.3 Japan Industrial Services Market Estimates and Forecasts, By End Use (2020-2032) (USD Billion)
10.4.9 South Korea
10.4.9.1 South Korea Industrial Services Market Estimates and Forecasts, By Type (2020-2032) (USD Billion)
10.4.9.2 South Korea Industrial Services Market Estimates and Forecasts, By Application (2020-2032) (USD Billion)
10.4.9.3 South Korea Industrial Services Market Estimates and Forecasts, By End Use (2020-2032) (USD Billion)
10.4.10 Vietnam
10.4.10.1 Vietnam Industrial Services Market Estimates and Forecasts, By Type (2020-2032) (USD Billion)
10.4.10.2 Vietnam Industrial Services Market Estimates and Forecasts, By Application (2020-2032) (USD Billion)
10.4.10.3 Vietnam Industrial Services Market Estimates and Forecasts, By End Use (2020-2032) (USD Billion)
10.4.11 Singapore
10.4.11.1 Singapore Industrial Services Market Estimates and Forecasts, By Type (2020-2032) (USD Billion)
10.4.11.2 Singapore Industrial Services Market Estimates and Forecasts, By Application (2020-2032) (USD Billion)
10.4.11.3 Singapore Industrial Services Market Estimates and Forecasts, By End Use (2020-2032) (USD Billion)
10.4.12 Australia
10.4.12.1 Australia Industrial Services Market Estimates and Forecasts, By Type (2020-2032) (USD Billion)
10.4.12.2 Australia Industrial Services Market Estimates and Forecasts, By Application (2020-2032) (USD Billion)
10.4.12.3 Australia Industrial Services Market Estimates and Forecasts, By End Use (2020-2032) (USD Billion)
10.4.13 Rest of Asia Pacific
10.4.13.1 Rest of Asia Pacific Industrial Services Market Estimates and Forecasts, By Type (2020-2032) (USD Billion)
10.4.13.2 Rest of Asia Pacific Industrial Services Market Estimates and Forecasts, By Application (2020-2032) (USD Billion)
10.4.13.3 Rest of Asia Pacific Industrial Services Market Estimates and Forecasts, By End Use (2020-2032) (USD Billion)
10.5 Middle East and Africa
10.5.1 Middle East
10.5.1.1 Trends Analysis
10.5.1.2 Middle East Industrial Services Market Estimates and Forecasts, by Country (2020-2032) (USD Billion)
10.5.1.3 Middle East Industrial Services Market Estimates and Forecasts, By Type (2020-2032) (USD Billion)
10.5.1.4 Middle East Industrial Services Market Estimates and Forecasts, By Application (2020-2032) (USD Billion)
10.5.1.5 Middle East Industrial Services Market Estimates and Forecasts, By End Use (2020-2032) (USD Billion)
10.5.1.6 UAE
10.5.1.6.1 UAE Industrial Services Market Estimates and Forecasts, By Type (2020-2032) (USD Billion)
10.5.1.6.2 UAE Industrial Services Market Estimates and Forecasts, By Application (2020-2032) (USD Billion)
10.5.1.6.3 UAE Industrial Services Market Estimates and Forecasts, By End Use (2020-2032) (USD Billion)
10.5.1.7 Egypt
10.5.1.7.1 Egypt Industrial Services Market Estimates and Forecasts, By Type (2020-2032) (USD Billion)
10.5.1.7.2 Egypt Industrial Services Market Estimates and Forecasts, By Application (2020-2032) (USD Billion)
10.5.1.7.3 Egypt Industrial Services Market Estimates and Forecasts, By End Use (2020-2032) (USD Billion)
10.5.1.8 Saudi Arabia
10.5.1.8.1 Saudi Arabia Industrial Services Market Estimates and Forecasts, By Type (2020-2032) (USD Billion)
10.5.1.8.2 Saudi Arabia Industrial Services Market Estimates and Forecasts, By Application (2020-2032) (USD Billion)
10.5.1.8.3 Saudi Arabia Industrial Services Market Estimates and Forecasts, By End Use (2020-2032) (USD Billion)
10.5.1.9 Qatar
10.5.1.9.1 Qatar Industrial Services Market Estimates and Forecasts, By Type (2020-2032) (USD Billion)
10.5.1.9.2 Qatar Industrial Services Market Estimates and Forecasts, By Application (2020-2032) (USD Billion)
10.5.1.9.3 Qatar Industrial Services Market Estimates and Forecasts, By End Use (2020-2032) (USD Billion)
10.5.1.10 Rest of Middle East
10.5.1.10.1 Rest of Middle East Industrial Services Market Estimates and Forecasts, By Type (2020-2032) (USD Billion)
10.5.1.10.2 Rest of Middle East Industrial Services Market Estimates and Forecasts, By Application (2020-2032) (USD Billion)
10.5.1.10.3 Rest of Middle East Industrial Services Market Estimates and Forecasts, By End Use (2020-2032) (USD Billion)
10.5.2 Africa
10.5.2.1 Trends Analysis
10.5.2.2 Africa Industrial Services Market Estimates and Forecasts, by Country (2020-2032) (USD Billion)
10.5.2.3 Africa Industrial Services Market Estimates and Forecasts, By Type (2020-2032) (USD Billion)
10.5.2.4 Africa Industrial Services Market Estimates and Forecasts, By Application (2020-2032) (USD Billion)
10.5.2.5 Africa Industrial Services Market Estimates and Forecasts, By End Use (2020-2032) (USD Billion)
10.5.2.6 South Africa
10.5.2.6.1 South Africa Industrial Services Market Estimates and Forecasts, By Type (2020-2032) (USD Billion)
10.5.2.6.2 South Africa Industrial Services Market Estimates and Forecasts, By Application (2020-2032) (USD Billion)
10.5.2.6.3 South Africa Industrial Services Market Estimates and Forecasts, By End Use (2020-2032) (USD Billion)
10.5.2.7 Nigeria
10.5.2.7.1 Nigeria Industrial Services Market Estimates and Forecasts, By Type (2020-2032) (USD Billion)
10.5.2.7.2 Nigeria Industrial Services Market Estimates and Forecasts, By Application (2020-2032) (USD Billion)
10.5.2.7.3 Nigeria Industrial Services Market Estimates and Forecasts, By End Use (2020-2032) (USD Billion)
10.5.2.8 Rest of Africa
10.5.2.8.1 Rest of Africa Industrial Services Market Estimates and Forecasts, By Type (2020-2032) (USD Billion)
10.5.2.8.2 Rest of Africa Industrial Services Market Estimates and Forecasts, By Application (2020-2032) (USD Billion)
10.5.2.8.3 Rest of Africa Industrial Services Market Estimates and Forecasts, By End Use (2020-2032) (USD Billion)
10.6 Latin America
10.6.1 Trends Analysis
10.6.2 Latin America Industrial Services Market Estimates and Forecasts, by Country (2020-2032) (USD Billion)
10.6.3 Latin America Industrial Services Market Estimates and Forecasts, By Type (2020-2032) (USD Billion)
10.6.4 Latin America Industrial Services Market Estimates and Forecasts, By Application (2020-2032) (USD Billion)
10.6.5 Latin America Industrial Services Market Estimates and Forecasts, By End Use (2020-2032) (USD Billion)
10.6.6 Brazil
10.6.6.1 Brazil Industrial Services Market Estimates and Forecasts, By Type (2020-2032) (USD Billion)
10.6.6.2 Brazil Industrial Services Market Estimates and Forecasts, By Application (2020-2032) (USD Billion)
10.6.6.3 Brazil Industrial Services Market Estimates and Forecasts, By End Use (2020-2032) (USD Billion)
10.6.7 Argentina
10.6.7.1 Argentina Industrial Services Market Estimates and Forecasts, By Type (2020-2032) (USD Billion)
10.6.7.2 Argentina Industrial Services Market Estimates and Forecasts, By Application (2020-2032) (USD Billion)
10.6.7.3 Argentina Industrial Services Market Estimates and Forecasts, By End Use (2020-2032) (USD Billion)
10.6.8 Colombia
10.6.8.1 Colombia Industrial Services Market Estimates and Forecasts, By Type (2020-2032) (USD Billion)
10.6.8.2 Colombia Industrial Services Market Estimates and Forecasts, By Application (2020-2032) (USD Billion)
10.6.8.3 Colombia Industrial Services Market Estimates and Forecasts, By End Use (2020-2032) (USD Billion)
10.6.9 Rest of Latin America
10.6.9.1 Rest of Latin America Industrial Services Market Estimates and Forecasts, By Type (2020-2032) (USD Billion)
10.6.9.2 Rest of Latin America Industrial Services Market Estimates and Forecasts, By Application (2020-2032) (USD Billion)
10.6.9.3 Rest of Latin America Industrial Services Market Estimates and Forecasts, By End Use (2020-2032) (USD Billion)
11. Company Profiles
11.1 ABB
11.1.1 Company Overview
11.1.2 Financial
11.1.3 Products/ Services Offered
11.1.4 SWOT Analysis
11.2 Honeywell International Inc.
11.2.1 Company Overview
11.2.2 Financial
11.2.3 Products/ Services Offered
11.2.4 SWOT Analysis
11.3 Rockwell Automation
11.3.1 Company Overview
11.3.2 Financial
11.3.3 Products/ Services Offered
11.3.4 SWOT Analysis
11.4 Schneider Electric
11.4.1 Company Overview
11.4.2 Financial
11.4.3 Products/ Services Offered
11.4.4 SWOT Analysis
11.5 Siemens
11.5.1 Company Overview
11.5.2 Financial
11.5.3 Products/ Services Offered
11.5.4 SWOT Analysis
11.6 General Electric
11.6.1 Company Overview
11.6.2 Financial
11.6.3 Products/ Services Offered
11.6.4 SWOT Analysis
11.7 Emerson Electric Co.
11.7.1 Company Overview
11.7.2 Financial
11.7.3 Products/ Services Offered
11.7.4 SWOT Analysis
11.8 Yokogawa Electric Corporation
11.8.1 Company Overview
11.8.2 Financial
11.8.3 Products/ Services Offered
11.8.4 SWOT Analysis
11.9 Eaton
11.9.1 Company Overview
11.9.2 Financial
11.9.3 Products/ Services Offered
11.9.4 SWOT Analysis
11.10 Mitsubishi Electric Corporation
11.10.1 Company Overview
11.10.2 Financial
11.10.3 Products/ Services Offered
11.10.4 SWOT Analysis
12. Use Cases and Best Practices
13. Conclusion
An accurate research report requires proper strategizing as well as implementation. There are multiple factors involved in the completion of good and accurate research report and selecting the best methodology to compete the research is the toughest part. Since the research reports we provide play a crucial role in any company’s decision-making process, therefore we at SNS Insider always believe that we should choose the best method which gives us results closer to reality. This allows us to reach at a stage wherein we can provide our clients best and accurate investment to output ratio.
Each report that we prepare takes a timeframe of 350-400 business hours for production. Starting from the selection of titles through a couple of in-depth brain storming session to the final QC process before uploading our titles on our website we dedicate around 350 working hours. The titles are selected based on their current market cap and the foreseen CAGR and growth.
The 5 steps process:
Step 1: Secondary Research:
Secondary Research or Desk Research is as the name suggests is a research process wherein, we collect data through the readily available information. In this process we use various paid and unpaid databases which our team has access to and gather data through the same. This includes examining of listed companies’ annual reports, Journals, SEC filling etc. Apart from this our team has access to various associations across the globe across different industries. Lastly, we have exchange relationships with various university as well as individual libraries.

Step 2: Primary Research
When we talk about primary research, it is a type of study in which the researchers collect relevant data samples directly, rather than relying on previously collected data. This type of research is focused on gaining content specific facts that can be sued to solve specific problems. Since the collected data is fresh and first hand therefore it makes the study more accurate and genuine.
We at SNS Insider have divided Primary Research into 2 parts.
Part 1 wherein we interview the KOLs of major players as well as the upcoming ones across various geographic regions. This allows us to have their view over the market scenario and acts as an important tool to come closer to the accurate market numbers. As many as 45 paid and unpaid primary interviews are taken from both the demand and supply side of the industry to make sure we land at an accurate judgement and analysis of the market.
This step involves the triangulation of data wherein our team analyses the interview transcripts, online survey responses and observation of on filed participants. The below mentioned chart should give a better understanding of the part 1 of the primary interview.

Part 2: In this part of primary research the data collected via secondary research and the part 1 of the primary research is validated with the interviews from individual consultants and subject matter experts.
Consultants are those set of people who have at least 12 years of experience and expertise within the industry whereas Subject Matter Experts are those with at least 15 years of experience behind their back within the same space. The data with the help of two main processes i.e., FGDs (Focused Group Discussions) and IDs (Individual Discussions). This gives us a 3rd party nonbiased primary view of the market scenario making it a more dependable one while collation of the data pointers.
Step 3: Data Bank Validation
Once all the information is collected via primary and secondary sources, we run that information for data validation. At our intelligence centre our research heads track a lot of information related to the market which includes the quarterly reports, the daily stock prices, and other relevant information. Our data bank server gets updated every fortnight and that is how the information which we collected using our primary and secondary information is revalidated in real time.

Step 4: QA/QC Process
After all the data collection and validation our team does a final level of quality check and quality assurance to get rid of any unwanted or undesired mistakes. This might include but not limited to getting rid of the any typos, duplication of numbers or missing of any important information. The people involved in this process include technical content writers, research heads and graphics people. Once this process is completed the title gets uploader on our platform for our clients to read it.
Step 5: Final QC/QA Process:
This is the last process and comes when the client has ordered the study. In this process a final QA/QC is done before the study is emailed to the client. Since we believe in giving our clients a good experience of our research studies, therefore, to make sure that we do not lack at our end in any way humanly possible we do a final round of quality check and then dispatch the study to the client.
Key Segments:
By Type
Engineering & Consulting
Installation & Commissioning
Operational Improvement & Maintenance
By Application
Distributed Control System (DCS)
Programmable Controller Logic (PLC)
Supervisory Control and Data Acquisition (SCADA)
Electric Motors & Drives
Valves & Actuators
Manufacturing Execution System
Others
By End Use
Oil and Gas
Chemicals
Automotive
Pharmaceuticals
Others
Request for Segment Customization as per your Business Requirement: Segment Customization Request
Regional Coverage:
North America
US
Canada
Mexico
Europe
Eastern Europe
Poland
Romania
Hungary
Turkey
Rest of Eastern Europe
Western Europe
Germany
France
UK
Italy
Spain
Netherlands
Switzerland
Austria
Rest of Western Europe
Asia Pacific
China
India
Japan
South Korea
Vietnam
Singapore
Australia
Rest of Asia Pacific
Middle East & Africa
Middle East
UAE
Egypt
Saudi Arabia
Qatar
Rest of Middle East
Africa
Nigeria
South Africa
Rest of Africa
Latin America
Brazil
Argentina
Colombia
Rest of Latin America
Request for Country Level Research Report: Country Level Customization Request
Available Customization
With the given market data, SNS Insider offers customization as per the company’s specific needs. The following customization options are available for the report:
Detailed Volume Analysis
Criss-Cross segment analysis (e.g. Product X Application)
Competitive Product Benchmarking
Geographic Analysis
Additional countries in any of the regions
Customized Data Representation
Detailed analysis and profiling of additional market players
The Decentralized Finance (DeFi) Market Size was valued at USD 17.1 Billion in 2023 and is expected to reach USD 531.5 Billion by 2032, growing at a CAGR of 46.5% over the forecast period 2024-2032.
The Video Game Market Size was valued at USD 236.58 Billion in 2023 and will reach USD 723.41 Billion by 2032 and grow at a CAGR of 13.3% by 2032.
The Wireless Connectivity Market was valued at USD 91.9 billion in 2023 and is expected to reach USD 305.0 billion by 2032, growing at a CAGR of 14.28% from 2024-2032.
The Crowdfunding Market Size was valued at USD 1.5 Billion in 2023 and is expected to reach USD 5.4 Billion by 2032, growing at a CAGR of 15.4% by 2032.
The Prescriptive & Predictive Analytics Market was valued at USD 20.80 billion in 2023 and is expected to reach USD 156.14 billion by 2032, growing at a CAGR of 25.13% over the forecast period 2024-2032.
The Metrology Software Market size was valued at USD 998.65 million in 2023 and is expected to reach USD 1917.53 million by 2032 and grow at a CAGR of 7.52% over the forecast period of 2024-2032.

Hi! Click one of our member below to chat on Phone
© 2025 All Rights Reserved by SNS Insider Pvt Ltd


