To get more information on Industrial Microscope Market - Request Free Sample Report
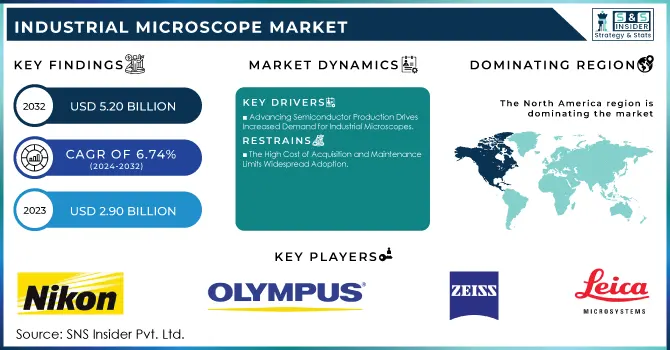
The Industrial Microscope Market Size was valued at USD 2.90 billion in 2023 and is expected to reach USD 5.20 billion by 2032 and grow at a CAGR of 6.74% over the forecast period 2024-2032.
Industrial Microscope Market has witnessed significant growth and development in technologies in Japan, China, USA, France, Germany, and India in 2023 and 2024. The countries have been in demand by investing in massive amounts of research, manufacturing, and government-initiated projects. For example, in the last two years, both Japan and Germany have also doubled funding into nanotechnology and materials science research, meaning advanced microscopy tools must be utilized to accurately analyze samples. Meanwhile, the USA's CHIPS Act, meant to boost semiconductor manufacturing, is triggering its use in even making electronic parts and in assessing quality.
The "Made in China 2025" strategy of China and the "Make in India" campaign by India have focused on local manufacturing, thus increasing the demand for microscopy solutions in healthcare, electronics, and other industries. France's thrust on sustainability in industrial processes and materials has also contributed to increased adoption of advanced microscopes. Governments are now encouraging manufacturers to introduce AI, machine learning, and IoT into microscopy technologies to increase efficiency and accuracy.
Recent technological innovations have further fueled market dynamics. For instance, China's development of a new core electron microscope for the semiconductor industry, reported in January 2024, underlines its commitment to leading the hi-tech imaging race. Similarly, Leica Microsystems introduced the MATEO FL AI-powered digital fluorescence microscope in August 2024, enhancing imaging capabilities with AI technology to meet advanced medical and industrial needs. In November 2024, ASH Technologies unveiled a 4K digital microscope with advanced imaging and measurement software that streamlines processes and improves measurement precision.
Electron microscopes have now added the advantage of AI-driven defect detection and atomic-level imaging. In 2023, high-resolution digital optical microscopes were launched and in turn opened new applications for segments like biotechnology, materials science, and semiconductor manufacturing. These advances go hand-in-hand with user-friendly interfaces and automation features reducing the operational complexities.
Key Drivers:
Advances in semiconductor production have increased industrial microscope usage by 45% in 2023. The electronics and semiconductor industry heavily relies on industrial microscopes for defect analysis, failure testing, and quality assurance. Governments globally, including the USA’s $280 billion CHIPS Act, are driving local semiconductor manufacturing to reduce supply chain dependencies.
In Asia, China and Japan are leading investments in high-resolution microscopy technologies for cutting-edge electronics. With the miniaturization of components, demand for advanced imaging capabilities has grown by 45% year-over-year in 2023, per government and industry reports. This trend aligns with the rising use of 5G devices, IoT technology, and autonomous systems, all requiring precise component inspection. Industrial microscopes equipped with AI analytics further streamline defect detection, enhancing production efficiency.
Biomedical research applications increased microscopy usage by 38% from 2023 to 2024. Industrial microscopes are indispensable in medical research and diagnostics for cellular analysis, tissue imaging, and drug development. In 2023, Japan and Germany allocated 25% more funding to bioscience research compared to 2022, emphasizing microscopy for cancer and genetic studies. India’s National Health Mission has encouraged the integration of high-resolution microscopes in hospitals and laboratories.
Similarly, the USA’s National Institutes of Health (NIH) recorded a 20% rise in projects using advanced microscopy tools in 2023. These microscopes, featuring real-time imaging and automation, enhance disease detection and streamline pharmaceutical testing. As personalized medicine and genomic research expand, the biomedical field will remain a crucial driver for the industrial microscope market.
Restrain:
Industrial microscopes, particularly electron and scanning probe microscopes, require significant financial investment, often exceeding $500,000 for high-end models. Moreover, their upkeep demands specialized technicians and costly replacement parts, further straining budgets for small- and medium-sized enterprises (SMEs). In countries like India and France, limited government subsidies for microscopy-related research hinder procurement, restricting market penetration in emerging sectors.
Additionally, the steep learning curve associated with advanced functionalities poses operational challenges, deterring potential buyers. While large corporations and research institutions in nations like the USA and Germany can accommodate these expenses, smaller organizations face barriers to entry. Addressing these concerns requires manufacturers to offer cost-effective, scalable solutions tailored to diverse user needs.
By Product Type
The Optical Microscopes segment dominated in 2023 with 42% market share, driven by their affordability and versatile applications in quality control and education. Innovations in digital optical microscopes with AI-powered image processing have enhanced their utility in materials science and life sciences.
The Electron Microscopes segment is projected to grow with the fastest CAGR of 7.40% during 2024-2032, owing to their unparalleled resolution and ability to analyze nanostructures. Scanning probe microscopes are gaining traction in research-intensive applications, including nanotechnology and molecular biology, due to their precision in surface characterization.
Other emerging categories, such as hybrid microscopes, are also contributing to the market by combining multiple imaging techniques, providing comprehensive solutions for complex analyses.
By Type
The Compound Microscope segment dominated in 2023 with 64% of the market share, reflecting its widespread use in academia, laboratories, and industrial inspection. Compound microscopes’ adaptability for both biological and material studies makes them indispensable across industries. The stereo microscopes segment is projected to grow with the fastest CAGR of 7.19% from 2024 to 2032, fueled by their application in 3D imaging, electronics assembly, and precision manufacturing.
Stereo Microscopes are increasingly integrated with digital interfaces for enhanced visualization and ease of data sharing. Other types, such as inverted and digital microscopes, are also gaining attention due to their ability to accommodate diverse samples and facilitate remote collaborations, particularly in post-pandemic research environments.
Industrial Microscope Market Regional Analysis
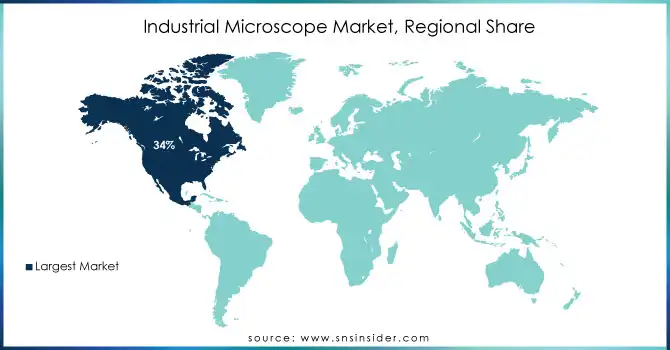
The industrial microscope market exhibits a strong regional footprint, with North America dominating in 2023 with 34% of the market share, largely due to technological advancements and robust investments in R&D. The USA, in particular, leads with widespread adoption in biotechnology and semiconductor industries.
Asia Pacific is projected to grow the fastest with a CAGR of 8.73% during 2024-2032, driven by rising industrialization in China and India. Government initiatives like “Made in China 2025” and India’s PLI Scheme support local manufacturing and innovation, bolstering demand for advanced microscopy solutions. Europe, with strongholds like Germany and France, continues to leverage industrial microscopes for research and precision engineering, maintaining its competitive edge.
Get Customized Report as per Your Business Requirement - Enquiry Now
Some of the major players in the Industrial Microscope Market are
Nikon Corporation (Optical Microscopes, Digital Microscopes)
Olympus Corporation (Stereo Microscopes, Electron Microscopes)
Carl Zeiss AG (Scanning Electron Microscopes, Confocal Microscopes)
Leica Microsystems (Digital Microscopes, Optical Microscopes)
Hitachi High-Tech Corporation (Electron Microscopes, Scanning Probe Microscopes)
JEOL Ltd. (Transmission Electron Microscopes, Scanning Electron Microscopes)
Bruker Corporation (Scanning Probe Microscopes, Atomic Force Microscopes)
Thermo Fisher Scientific (Electron Microscopes, Cryo-Electron Microscopes)
Keyence Corporation (Digital Microscopes, Stereo Microscopes)
Meiji Techno Co., Ltd. (Compound Microscopes, Stereo Microscopes)
Motic Microscopes (Digital Microscopes, Laboratory Microscopes)
CAMECA Instruments (Electron Probe Microanalyzers, SIMS Microscopes)
TESCAN ORSAY HOLDING (Focused Ion Beam Microscopes, Scanning Electron Microscopes)
Rigaku Corporation (X-ray Microscopes, Scanning Electron Microscopes)
Ametek, Inc. (Surface Profiling Microscopes, Optical Microscopes)
Bausch + Lomb (Optical Microscopes, Lab Microscopes)
Veeco Instruments Inc. (Scanning Probe Microscopes, Atomic Force Microscopes)
Nanolive SA (3D Cell Explorers, Digital Microscopes)
Delong Instruments (Transmission Electron Microscopes, Low Voltage Electron Microscopes)
Horiba Ltd. (Raman Microscopes, Optical Microscopes)
MAJOR SUPPLIERS (Components, Technologies)
Schott AG (Optical Glass, Illumination Systems)
Edmund Optics (Lenses, Optical Components)
Hoya Corporation (Optical Filters, Optical Glass)
Asahi Glass Co., Ltd. (Specialized Glass, Optical Coatings)
Precision Micro-Optics (Optical Lenses, Prisms)
Newport Corporation (Optical Systems, Precision Components)
Lambda Research Optics (Infrared Optics, Mirrors)
Gooch & Housego (Acousto-Optic Devices, Optical Components)
OptoSigma Corporation (High-Precision Lenses, Optical Filters)
Ohara Corporation (Specialty Glass, Optical Materials)
Intel Corporation
Samsung Electronics
TSMC (Taiwan Semiconductor Manufacturing Company)
Roche Diagnostics
Thermo Fisher Scientific (as a buyer for complementary products)
Johnson & Johnson
BASF SE
Pfizer Inc.
Harvard University (Research Laboratories)
Massachusetts Institute of Technology (MIT)
November 2024: To provide researchers with leading-edge microscopy technologies, the Indian Institute of Technology, Hyderabad and Nikon India on Monday have launched India's first-ever such centre of excellence at its campus. The centre will serve as a hub for innovation, that will enable researchers to explore various scales, from single cells right up to human tissues to understand biological systems.
May 2023: Olympus Corporation ("Olympus") has announced that it has finalized the separation of its Scientific Solutions business as a wholly-owned subsidiary called Evident Corporation ("Evident"). With this divestiture of the Imaging business completed, this further indicates the long-term strategy for the company in becoming a leading player in the medtech industry.
Report Attributes | Details |
---|---|
Market Size in 2023 | US$ 2.90 Billion |
Market Size by 2032 | US$ 5.20 Billion |
CAGR | CAGR of 6.74% From 2024 to 2032 |
Base Year | 2023 |
Forecast Period | 2024-2032 |
Historical Data | 2020-2022 |
Report Scope & Coverage | Market Size, Segments Analysis, Competitive Landscape, Regional Analysis, DROC & SWOT Analysis, Forecast Outlook |
Key Segments | • By Product Type (Optical Microscopes, Electron Microscopes, Scanning Probe Microscopes, Others), • By End Use (Semiconductor & Microelectronics, Healthcare, General Manufacturing, Food Processing, Construction, Others) • By Application (Material Science, Semiconductor, Life Sciences, Nanotechnology, Others) • By Type (Compound, Stereo, Other) |
Regional Analysis/Coverage | North America (US, Canada, Mexico), Europe (Eastern Europe [Poland, Romania, Hungary, Turkey, Rest of Eastern Europe] Western Europe [Germany, France, UK, Italy, Spain, Netherlands, Switzerland, Austria, Rest of Western Europe]), Asia Pacific (China, India, Japan, South Korea, Vietnam, Singapore, Australia, Rest of Asia Pacific), Middle East & Africa (Middle East [UAE, Egypt, Saudi Arabia, Qatar, Rest of Middle East], Africa [Nigeria, South Africa, Rest of Africa], Latin America (Brazil, Argentina, Colombia, Rest of Latin America) |
Company Profiles | Nikon Corporation, Olympus Corporation, Carl Zeiss AG, Leica Microsystems, Hitachi High-Tech Corporation, JEOL Ltd., Bruker Corporation, Thermo Fisher Scientific, Keyence Corporation, Meiji Techno Co., Ltd., Motic Microscopes, CAMECA Instruments, TESCAN ORSAY HOLDING, Rigaku Corporation, Ametek, Inc., Bausch + Lomb, Veeco Instruments Inc., Nanolive SA, Delong Instruments, Horiba Ltd.. |
Key Drivers | • Advancing Semiconductor Production Drives Increased Demand for Industrial Microscopes • Biomedical Research Drives Growing Demand for Advanced Industrial Microscopes |
Restraints | • The High Cost of Acquisition and Maintenance Limits Widespread Adoption. |
Ans: The Industrial Microscope Market is expected to grow at a CAGR of 6.74% during 2024-2032.
Ans: Industrial Microscope Market size was USD 2.90 Billion in 2023 and is expected to Reach USD 5.20 Billion by 2032.
Ans: The Optical Microscopes segment dominated the Industrial Microscope Market.
North America is dominating the market
Increase in Demand Because of Electron Microscope Advancement and The Use of Electron Microscopy in Healthcare and Life Sciences
1. Introduction
1.1 Market Definition
1.2 Scope (Inclusion and Exclusions)
1.3 Research Assumptions
2. Executive Summary
2.1 Market Overview
2.2 Regional Synopsis
2.3 Competitive Summary
3. Research Methodology
3.1 Top-Down Approach
3.2 Bottom-up Approach
3.3. Data Validation
3.4 Primary Interviews
4. Market Dynamics Impact Analysis
4.1 Market Driving Factors Analysis
4.1.1 Drivers
4.1.2 Restraints
4.1.3 Opportunities
4.1.4 Challenges
4.2 PESTLE Analysis
4.3 Porter’s Five Forces Model
5. Statistical Insights and Trends Reporting
5.1 Pricing and Cost Insights
5.2 Demand and Adoption Trends
5.3 Utilization Statistics
6. Competitive Landscape
6.1 List of Major Companies, By Region
6.2 Market Share Analysis, By Region
6.3 Product Benchmarking
6.3.1 Product specifications and features
6.3.2 Pricing
6.4 Strategic Initiatives
6.4.1 Marketing and promotional activities
6.4.2 Distribution and supply chain strategies
6.4.3 Expansion plans and new product launches
6.4.4 Strategic partnerships and collaborations
6.5 Technological Advancements
6.6 Market Positioning and Branding
7. Industrial Microscope Market Segmentation, By Product Type
7.1 Chapter Overview
7.2 Optical Microscopes
7.2.1 Optical Microscopes Market Trends Analysis (2020-2032)
7.2.2 Optical Microscopes Market Size Estimates and Forecasts to 2032 (USD Billion)
7.3 Electron Microscopes
7.3.1 Electron Microscopes Market Trends Analysis (2020-2032)
7.3.2 Electron Microscopes Market Size Estimates and Forecasts to 2032 (USD Billion)
7.4 Scanning Probe Microscopes
7.4.1 Scanning Probe Microscopes Market Trends Analysis (2020-2032)
7.4.2 Scanning Probe Microscopes Market Size Estimates and Forecasts to 2032 (USD Billion)
7.5 Others
7.5.1 Others Market Trends Analysis (2020-2032)
7.5.2 Others Market Size Estimates and Forecasts to 2032 (USD Billion)
8. Industrial Microscope Market Segmentation, By End Use
8.1 Chapter Overview
8.2 Semiconductor & Microelectronics
8.2.1 Semiconductor & Microelectronics Market Trends Analysis (2020-2032)
8.2.2 Semiconductor & Microelectronics Market Size Estimates and Forecasts to 2032 (USD Billion)
8.3 Healthcare
8.3.1 Healthcare Market Trends Analysis (2020-2032)
8.3.2 Healthcare Market Size Estimates and Forecasts to 2032 (USD Billion)
8.4 General Manufacturing
8.4.1 General Manufacturing Market Trends Analysis (2020-2032)
8.4.2 General Manufacturing Market Size Estimates and Forecasts to 2032 (USD Billion)
8.5 Food Processing
8.5.1 Food Processing Market Trends Analysis (2020-2032)
8.5.2 Food Processing Market Size Estimates and Forecasts to 2032 (USD Billion)
8.6 Construction
8.6.1 Construction Market Trends Analysis (2020-2032)
8.6.2 Construction Market Size Estimates and Forecasts to 2032 (USD Billion)
8.7 Others
8.7.1 Others Market Trends Analysis (2020-2032)
8.7.2 Others Market Size Estimates and Forecasts to 2032 (USD Billion)
9. Industrial Microscope Market Segmentation, By Application
9.1 Chapter Overview
9.2 Material Science
9.2.1 Material Science Market Trends Analysis (2020-2032)
9.2.2 Material Science Market Size Estimates and Forecasts to 2032 (USD Billion)
9.3 Semiconductor
9.3.1 Semiconductor Market Trends Analysis (2020-2032)
9.3.2 Semiconductor Market Size Estimates and Forecasts to 2032 (USD Billion)
9.4 Life Sciences
9.4.1 Life Sciences Market Trends Analysis (2020-2032)
9.4.2 Life Sciences Market Size Estimates and Forecasts to 2032 (USD Billion)
9.4 Life Sciences
9.4.1 Life Sciences Market Trends Analysis (2020-2032)
9.4.2 Life Sciences Market Size Estimates and Forecasts to 2032 (USD Billion)
9.5 Nanotechnology
9.5.1 Nanotechnology Market Trends Analysis (2020-2032)
9.5.2 Nanotechnology Market Size Estimates and Forecasts to 2032 (USD Billion)
9.6 Others
9.6.1 Others Market Trends Analysis (2020-2032)
9.6.2 Others Market Size Estimates and Forecasts to 2032 (USD Billion)
10. Industrial Microscope Market Segmentation, By Type
10.1 Chapter Overview
10.2 Compound
10.2.1 Compound Market Trends Analysis (2020-2032)
10.2.2 Compound Market Size Estimates and Forecasts to 2032 (USD Billion)
10.3 Stereo
10.3.1 Stereo Market Trends Analysis (2020-2032)
10.3.2 Stereo Market Size Estimates and Forecasts to 2032 (USD Billion)
10.4 Other
10.4.1 Other Market Trends Analysis (2020-2032)
10.4.2 Other Market Size Estimates and Forecasts to 2032 (USD Billion)
11. Regional Analysis
11.1 Chapter Overview
11.2 North America
11.2.1 Trends Analysis
11.2.2 North America Industrial Microscope Market Estimates and Forecasts, by Country (2020-2032) (USD Billion)
11.2.3 North America Industrial Microscope Market Estimates and Forecasts, By Product Type (2020-2032) (USD Billion)
11.2.4 North America Industrial Microscope Market Estimates and Forecasts, By End Use(2020-2032) (USD Billion)
11.2.5 North America Industrial Microscope Market Estimates and Forecasts, By Application (2020-2032) (USD Billion)
11.2.6 North America Industrial Microscope Market Estimates and Forecasts, By Type(2020-2032) (USD Billion)
11.2.7 USA
11.2.7.1 USA Industrial Microscope Market Estimates and Forecasts, By Product Type (2020-2032) (USD Billion)
11.2.7.2 USA Industrial Microscope Market Estimates and Forecasts, By End Use(2020-2032) (USD Billion)
11.2.7.3 USA Industrial Microscope Market Estimates and Forecasts, By Application (2020-2032) (USD Billion)
11.2.7.4 USA Industrial Microscope Market Estimates and Forecasts, By Type(2020-2032) (USD Billion)
11.2.8 Canada
11.2.8.1 Canada Industrial Microscope Market Estimates and Forecasts, By Product Type (2020-2032) (USD Billion)
11.2.8.2 Canada Industrial Microscope Market Estimates and Forecasts, By End Use(2020-2032) (USD Billion)
11.2.8.3 Canada Industrial Microscope Market Estimates and Forecasts, By Application (2020-2032) (USD Billion)
11.2.8.4 Canada Industrial Microscope Market Estimates and Forecasts, By Type(2020-2032) (USD Billion)
11.2.9 Mexico
11.2.9.1 Mexico Industrial Microscope Market Estimates and Forecasts, By Product Type (2020-2032) (USD Billion)
11.2.9.2 Mexico Industrial Microscope Market Estimates and Forecasts, By End Use(2020-2032) (USD Billion)
11.2.9.3 Mexico Industrial Microscope Market Estimates and Forecasts, By Application (2020-2032) (USD Billion)
11.2.9.4 Mexico Industrial Microscope Market Estimates and Forecasts, By Type(2020-2032) (USD Billion)
11.3 Europe
11.3.1 Eastern Europe
11.3.1.1 Trends Analysis
11.3.1.2 Eastern Europe Industrial Microscope Market Estimates and Forecasts, by Country (2020-2032) (USD Billion)
11.3.1.3 Eastern Europe Industrial Microscope Market Estimates and Forecasts, By Product Type (2020-2032) (USD Billion)
11.3.1.4 Eastern Europe Industrial Microscope Market Estimates and Forecasts, By End Use(2020-2032) (USD Billion)
11.3.1.5 Eastern Europe Industrial Microscope Market Estimates and Forecasts, By Application (2020-2032) (USD Billion)
11.3.1.6 Eastern Europe Industrial Microscope Market Estimates and Forecasts, By Type(2020-2032) (USD Billion)
11.3.1.7 Poland
11.3.1.7.1 Poland Industrial Microscope Market Estimates and Forecasts, By Product Type (2020-2032) (USD Billion)
11.3.1.7.2 Poland Industrial Microscope Market Estimates and Forecasts, By End Use(2020-2032) (USD Billion)
11.3.1.7.3 Poland Industrial Microscope Market Estimates and Forecasts, By Application (2020-2032) (USD Billion)
11.3.1.7.4 Poland Industrial Microscope Market Estimates and Forecasts, By Type(2020-2032) (USD Billion)
11.3.1.8 Romania
11.3.1.8.1 Romania Industrial Microscope Market Estimates and Forecasts, By Product Type (2020-2032) (USD Billion)
11.3.1.8.2 Romania Industrial Microscope Market Estimates and Forecasts, By End Use(2020-2032) (USD Billion)
11.3.1.8.3 Romania Industrial Microscope Market Estimates and Forecasts, By Application (2020-2032) (USD Billion)
11.3.1.8.4 Romania Industrial Microscope Market Estimates and Forecasts, By Type(2020-2032) (USD Billion)
11.3.1.9 Hungary
11.3.1.9.1 Hungary Industrial Microscope Market Estimates and Forecasts, By Product Type (2020-2032) (USD Billion)
11.3.1.9.2 Hungary Industrial Microscope Market Estimates and Forecasts, By End Use(2020-2032) (USD Billion)
11.3.1.9.3 Hungary Industrial Microscope Market Estimates and Forecasts, By Application (2020-2032) (USD Billion)
11.3.1.9.4 Hungary Industrial Microscope Market Estimates and Forecasts, By Type(2020-2032) (USD Billion)
11.3.1.10 Turkey
11.3.1.10.1 Turkey Industrial Microscope Market Estimates and Forecasts, By Product Type (2020-2032) (USD Billion)
11.3.1.10.2 Turkey Industrial Microscope Market Estimates and Forecasts, By End Use(2020-2032) (USD Billion)
11.3.1.10.3 Turkey Industrial Microscope Market Estimates and Forecasts, By Application (2020-2032) (USD Billion)
11.3.1.10.4 Turkey Industrial Microscope Market Estimates and Forecasts, By Type(2020-2032) (USD Billion)
11.3.1.11 Rest of Eastern Europe
11.3.1.11.1 Rest of Eastern Europe Industrial Microscope Market Estimates and Forecasts, By Product Type (2020-2032) (USD Billion)
11.3.1.11.2 Rest of Eastern Europe Industrial Microscope Market Estimates and Forecasts, By End Use(2020-2032) (USD Billion)
11.3.1.11.3 Rest of Eastern Europe Industrial Microscope Market Estimates and Forecasts, By Application (2020-2032) (USD Billion)
11.3.1.11.4 Rest of Eastern Europe Industrial Microscope Market Estimates and Forecasts, By Type(2020-2032) (USD Billion)
11.3.2 Western Europe
11.3.2.1 Trends Analysis
11.3.2.2 Western Europe Industrial Microscope Market Estimates and Forecasts, by Country (2020-2032) (USD Billion)
11.3.2.3 Western Europe Industrial Microscope Market Estimates and Forecasts, By Product Type (2020-2032) (USD Billion)
11.3.2.4 Western Europe Industrial Microscope Market Estimates and Forecasts, By End Use(2020-2032) (USD Billion)
11.3.2.5 Western Europe Industrial Microscope Market Estimates and Forecasts, By Application (2020-2032) (USD Billion)
11.3.2.6 Western Europe Industrial Microscope Market Estimates and Forecasts, By Type(2020-2032) (USD Billion)
11.3.2.7 Germany
11.3.2.7.1 Germany Industrial Microscope Market Estimates and Forecasts, By Product Type (2020-2032) (USD Billion)
11.3.2.7.2 Germany Industrial Microscope Market Estimates and Forecasts, By End Use(2020-2032) (USD Billion)
11.3.2.7.3 Germany Industrial Microscope Market Estimates and Forecasts, By Application (2020-2032) (USD Billion)
11.3.2.7.4 Germany Industrial Microscope Market Estimates and Forecasts, By Type(2020-2032) (USD Billion)
11.3.2.8 France
11.3.2.8.1 France Industrial Microscope Market Estimates and Forecasts, By Product Type (2020-2032) (USD Billion)
11.3.2.8.2 France Industrial Microscope Market Estimates and Forecasts, By End Use(2020-2032) (USD Billion)
11.3.2.8.3 France Industrial Microscope Market Estimates and Forecasts, By Application (2020-2032) (USD Billion)
11.3.2.8.4 France Industrial Microscope Market Estimates and Forecasts, By Type(2020-2032) (USD Billion)
11.3.2.9 UK
11.3.2.9.1 UK Industrial Microscope Market Estimates and Forecasts, By Product Type (2020-2032) (USD Billion)
11.3.2.9.2 UK Industrial Microscope Market Estimates and Forecasts, By End Use(2020-2032) (USD Billion)
11.3.2.9.3 UK Industrial Microscope Market Estimates and Forecasts, By Application (2020-2032) (USD Billion)
11.3.2.9.4 UK Industrial Microscope Market Estimates and Forecasts, By Type(2020-2032) (USD Billion)
11.3.2.10 Italy
11.3.2.10.1 Italy Industrial Microscope Market Estimates and Forecasts, By Product Type (2020-2032) (USD Billion)
11.3.2.10.2 Italy Industrial Microscope Market Estimates and Forecasts, By End Use(2020-2032) (USD Billion)
11.3.2.10.3 Italy Industrial Microscope Market Estimates and Forecasts, By Application (2020-2032) (USD Billion)
11.3.2.10.4 Italy Industrial Microscope Market Estimates and Forecasts, By Type(2020-2032) (USD Billion)
11.3.2.11 Spain
11.3.2.11.1 Spain Industrial Microscope Market Estimates and Forecasts, By Product Type (2020-2032) (USD Billion)
11.3.2.11.2 Spain Industrial Microscope Market Estimates and Forecasts, By End Use(2020-2032) (USD Billion)
11.3.2.11.3 Spain Industrial Microscope Market Estimates and Forecasts, By Application (2020-2032) (USD Billion)
11.3.2.11.4 Spain Industrial Microscope Market Estimates and Forecasts, By Type(2020-2032) (USD Billion)
11.3.2.12 Netherlands
11.3.2.12.1 Netherlands Industrial Microscope Market Estimates and Forecasts, By Product Type (2020-2032) (USD Billion)
11.3.2.12.2 Netherlands Industrial Microscope Market Estimates and Forecasts, By End Use(2020-2032) (USD Billion)
11.3.2.12.3 Netherlands Industrial Microscope Market Estimates and Forecasts, By Application (2020-2032) (USD Billion)
11.3.2.12.4 Netherlands Industrial Microscope Market Estimates and Forecasts, By Type(2020-2032) (USD Billion)
11.3.2.13 Switzerland
11.3.2.13.1 Switzerland Industrial Microscope Market Estimates and Forecasts, By Product Type (2020-2032) (USD Billion)
11.3.2.13.2 Switzerland Industrial Microscope Market Estimates and Forecasts, By End Use(2020-2032) (USD Billion)
11.3.2.13.3 Switzerland Industrial Microscope Market Estimates and Forecasts, By Application (2020-2032) (USD Billion)
11.3.2.13.4 Switzerland Industrial Microscope Market Estimates and Forecasts, By Type(2020-2032) (USD Billion)
11.3.2.14 Austria
11.3.2.14.1 Austria Industrial Microscope Market Estimates and Forecasts, By Product Type (2020-2032) (USD Billion)
11.3.2.14.2 Austria Industrial Microscope Market Estimates and Forecasts, By End Use(2020-2032) (USD Billion)
11.3.2.14.3 Austria Industrial Microscope Market Estimates and Forecasts, By Application (2020-2032) (USD Billion)
11.3.2.14.4 Austria Industrial Microscope Market Estimates and Forecasts, By Type(2020-2032) (USD Billion)
11.3.2.15 Rest of Western Europe
11.3.2.15.1 Rest of Western Europe Industrial Microscope Market Estimates and Forecasts, By Product Type (2020-2032) (USD Billion)
11.3.2.15.2 Rest of Western Europe Industrial Microscope Market Estimates and Forecasts, By End Use(2020-2032) (USD Billion)
11.3.2.15.3 Rest of Western Europe Industrial Microscope Market Estimates and Forecasts, By Application (2020-2032) (USD Billion)
11.3.2.15.4 Rest of Western Europe Industrial Microscope Market Estimates and Forecasts, By Type(2020-2032) (USD Billion)
11.4 Asia Pacific
11.4.1 Trends Analysis
11.4.2 Asia Pacific Industrial Microscope Market Estimates and Forecasts, by Country (2020-2032) (USD Billion)
11.4.3 Asia Pacific Industrial Microscope Market Estimates and Forecasts, By Product Type (2020-2032) (USD Billion)
11.4.4 Asia Pacific Industrial Microscope Market Estimates and Forecasts, By End Use(2020-2032) (USD Billion)
11.4.5 Asia Pacific Industrial Microscope Market Estimates and Forecasts, By Application (2020-2032) (USD Billion)
11.4.6 Asia Pacific Industrial Microscope Market Estimates and Forecasts, By Type(2020-2032) (USD Billion)
11.4.7 China
11.4.7.1 China Industrial Microscope Market Estimates and Forecasts, By Product Type (2020-2032) (USD Billion)
11.4.7.2 China Industrial Microscope Market Estimates and Forecasts, By End Use(2020-2032) (USD Billion)
11.4.7.3 China Industrial Microscope Market Estimates and Forecasts, By Application (2020-2032) (USD Billion)
11.4.7.4 China Industrial Microscope Market Estimates and Forecasts, By Type(2020-2032) (USD Billion)
11.4.8 India
11.4.8.1 India Industrial Microscope Market Estimates and Forecasts, By Product Type (2020-2032) (USD Billion)
11.4.8.2 India Industrial Microscope Market Estimates and Forecasts, By End Use(2020-2032) (USD Billion)
11.4.8.3 India Industrial Microscope Market Estimates and Forecasts, By Application (2020-2032) (USD Billion)
11.4.8.4 India Industrial Microscope Market Estimates and Forecasts, By Type(2020-2032) (USD Billion)
11.4.9 Japan
11.4.9.1 Japan Industrial Microscope Market Estimates and Forecasts, By Product Type (2020-2032) (USD Billion)
11.4.9.2 Japan Industrial Microscope Market Estimates and Forecasts, By End Use(2020-2032) (USD Billion)
11.4.9.3 Japan Industrial Microscope Market Estimates and Forecasts, By Application (2020-2032) (USD Billion)
11.4.9.4 Japan Industrial Microscope Market Estimates and Forecasts, By Type(2020-2032) (USD Billion)
11.4.10 South Korea
11.4.10.1 South Korea Industrial Microscope Market Estimates and Forecasts, By Product Type (2020-2032) (USD Billion)
11.4.10.2 South Korea Industrial Microscope Market Estimates and Forecasts, By End Use(2020-2032) (USD Billion)
11.4.10.3 South Korea Industrial Microscope Market Estimates and Forecasts, By Application (2020-2032) (USD Billion)
11.4.10.4 South Korea Industrial Microscope Market Estimates and Forecasts, By Type(2020-2032) (USD Billion)
11.4.11 Vietnam
11.4.11.1 Vietnam Industrial Microscope Market Estimates and Forecasts, By Product Type (2020-2032) (USD Billion)
11.4.11.2 Vietnam Industrial Microscope Market Estimates and Forecasts, By End Use(2020-2032) (USD Billion)
11.4.11.3 Vietnam Industrial Microscope Market Estimates and Forecasts, By Application (2020-2032) (USD Billion)
11.4.11.4 Vietnam Industrial Microscope Market Estimates and Forecasts, By Type(2020-2032) (USD Billion)
11.4.12 Singapore
11.4.12.1 Singapore Industrial Microscope Market Estimates and Forecasts, By Product Type (2020-2032) (USD Billion)
11.4.12.2 Singapore Industrial Microscope Market Estimates and Forecasts, By End Use(2020-2032) (USD Billion)
11.4.12.3 Singapore Industrial Microscope Market Estimates and Forecasts, By Application (2020-2032) (USD Billion)
11.4.12.4 Singapore Industrial Microscope Market Estimates and Forecasts, By Type(2020-2032) (USD Billion)
11.4.13 Australia
11.4.13.1 Australia Industrial Microscope Market Estimates and Forecasts, By Product Type (2020-2032) (USD Billion)
11.4.13.2 Australia Industrial Microscope Market Estimates and Forecasts, By End Use(2020-2032) (USD Billion)
11.4.13.3 Australia Industrial Microscope Market Estimates and Forecasts, By Application (2020-2032) (USD Billion)
11.4.13.4 Australia Industrial Microscope Market Estimates and Forecasts, By Type(2020-2032) (USD Billion)
11.4.14 Rest of Asia Pacific
11.4.14.1 Rest of Asia Pacific Industrial Microscope Market Estimates and Forecasts, By Product Type (2020-2032) (USD Billion)
11.4.14.2 Rest of Asia Pacific Industrial Microscope Market Estimates and Forecasts, By End Use(2020-2032) (USD Billion)
11.4.14.3 Rest of Asia Pacific Industrial Microscope Market Estimates and Forecasts, By Application (2020-2032) (USD Billion)
11.4.14.4 Rest of Asia Pacific Industrial Microscope Market Estimates and Forecasts, By Type(2020-2032) (USD Billion)
11.5 Middle East and Africa
11.5.1 Middle East
11.5.1.1 Trends Analysis
11.5.1.2 Middle East Industrial Microscope Market Estimates and Forecasts, by Country (2020-2032) (USD Billion)
11.5.1.3 Middle East Industrial Microscope Market Estimates and Forecasts, By Product Type (2020-2032) (USD Billion)
11.5.1.4 Middle East Industrial Microscope Market Estimates and Forecasts, By End Use(2020-2032) (USD Billion)
11.5.1.5 Middle East Industrial Microscope Market Estimates and Forecasts, By Application (2020-2032) (USD Billion)
11.5.1.6 Middle East Industrial Microscope Market Estimates and Forecasts, By Type(2020-2032) (USD Billion)
11.5.1.7 UAE
11.5.1.7.1 UAE Industrial Microscope Market Estimates and Forecasts, By Product Type (2020-2032) (USD Billion)
11.5.1.7.2 UAE Industrial Microscope Market Estimates and Forecasts, By End Use(2020-2032) (USD Billion)
11.5.1.7.3 UAE Industrial Microscope Market Estimates and Forecasts, By Application (2020-2032) (USD Billion)
11.5.1.7.4 UAE Industrial Microscope Market Estimates and Forecasts, By Type (2020-2032) (USD Billion)
11.5.1.8 Egypt
11.5.1.8.1 Egypt Industrial Microscope Market Estimates and Forecasts, By Product Type (2020-2032) (USD Billion)
11.5.1.8.2 Egypt Industrial Microscope Market Estimates and Forecasts, By End Use(2020-2032) (USD Billion)
11.5.1.8.3 Egypt Industrial Microscope Market Estimates and Forecasts, By Application (2020-2032) (USD Billion)
11.5.1.8.4 Egypt Industrial Microscope Market Estimates and Forecasts, By Type(2020-2032) (USD Billion)
11.5.1.9 Saudi Arabia
11.5.1.9.1 Saudi Arabia Industrial Microscope Market Estimates and Forecasts, By Product Type (2020-2032) (USD Billion)
11.5.1.9.2 Saudi Arabia Industrial Microscope Market Estimates and Forecasts, By End Use(2020-2032) (USD Billion)
11.5.1.9.3 Saudi Arabia Industrial Microscope Market Estimates and Forecasts, By Application (2020-2032) (USD Billion)
11.5.1.9.4 Saudi Arabia Industrial Microscope Market Estimates and Forecasts, By Type(2020-2032) (USD Billion)
11.5.1.10 Qatar
11.5.1.10.1 Qatar Industrial Microscope Market Estimates and Forecasts, By Product Type (2020-2032) (USD Billion)
11.5.1.10.2 Qatar Industrial Microscope Market Estimates and Forecasts, By End Use(2020-2032) (USD Billion)
11.5.1.10.3 Qatar Industrial Microscope Market Estimates and Forecasts, By Application (2020-2032) (USD Billion)
11.5.1.10.4 Qatar Industrial Microscope Market Estimates and Forecasts, By Type(2020-2032) (USD Billion)
11.5.1.11 Rest of Middle East
11.5.1.11.1 Rest of Middle East Industrial Microscope Market Estimates and Forecasts, By Product Type (2020-2032) (USD Billion)
11.5.1.11.2 Rest of Middle East Industrial Microscope Market Estimates and Forecasts, By End Use(2020-2032) (USD Billion)
11.5.1.11.3 Rest of Middle East Industrial Microscope Market Estimates and Forecasts, By Application (2020-2032) (USD Billion)
11.5.1.11.4 Rest of Middle East Industrial Microscope Market Estimates and Forecasts, By Type(2020-2032) (USD Billion)
11.5.2 Africa
11.5.2.1 Trends Analysis
11.5.2.2 Africa Industrial Microscope Market Estimates and Forecasts, by Country (2020-2032) (USD Billion)
11.5.2.3 Africa Industrial Microscope Market Estimates and Forecasts, By Product Type (2020-2032) (USD Billion)
11.5.2.4 Africa Industrial Microscope Market Estimates and Forecasts, By End Use(2020-2032) (USD Billion)
11.5.2.5 Africa Industrial Microscope Market Estimates and Forecasts, By Application (2020-2032) (USD Billion)
11.5.2.6 Africa Industrial Microscope Market Estimates and Forecasts, By Type(2020-2032) (USD Billion)
11.5.2.7 South Africa
11.5.2.7.1 South Africa Industrial Microscope Market Estimates and Forecasts, By Product Type (2020-2032) (USD Billion)
11.5.2.7.2 South Africa Industrial Microscope Market Estimates and Forecasts, By End Use(2020-2032) (USD Billion)
11.5.2.7.3 South Africa Industrial Microscope Market Estimates and Forecasts, By Application (2020-2032) (USD Billion)
11.5.2.7.4 South Africa Industrial Microscope Market Estimates and Forecasts, By Type(2020-2032) (USD Billion)
11.5.2.8 Nigeria
11.5.2.8.1 Nigeria Industrial Microscope Market Estimates and Forecasts, By Product Type (2020-2032) (USD Billion)
11.5.2.8.2 Nigeria Industrial Microscope Market Estimates and Forecasts, By End Use(2020-2032) (USD Billion)
11.5.2.8.3 Nigeria Industrial Microscope Market Estimates and Forecasts, By Application (2020-2032) (USD Billion)
11.5.2.8.4 Nigeria Industrial Microscope Market Estimates and Forecasts, By Type(2020-2032) (USD Billion)
11.5.2.9 Rest of Africa
11.5.2.9.1 Rest of Africa Industrial Microscope Market Estimates and Forecasts, By Product Type (2020-2032) (USD Billion)
11.5.2.9.2 Rest of Africa Industrial Microscope Market Estimates and Forecasts, By End Use(2020-2032) (USD Billion)
11.5.2.9.3 Rest of Africa Industrial Microscope Market Estimates and Forecasts, By Application (2020-2032) (USD Billion)
11.5.2.9.4 Rest of Africa Industrial Microscope Market Estimates and Forecasts, By Type(2020-2032) (USD Billion)
11.6 Latin America
11.6.1 Trends Analysis
11.6.2 Latin America Industrial Microscope Market Estimates and Forecasts, by Country (2020-2032) (USD Billion)
11.6.3 Latin America Industrial Microscope Market Estimates and Forecasts, By Product Type (2020-2032) (USD Billion)
11.6.4 Latin America Industrial Microscope Market Estimates and Forecasts, By End Use(2020-2032) (USD Billion)
11.6.5 Latin America Industrial Microscope Market Estimates and Forecasts, By Application (2020-2032) (USD Billion)
11.6.6 Latin America Industrial Microscope Market Estimates and Forecasts, By Type(2020-2032) (USD Billion)
11.6.7 Brazil
11.6.7.1 Brazil Industrial Microscope Market Estimates and Forecasts, By Product Type (2020-2032) (USD Billion)
11.6.7.2 Brazil Industrial Microscope Market Estimates and Forecasts, By End Use(2020-2032) (USD Billion)
11.6.7.3 Brazil Industrial Microscope Market Estimates and Forecasts, By Application (2020-2032) (USD Billion)
11.6.7.4 Brazil Industrial Microscope Market Estimates and Forecasts, By Type(2020-2032) (USD Billion)
11.6.8 Argentina
11.6.8.1 Argentina Industrial Microscope Market Estimates and Forecasts, By Product Type (2020-2032) (USD Billion)
11.6.8.2 Argentina Industrial Microscope Market Estimates and Forecasts, By End Use(2020-2032) (USD Billion)
11.6.8.3 Argentina Industrial Microscope Market Estimates and Forecasts, By Application (2020-2032) (USD Billion)
11.6.8.4 Argentina Industrial Microscope Market Estimates and Forecasts, By Type(2020-2032) (USD Billion)
11.6.9 Colombia
11.6.9.1 Colombia Industrial Microscope Market Estimates and Forecasts, By Product Type (2020-2032) (USD Billion)
11.6.9.2 Colombia Industrial Microscope Market Estimates and Forecasts, By End Use(2020-2032) (USD Billion)
11.6.9.3 Colombia Industrial Microscope Market Estimates and Forecasts, By Application (2020-2032) (USD Billion)
11.6.9.4 Colombia Industrial Microscope Market Estimates and Forecasts, By Type(2020-2032) (USD Billion)
11.6.10 Rest of Latin America
11.6.10.1 Rest of Latin America Industrial Microscope Market Estimates and Forecasts, By Product Type (2020-2032) (USD Billion)
11.6.10.2 Rest of Latin America Industrial Microscope Market Estimates and Forecasts, By End Use(2020-2032) (USD Billion)
11.6.10.3 Rest of Latin America Industrial Microscope Market Estimates and Forecasts, By Application (2020-2032) (USD Billion)
11.6.10.4 Rest of Latin America Industrial Microscope Market Estimates and Forecasts, By Type(2020-2032) (USD Billion)
12. Company Profiles
12.1 Nikon Corporation
12.1.1 Company Overview
12.1.2 Financial
12.1.3 Products/ Services Offered
12.1.4 SWOT Analysis
12.2 Olympus Corporation
12.2.1 Company Overview
12.2.2 Financial
12.2.3 Products/ Services Offered
12.2.4 SWOT Analysis
12.3 Carl Zeiss AG
12.3.1 Company Overview
12.3.2 Financial
12.3.3 Products/ Services Offered
12.3.4 SWOT Analysis
12.4 Leica Microsystems
12.4.1 Company Overview
12.4.2 Financial
12.4.3 Products/ Services Offered
12.4.4 SWOT Analysis
12.5 Hitachi High-Tech Corporation
12.5.1 Company Overview
12.5.2 Financial
12.5.3 Products/ Services Offered
12.5.4 SWOT Analysis
12.6 JEOL Ltd
12.6.1 Company Overview
12.6.2 Financial
12.6.3 Products/ Services Offered
12.6.4 SWOT Analysis
12.7 Bruker Corporation
12.7.1 Company Overview
12.7.2 Financial
12.7.3 Products/ Services Offered
12.7.4 SWOT Analysis
12.8 Thermo Fisher Scientific
12.8.1 Company Overview
12.8.2 Financial
12.8.3 Products/ Services Offered
12.8.4 SWOT Analysis
12.9 Keyence Corporation
12.9.1 Company Overview
12.9.2 Financial
12.9.3 Products/ Services Offered
12.9.4 SWOT Analysis
12.10 Meiji Techno Co
12.10.1 Company Overview
12.10.2 Financial
12.10.3 Products/ Services Offered
12.10.4 SWOT Analysis
13. Use Cases and Best Practices
14. Conclusion
An accurate research report requires proper strategizing as well as implementation. There are multiple factors involved in the completion of good and accurate research report and selecting the best methodology to compete the research is the toughest part. Since the research reports we provide play a crucial role in any company’s decision-making process, therefore we at SNS Insider always believe that we should choose the best method which gives us results closer to reality. This allows us to reach at a stage wherein we can provide our clients best and accurate investment to output ratio.
Each report that we prepare takes a timeframe of 350-400 business hours for production. Starting from the selection of titles through a couple of in-depth brain storming session to the final QC process before uploading our titles on our website we dedicate around 350 working hours. The titles are selected based on their current market cap and the foreseen CAGR and growth.
The 5 steps process:
Step 1: Secondary Research:
Secondary Research or Desk Research is as the name suggests is a research process wherein, we collect data through the readily available information. In this process we use various paid and unpaid databases which our team has access to and gather data through the same. This includes examining of listed companies’ annual reports, Journals, SEC filling etc. Apart from this our team has access to various associations across the globe across different industries. Lastly, we have exchange relationships with various university as well as individual libraries.
Step 2: Primary Research
When we talk about primary research, it is a type of study in which the researchers collect relevant data samples directly, rather than relying on previously collected data. This type of research is focused on gaining content specific facts that can be sued to solve specific problems. Since the collected data is fresh and first hand therefore it makes the study more accurate and genuine.
We at SNS Insider have divided Primary Research into 2 parts.
Part 1 wherein we interview the KOLs of major players as well as the upcoming ones across various geographic regions. This allows us to have their view over the market scenario and acts as an important tool to come closer to the accurate market numbers. As many as 45 paid and unpaid primary interviews are taken from both the demand and supply side of the industry to make sure we land at an accurate judgement and analysis of the market.
This step involves the triangulation of data wherein our team analyses the interview transcripts, online survey responses and observation of on filed participants. The below mentioned chart should give a better understanding of the part 1 of the primary interview.
Part 2: In this part of primary research the data collected via secondary research and the part 1 of the primary research is validated with the interviews from individual consultants and subject matter experts.
Consultants are those set of people who have at least 12 years of experience and expertise within the industry whereas Subject Matter Experts are those with at least 15 years of experience behind their back within the same space. The data with the help of two main processes i.e., FGDs (Focused Group Discussions) and IDs (Individual Discussions). This gives us a 3rd party nonbiased primary view of the market scenario making it a more dependable one while collation of the data pointers.
Step 3: Data Bank Validation
Once all the information is collected via primary and secondary sources, we run that information for data validation. At our intelligence centre our research heads track a lot of information related to the market which includes the quarterly reports, the daily stock prices, and other relevant information. Our data bank server gets updated every fortnight and that is how the information which we collected using our primary and secondary information is revalidated in real time.
Step 4: QA/QC Process
After all the data collection and validation our team does a final level of quality check and quality assurance to get rid of any unwanted or undesired mistakes. This might include but not limited to getting rid of the any typos, duplication of numbers or missing of any important information. The people involved in this process include technical content writers, research heads and graphics people. Once this process is completed the title gets uploader on our platform for our clients to read it.
Step 5: Final QC/QA Process:
This is the last process and comes when the client has ordered the study. In this process a final QA/QC is done before the study is emailed to the client. Since we believe in giving our clients a good experience of our research studies, therefore, to make sure that we do not lack at our end in any way humanly possible we do a final round of quality check and then dispatch the study to the client.
Market Segmentation
By Product Type
Optical Microscopes
Electron Microscopes
Scanning Probe Microscopes
Others
By End Use
Semiconductor & Microelectronics
Healthcare
General Manufacturing
Food Processing
Construction
Others
By Application
Material Science
Semiconductor
Life Sciences
Nanotechnology
Others
By Type
Compound
Stereo
Other
Request for Segment Customization as per your Business Requirement: Segment Customization Request
Regional Coverage:
North America
US
Canada
Mexico
Europe
Eastern Europe
Poland
Romania
Hungary
Turkey
Rest of Eastern Europe
Western Europe
Germany
France
UK
Italy
Spain
Netherlands
Switzerland
Austria
Rest of Western Europe
Asia Pacific
China
India
Japan
South Korea
Vietnam
Singapore
Australia
Rest of Asia Pacific
Middle East & Africa
Middle East
UAE
Egypt
Saudi Arabia
Qatar
Rest of the Middle East
Africa
Nigeria
South Africa
Rest of Africa
Latin America
Brazil
Argentina
Colombia
Rest of Latin America
Request for Country Level Research Report: Country Level Customization Request
Available Customization
With the given market data, SNS Insider offers customization as per the company’s specific needs. The following customization options are available for the report:
Product Analysis
Criss-Cross segment analysis (e.g. Product X Application)
Product Matrix which gives a detailed comparison of product portfolio of each company
Geographic Analysis
Additional countries in any of the regions
Company Information
Detailed analysis and profiling of additional market players (Up to five)
The Parking Sensors Market size was estimated at USD 4.32 Billion in 2023 and is expected to reach USD 16.75 Billion by 2032 at a CAGR of 16.24% during the forecast period of 2024-2032.
The Human Augmentation Market size is expected to be valued at USD 221.99 Billion in 2023. It is estimated to reach USD 985.13 Billion by 2032, growing at a CAGR of 18.02% during 2024-2032.
The Infrared Thermography Market Size was valued at USD 433.5 Million in 2023 and is expected to grow at 5.95% CAGR to reach USD 729.1 Million by 2032.
The IoT in Smart Cities Market Size was valued at USD 195.18 Billion in 2023 and is expected to reach USD 952.69 Billion by 2032 and grow at a CAGR of 19.3% over the forecast period 2024-2032.
The GaN Semiconductor Devices Market Size was valued at USD 2.59 Billion in 2023 and expected to grow at 24.55% CAGR to reach USD 18.68 Billion by 2032.
The Hyperspectral Imaging Systems Market Size was valued at USD 16.17 Bn in 2023 and will reach USD 42.35 Bn by 2032 and grow at a CAGR of 11.31% by forecast period 2024-2032.
Hi! Click one of our member below to chat on Phone