Industrial IoT Display Market Key Insights
Get More Information on Industrial IoT Display Market - Request Sample Report
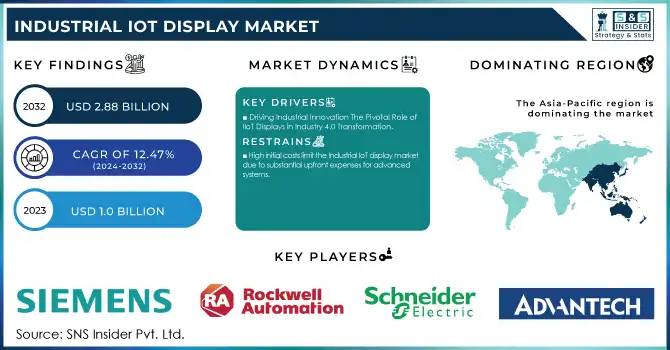
The Industrial IoT Display Market Size was valued at USD 1.0 Billion in 2023 and is expected to grow to USD 2.88 Billion by 2032 and grow at a CAGR Of 12.47 % over the forecast period of 2024-2032.
The growth of Industrial IoT display market is driven by the provision of real-time data visualization to improve operational efficiency, and drive data-based decision-making in industrial environments. The growing implementation of smart manufacturing technologies and Industry 4.0 across industries is expected to create a need for enhanced manufacturing display systems as real-time data from connected devices is essential for identifying opportunities for optimization, predictive maintenance and reduction in downtime. For Instance, SolidRun's newly announced HummingBoard i.MX8M IIoT SBC targeting industrial IoT and human-machine interface (HMI) applications. Based on the NXP i.MX 8M Plus SoM, the board includes four Arm Cortex-A53 cores at up to 1.8GHz, 8GB of LPDDR4 memory and up to 128GB of expandable storage. It delivers an adaptive cloud strategy to connect teams, systems, and sites to create an Information Technology and Operational Technology integration. One of the important aspects of IoT Operations is that the data interoperability is achieved through industry standards such as OPC UA. A scalable manufacturing technology stack has become a pillar for the factory of the future, with 73% of manufacturers agreeing it is a critical component, signaling a growing demand for advanced IoT Solutions. With the adoption of data analytics tools and cloud-based solutions, Industrial IoT display solutions are projected to witness a surge in demand, making way for real-time insights that facilitate faster decision-making and better profitability across verticals, including manufacturing, logistics, and energy.
MARKET DYNAMICS
Drivers
-
Driving Industrial Innovation The Pivotal Role of IIoT Displays in Industry 4.0 Transformation
The IIoT display market is growing rapidly as Industry 4.0 technologies continue to sich digital systems, automation and real-time data transfer into manufacturing. While the fourth industrial revolution is disrupting industries, operational efficiency, productivity, and adaptability have become primary goals and the key enabler for this process is IIoT displays which provides real time data visualization and human-machine interfaces (HMIs). With increased productivity and uptime, improved decision-making making them essential tools in modern-day manufacturing, these state-of-the-art display systems perform the grunt work behind machinery upkeep and repair. AI-driven robotics in the automotive sector are expected to streamline processes, improve accuracy and speed up operations; and as electronics manufacturing is relying more on AI-powered machine vision to check the quality of products, Likewise, AI is being used to improve production flows, compliance with regulations, and to facilitate the drug discovery workflow in the pharmaceutical and chemical industries. All of these advances underscore how IIoT displays underpin the real-time monitoring and control that fully enable Industry 4.0 technologies. IIoT shows how impactful Industry 4.0 > IIoT Digital panel display and other technologies as industries from different sectors continue their transformation to digitalization, which is also responsible to the adoption of smart manufacturing systems for effective operations as well as further the next era of industrial developments.
Restraints
-
High initial costs limit the Industrial IoT display market due to substantial upfront expenses for advanced systems.
Expenses related to hardware, software, installation, and integration often deter small and medium-sized enterprises from adopting these technologies. For instance, integrating IoT solutions in facilities management can be costly, as highlighted by Planon Software, which emphasizes the financial burden of digital transformation projects. Similarly, Sandvik underscores the challenges of industrial investment, particularly for SMEs operating on limited budgets, as these technologies require a comprehensive overhaul of existing systems. Despite cost-saving advantages like cutting maintenance costs by up to 50%, as demonstrated in a chemical plant case study using HPE’s IoT offering, the high initial outlay remains a critical barrier. According to Automation India Expo, industrial automation, including IIoT, can significantly reduce operational costs over time, yet the upfront financial demands discourage immediate adoption. Integrio.net reports that digital transformation costs can vary widely, often outweighing perceived short-term benefits for smaller players in the market. Additionally, Expanice estimates IoT implementation costs to range from thousands to millions of dollars depending on the scale, creating hesitancy among potential adopters. While IoT and industrial automation promise long-term efficiencies and improved ROI, as noted by Stormotion and 75way, these benefits are not immediately apparent, often leaving companies skeptical about the financial feasibility of such investments. Consequently, high initial costs serve as a critical restraint, impacting the IIoT display market's growth trajectory despite its transformative potential.
Segment Analysis
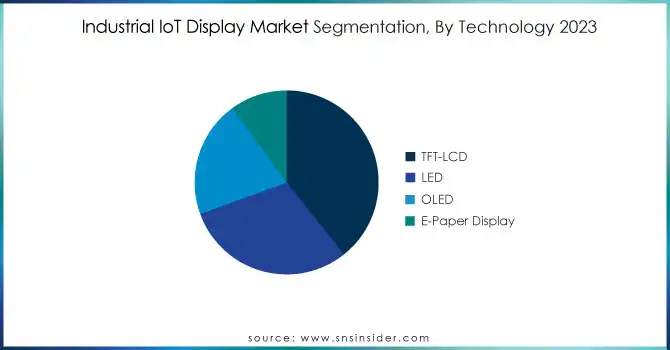
By Technology
The TFT-LCD segment dominates the Industrial IoT display market, holding around 40% of the market share in 2023. Thin Film Transistor Liquid Crystal Displays (TFT-LCDs) are preferred in industrial settings due to their high-quality visual output, energy efficiency, and ability to handle complex data. TFT-LCD displays provide sharp, clear images, making them ideal for real-time monitoring and data visualization in IIoT applications. Their wide viewing angles and durability make them suitable for use in various environments, from manufacturing floors to control rooms. Additionally, the growing demand for smart manufacturing systems and human-machine interfaces is driving the adoption of TFT-LCD displays, as they can support advanced features such as touch sensitivity, high resolution, and fast response times essential for IIoT applications.
By End Use Industry
The manufacturing segment dominates the Industrial IoT display market, accounting for approximately 35% of the market share in 2023. This dominance is driven by the increasing adoption of smart manufacturing technologies and Industry 4.0 initiatives, which rely heavily on real-time data visualization and human-machine interfaces IIoT displays in manufacturing environments are crucial for monitoring production lines, tracking equipment status, and ensuring operational efficiency. With advancements in automation, robotics, and predictive maintenance, displays are essential for managing complex systems and facilitating decision-making processes. The manufacturing sector’s demand for high-resolution, durable, and interactive displays that can integrate seamlessly with IIoT systems is contributing to the growth of this segment.
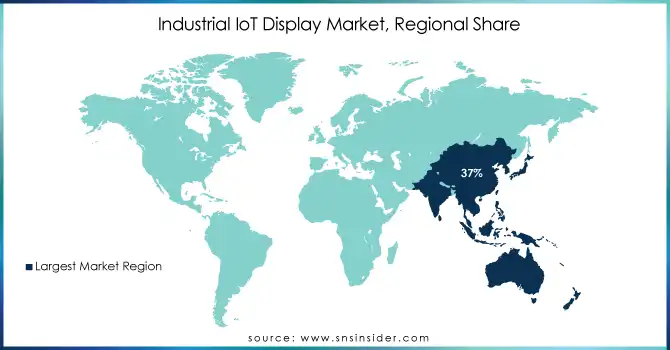
REGIONAL ANALYSIS
Asia-Pacific holds the largest revenue share of around 37% in the Industrial IoT display market in 2023, driven by rapid industrialization, technological advancements, and a growing focus on smart manufacturing across key countries in the region. Leading economies like China, Japan, South Korea, and India are spearheading the adoption of IIoT technologies. China’s robust manufacturing sector, combined with its push towards Industry 4.0, has significantly increased demand for advanced display systems in industrial applications. Japan and South Korea are enhancing factory automation, robotics, and AI technologies, creating a growing need for IIoT displays for real-time data visualization and operational control. India is also witnessing a digital transformation in its manufacturing sector, with investments in smart factories and automation technologies driving market growth. These countries are investing heavily in digital infrastructure, automation, and IoT technologies, further consolidating Asia-Pacific’s dominant position in the global IIoT display market.
North America is poised to be the fastest-growing region in the Industrial IoT display market from 2024 to 2032, fueled by technological advancements and strong investments in digital transformation. The U.S. and Canada are leaders in adopting IIoT technologies, with industries such as automotive, aerospace, and manufacturing driving demand for advanced display systems. Government initiatives like "Manufacturing USA" accelerate the integration of smart technologies, while the focus on smart factories, energy efficiency, and sustainable manufacturing practices further boosts the market. The rise of sectors like energy, chemicals, and pharmaceuticals adds to the demand, alongside the increasing use of AI and machine learning in manufacturing. This rapid adoption of automation and digital solutions positions North America as a dominant force in the global IIoT display market during the forecast period.
Need any customization research on Industrial IoT Display Market - Enquiry Now
KEY PLAYERS
Some of the major key players in Industrial IoT Display market along with their product:
-
Siemens AG (SIMATIC HMI, Industrial PCs)
-
Rockwell Automation (FactoryTalk View, PanelView Plus)
-
Schneider Electric (Magelis HMI, EcoStruxure Machine)
-
Honeywell International Inc. (Experion HS, HMIs)
-
Advantech Co., Ltd. (WebAccess, Industrial Touch Panel PCs)
-
General Electric (GE) (Proficy iFIX, HMI/SCADA)
-
Beckhoff Automation (TwinCAT HMI, Panel PCs)
-
Mitsubishi Electric Corporation (GOT2000, GOT Simple HMI)
-
ABB Ltd. (Human Machine Interface (HMI) Panels, ABB Ability)
-
Omron Corporation (NB Series HMI, Sysmac Studio)
-
Panasonic Corporation (TOUGHBOOK Tablets, Industrial PCs)
-
Keyence Corporation (GV Series, Touch Panel Display)
-
NXP Semiconductors (i.MX RT Series, Kinetis K Series)
-
Litemax Electronics Inc. (Industrial Display Solutions, Open Frame Monitors)
-
Winmate Inc. (Industrial Touchscreen Monitors, Rugged Panel PCs)
-
Digi International (eWON Flexy, Industrial Gateway Devices)
-
Beijer Electronics (X2 Pro, X2 Panel)
-
Toshiba Corporation (Industrial Touch Panels, HMI Solutions)
-
E Ink Holdings Inc. (E Ink Displays, Digital Signage)
-
BOE Technology Group Co., Ltd. (LCD Displays, OLED Displays)
List of Suppliers for raw materials and components used in IoT displays:
-
Corning Inc.
-
Samsung Display
-
LG Display
-
BOE Technology Group Co., Ltd.
-
Sharp Corporation
-
Japan Display Inc. (JDI)
-
AU Optronics
-
Innolux Corporation
-
Touch International
-
Wintek Corporation
-
Fujitsu Ltd.
-
Elbit Systems
-
3M
-
Nippon Electric Glass Co.
-
Tru-Vu Monitors
-
Vishay Intertechnology
-
Seiko Epson Corporation
-
Atmel (Microchip Technology)
-
Amphenol Corporation
-
Texas Instruments
RECENT DEVELOPMENT
-
November 14, 2024 – Rockwell Automation launched FactoryTalk Analytics VisionAI, an AI-powered solution designed to improve quality control in manufacturing. It uses machine learning to detect defects and optimize decision-making, enhancing operational efficiency and product quality.
-
March 27, 2024 – Mitsubishi Electric and HACARUS unveiled a collaboration at Manufacturing World Nagoya, showcasing their AI-powered visual inspection system. The system, designed for automating inspections of large die-casting parts and engine blocks, integrates with various robotic systems, enhancing defect detection with minimal data and simple adjustments for changing production conditions.
| Report Attributes | Details |
|---|---|
| Market Size in 2023 | USD 1.0 Billion |
| Market Size by 2032 | USD 2.88 Billion |
| CAGR | CAGR of 12.47% From 2024 to 2032 |
| Base Year | 2023 |
| Forecast Period | 2024-2032 |
| Historical Data | 2020-2022 |
| Report Scope & Coverage | Market Size, Segments Analysis, Competitive Landscape, Regional Analysis, DROC & SWOT Analysis, Forecast Outlook |
| Key Segments | • By Technology ( TFT-LCD, LED, OLED, E-Paper display) • By Panel Size (Less than 10”, Between 10”and 20”, More than 20”) • By Application (Human Machine Interface, Remote Monitoring, Interactive Display, Electronic Shelf Labels, Others) • By End Use Industry (Manufacturing, Healthcare, Energy & Power, Transportation, Others) |
| Regional Analysis/Coverage | North America (US, Canada, Mexico), Europe (Eastern Europe [Poland, Romania, Hungary, Turkey, Rest of Eastern Europe] Western Europe] Germany, France, UK, Italy, Spain, Netherlands, Switzerland, Austria, Rest of Western Europe]), Asia Pacific (China, India, Japan, South Korea, Vietnam, Singapore, Australia, Rest of Asia Pacific), Middle East & Africa (Middle East [UAE, Egypt, Saudi Arabia, Qatar, Rest of Middle East], Africa [Nigeria, South Africa, Rest of Africa], Latin America (Brazil, Argentina, Colombia, Rest of Latin America) |
| Company Profiles | Siemens AG, Rockwell Automation, Schneider Electric, Honeywell International Inc., Advantech Co., Ltd., General Electric (GE), Beckhoff Automation, Mitsubishi Electric Corporation, ABB Ltd., Omron Corporation, Panasonic Corporation, Keyence Corporation, NXP Semiconductors, Litemax Electronics Inc., Winmate Inc., Digi International, Beijer Electronics, Toshiba Corporation, E Ink Holdings Inc., and BOE Technology Group Co., Ltd. are key players in the industrial IoT display market. |
| Key Drivers | • Driving Industrial Innovation The Pivotal Role of IIoT Displays in Industry 4.0 Transformation. |
| Restraints | • High initial costs limit the Industrial IoT display market due to substantial upfront expenses for advanced systems. |
