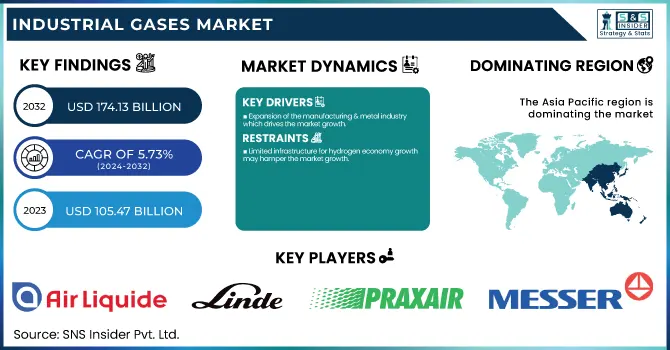
The Industrial Gases Market size was USD 105.47 Billion in 2023 and is expected to reach USD 174.13 Billion by 2032 and grow at a CAGR of 5.73 % over the forecast period of 2024-2032. The industrial gases market report provides an in-depth analysis of production capacity and utilization rates, highlighting the increasing demand for oxygen and nitrogen across various industries. It examines feedstock price fluctuations, particularly the impact of natural gas and electricity costs on hydrogen production and air separation processes. The report explores regulatory developments, including incentives and policies driving the adoption of low-carbon gases and carbon capture technologies. Additionally, it assesses sustainability initiatives, such as CO₂ capture projects and energy-efficient air separation technologies. Lastly, it highlights R&D advancements, focusing on green hydrogen, AI-driven gas optimization, and blockchain-based traceability solutions.
To Get more information on Industrial Gases Market - Request Free Sample Report
Drivers
Expansion of the manufacturing & metal industry which drives the market growth.
Growing manufacturing and metal activity, where industrial gases are widely used in many metal processing applications, is one of the main drivers of industrial gases market expansion. In steelmaking, welding, metal cutting, and heat treatment, generally, oxygen, nitrogen, argon, and hydrogen are used. Increased consumption of industrial gases is driven by the growing automotive, aerospace, building & construction, and heavy machinery industries, where steel, aluminum, and fabricated metal products have larger applications. Advances in automated welding technologies and additive manufacturing (3D printing) continually require high-purity shielding gases such as argon and helium as well. Oxy-fuel combustion technology can improve combustion efficiency and reduce CO₂ emissions, thus, it has been widely used in energy-efficient and low-carbon metal production. The industrial gas market is also anticipated to grow in the upcoming years due to swift industrialization, growing infrastructural activities, and governments encouraging the prospect of manufacturing.
Restraint
Limited infrastructure for hydrogen economy growth may hamper the market growth.
The limited infrastructure for hydrogen economy growth has emerged as a major obstacle for the hydrogen industrial gases market. Even though we are witnessing a gradual transition to the use of green hydrogen and hydrogen fuel cells as a clean energy source, the current absence of hydrogen refueling stations, dedicated pipelines, and large-scale electrolysis plants limits widespread adoption. Shipping it requires cryogenic tanks and highly pressurized tankers, which makes the overall logistically pricey and raises safety concerns. Slow market growth is exacerbated by a lack of harmonization in policies and infrastructure investments in hydrogen in general. The lack of support from governments in the form of policies, subsidies, and public deployment projects, accompanied by a missing upscaling of the necessary technology, and involvement of the private sector, will slow the transition to a hydrogen economy, limiting the development of the overall industrial gases market.
Opportunity
Increasing adoption of carbon capture, utilization & storage creates an opportunity in the market.
Carbon Capture, Utilization, and Storage (CCUS) is gaining wider adoption across industries, which will be a major opportunity for the industrial gases market as companies seek sustainable means to decarbonize. Carbon capture, CCUS technology captures CO₂ emissions that will prevent CO₂ from being released into the atmosphere out of power plants, refineries, and industrial facilities. The CO₂ captured is then either injected underground and stored in geological formations, or used for enhanced oil recovery (EOR), and in some applications for chemical synthesis and food & beverage carbonation. As government regulations on carbon emissions become more stringent, numerous industries are stepping up investments in carbon capture infrastructure, which in turn is increasing the demand for high-purity industrial gases such as nitrogen and CO₂ used in carbon storage and transportation. Furthermore, technological improvement concerning gas separation, associated with blue hydrogen projects (which embeds CCUS) will translate into a robust market potential. The industrial gas market will see tremendous growth due to the growing penetration of CCUS technologies as governments and corporations place higher priority on decarbonization initiatives.
Challenges
Complex storage and transportation requirements may create a challenge for the market.
The unique storage and transport needs of industrial gases are a primary obstacle to market expansion. Infrastructure costs are very high due to the necessity of high-pressure cylinders, cryogenic tanks (for low-density gases like hydrogen), or dedicated pipelines (for liquefied natural gas (LNG)). Moving these gases long distances necessitates dedicated insulated tankers, requiring ultra-low temperature holding and greatly increasing logistical costs and supply chain complexities. The threat of leakage, the need for regulatory compliance regarding hazardous materials, and strict safety measures all make distribution more complicated. For industries dependent on bulk gas supply, transport which involves continuous monitoring, prompt handling, and compliance with international safety standards is a major challenge to their operations. The market may probably be constrained to meet the growing demand of the industry without progressing storage technology and its rationalized distribution network.
By Gas Type
Oxygen held the largest market share around 32% in 2023. It is due to its wide range of end-use industries, oxygen accounted for the largest share of the market in the industrial gases market. Oxygen is an important aspect of medical products in the healthcare industry as it is used mainly for therapeutic & respiratory treatment or life support applications, where the demand from hospitals and home healthcare facilities is growing. Another significant end use in the steel & metal production industry, where oxygen is used in basic oxygen furnaces (BOF) and oxy-fuel combustion processes. Oxygen also acts as an important element in oxidation reactions, wastewater treatment, and better oil recovery (EOR) in chemical and petrochemical industries. Its application in waste incineration and water treatment plants has also been assisted by the increased focus on environmental sustainability.
By End Use Industry
Manufacturing held the largest market share around 28% in 2023. This manufacturing industry is the largest one in the industrial gas market since this industry depends on gaseous resources for production purposes. Industrial gases like oxygen, nitrogen, argon, and hydrogen play an important role in metal fabrication, welding, cutting, and heat treatment, which is an important sector e.g. automotive, aerospace, and heavy machinery production industries. Despite air separation becoming a bigger part of energy generation and gas consumer industries progressively utilizing clean energy solutions and advanced production techniques, the manufacturing industry is and will continue to be the largest consumer of industrial gases, cementing the dominant market position of this sector.
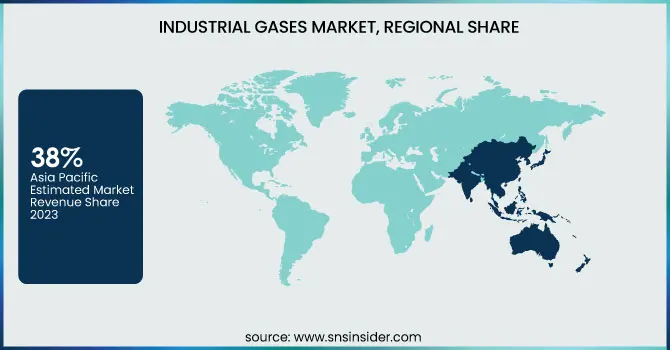
Asia Pacific held the largest market share around 38% in 2023. It is owing to its rapid industrialization, growing manufacturing sector, and high demand from key end-use industry. The steel, automotive, electronics, and chemicals production have grown massively in the countries of the region that depend heavily on oxygen, nitrogen, argon, and hydrogen gases for various processes. Also, the rapidly growing healthcare sector, due to the increasing aging population and growing medical infrastructure, is another factor driving the demand medical oxygen. The region is also the world leader in semiconductor and electronics manufacturing, where fab and process demand high-purity gases. Asia Pacific has strengthened its dominance due to availability of cheaper labor, growing foreign investments and government policies supporting industrial developments. To that end, clean energy and hydrogen infrastructure development is ongoing across the region making it an industrial gas consumption hub.
North America held a significant market share in 2023. This is due to the solid industrial base, demand from core industries, and growth in gas technologies to boost the industrial branches-across the country. Healthcare, chemicals, oil & gas, metal fabrication, and food & beverage are some of the industries that are present in high numbers in the region and these industries consume industrial gases extensively for performing critical operations. Market growth is also fueled by rising adoption of hydrogen in clean energy applications, increased investments in hydrogen infrastructure by governments around the world. In addition to that high concentration of technologically advanced R &D and high regulatory standard guarantees strong innovativeness, and supply chain. A rising requirement for medical oxygen in hospitals and home healthcare centers as well as surge in demand for specialty gases in electronics and semiconductor production is also augmenting North America position in the global market.
Get Customized Report as per Your Business Requirement - Enquiry Now
Key Players
Air Liquide (Alphagaz, Scott)
Linde plc (HiQ, Spectra)
Praxair (StarFlame, Medipure)
Messer Group (Gasevo, Variocarb)
Air Products & Chemicals (Freshline, Halia)
Taiyo Nippon Sanso Corporation (SanFresh, Argamax)
Mitsui Chemicals (SunForce, AURUM)
SOL Group (SolMet, SolMed)
Showa Denko K.K. (Shodex, EAGLEBURGMANN)
Iwatani Corporation (Hydrocut, Thermotron)
Gulf Cryo (CryoPlus, Helion)
Ellenbarrie Industrial Gases (EllOxy, EllWeld)
Buzwair Industrial Gases (BuzzGas, CryoTech)
INOX Air Products (INOX-Weld, CryoShield)
Coregas Pty Ltd (CoreShield, CoreWeld)
Air Water Inc. (KryoTech, FreseniusGas)
Matheson Tri-Gas (Pureshield, TriMix)
SIAD Group (GreenShield, LASERLINE)
Leland Limited (LelOx, CO2Boost)
Universal Industrial Gases (UIG-Oxygen, UIG-Argon)
Recent Development:
In July 2024, Honeywell announced the acquisition of Air Products' LNG process technology and equipment business for USD 1.81 billion in an all-cash deal. This strategic move enhances Honeywell’s position in the LNG sector, expanding its energy solutions portfolio.
In July 2023, NovaAir Technologies unveiled plans to establish a medical and industrial gases plant in Karnataka, India. The initiative aims to address the rising demand for medical gases in the healthcare sector. This expansion reinforces the company's commitment to enhancing gas supply infrastructure.
| Report Attributes | Details |
|---|---|
| Market Size in 2023 | USD 105.47 Billion |
| Market Size by 2032 | USD 174.13 Billion |
| CAGR | CAGR of 5.73% From 2024 to 2032 |
| Base Year | 2023 |
| Forecast Period | 2024-2032 |
| Historical Data | 2020-2022 |
| Report Scope & Coverage | Market Size, Segments Analysis, Competitive Landscape, Regional Analysis, DROC & SWOT Analysis, Forecast Outlook |
| Key Segments | •By Gas Type (Oxygen, Nitrogen, Hydrogen, Carbon dioxide, Acetylene, Argon) •By End-Use Industry (Healthcare, Manufacturing, Metallurgy & Glass, Food & Beverage, Retail, Chemicals & Energy, Others) |
| Regional Analysis/Coverage | North America (US, Canada, Mexico), Europe (Eastern Europe [Poland, Romania, Hungary, Turkey, Rest of Eastern Europe] Western Europe] Germany, France, UK, Italy, Spain, Netherlands, Switzerland, Austria, Rest of Western Europe]), Asia Pacific (China, India, Japan, South Korea, Vietnam, Singapore, Australia, Rest of Asia Pacific), Middle East & Africa (Middle East [UAE, Egypt, Saudi Arabia, Qatar, Rest of Middle East], Africa [Nigeria, South Africa, Rest of Africa], Latin America (Brazil, Argentina, Colombia, Rest of Latin America) |
| Company Profiles | Air Liquide, Linde plc, Praxair, Messer Group, Air Products & Chemicals, Taiyo Nippon Sanso Corporation, Mitsui Chemicals, SOL Group, Showa Denko K.K., Iwatani Corporation, Gulf Cryo, Ellenbarrie Industrial Gases, Buzwair Industrial Gases, INOX Air Products, Coregas Pty Ltd, Air Water Inc., Matheson Tri-Gas, SIAD Group, Leland Limited, Universal Industrial Gases |
Ans: The Industrial Gases Market was valued at USD 105.47 Billion in 2023.
Ans: The expected CAGR of the global Industrial Gases Market during the forecast period is 5.73%
Ans: The Oxygen will grow rapidly in the Industrial Gases Market from 2024-2032.
Ans: Expansion of the manufacturing & metal industry which drives the market growth.
Ans: Asia Pacific led the Industrial Gases Market in the region with the highest revenue share in 2023.
Table of Contents:
1. Introduction
1.1 Market Definition
1.2 Scope (Inclusion and Exclusions)
1.3 Research Assumptions
2. Executive Summary
2.1 Market Overview
2.2 Regional Synopsis
2.3 Competitive Summary
3. Research Methodology
3.1 Top-Down Approach
3.2 Bottom-up Approach
3.3. Data Validation
3.4 Primary Interviews
4. Market Dynamics Impact Analysis
4.1 Market Driving Factors Analysis
4.1.2 Drivers
4.1.2 Restraints
4.1.3 Opportunities
4.1.4 Challenges
4.2 PESTLE Analysis
4.3 Porter’s Five Forces Model
5. Statistical Insights and Trends Reporting
5.1 Production Capacity and Utilization, by Country, By Type, 2023
5.2 Feedstock Prices, by Country, By Type, 2023
5.3 Regulatory Impact, by Country, By Type 2023.
5.4 Environmental Metrics: Emissions Data, Waste Management Practices, and Sustainability Initiatives, by Region
5.5 Innovation and R&D, Type, 2023
6. Competitive Landscape
6.1 List of Major Companies, By Region
6.2 Market Share Analysis, By Region
6.3 Product Benchmarking
6.3.1 Product specifications and features
6.3.2 Pricing
6.4 Strategic Initiatives
6.4.1 Marketing and promotional activities
6.4.2 Distribution and Supply Chain Strategies
6.4.3 Expansion Plans and New Product Launches
6.4.4 Strategic partnerships and collaborations
6.5 Technological Advancements
6.6 Market Positioning and Branding
7. Industrial Gases Market Segmentation, By Gas Type
7.1 Chapter Overview
7.2 Oxygen
7.2.1 Oxygen Trends Analysis (2020-2032)
7.2.2 Oxygen Market Size Estimates and Forecasts to 2032 (USD Billion)
7.3 Nitrogen
7.3.1 Nitrogen Market Trends Analysis (2020-2032)
7.3.2 Nitrogen Market Size Estimates and Forecasts to 2032 (USD Billion)
7.4 Hydrogen
7.4.1 Hydrogen Trends Analysis (2020-2032)
7.4.2 Hydrogen Market Size Estimates and Forecasts to 2032 (USD Billion)
7.5 Carbon dioxide
7.5.1 Carbon Dioxide Market Trends Analysis (2020-2032)
7.5.2 Carbon Dioxide Market Size Estimates and Forecasts to 2032 (USD Billion)
7.6 Acetylene
7.6.1 Acetylene Trends Analysis (2020-2032)
7.6.2 Acetylene Market Size Estimates and Forecasts to 2032 (USD Billion)
7.7 Argon
7.7.1 Argon Trends Analysis (2020-2032)
7.7.2 Argon Market Size Estimates and Forecasts to 2032 (USD Billion)
8. Industrial Gases Market Segmentation, by End-Use Industry
8.1 Chapter Overview
8.2 Healthcare
8.2.1 Healthcare Market Trends Analysis (2020-2032)
8.2.2 Healthcare Market Size Estimates and Forecasts to 2032 (USD Billion)
8.3 Manufacturing
8.3.1 Manufacturing Market Trends Analysis (2020-2032)
8.3.2 Manufacturing Market Size Estimates and Forecasts to 2032 (USD Billion)
8.4 Metallurgy & Glass
8.4.1 Metallurgy & Glass Market Trends Analysis (2020-2032)
8.4.2 Metallurgy & Glass Market Size Estimates and Forecasts to 2032 (USD Billion)
8.5 Food & Beverage
8.5.1 Food & Beverage Market Trends Analysis (2020-2032)
8.5.2 Food & Beverage Market Size Estimates and Forecasts to 2032 (USD Billion)
8.6 Retail
8.6.1 Retail Market Trends Analysis (2020-2032)
8.6.2 Retail Market Size Estimates and Forecasts to 2032 (USD Billion)
8.7 Chemicals & Energy
8.7.1 Chemicals & Energy Market Trends Analysis (2020-2032)
8.7.2 Chemicals & Energy Market Size Estimates and Forecasts to 2032 (USD Billion)
8.8 Others
8.8.1 Others Market Trends Analysis (2020-2032)
8.8.2 Others Market Size Estimates and Forecasts to 2032 (USD Billion)
9. Regional Analysis
9.1 Chapter Overview
9.2 North America
9.2.1 Trends Analysis
9.2.2 North America Industrial Gases Market Estimates and Forecasts, by Country (2020-2032) (USD Billion)
9.2.3 North America Industrial Gases Market Estimates and Forecasts, By Gas Type (2020-2032) (USD Billion)
9.2.4 North America Industrial Gases Market Estimates and Forecasts, by End-Use Industry (2020-2032) (USD Billion)
9.2.5 USA
9.2.5.1 USA Industrial Gases Market Estimates and Forecasts, By Gas Type (2020-2032) (USD Billion)
9.2.5.2 USA Industrial Gases Market Estimates and Forecasts, by End-Use Industry (2020-2032) (USD Billion)
9.2.6 Canada
9.2.6.1 Canada Industrial Gases Market Estimates and Forecasts, By Gas Type (2020-2032) (USD Billion)
9.2.6.2 Canada Industrial Gases Market Estimates and Forecasts, by End-Use Industry (2020-2032) (USD Billion)
9.2.7 Mexico
9.2.7.1 Mexico Industrial Gases Market Estimates and Forecasts, By Gas Type (2020-2032) (USD Billion)
9.2.7.2 Mexico Industrial Gases Market Estimates and Forecasts, by End-Use Industry (2020-2032) (USD Billion)
9.3 Europe
9.3.1 Eastern Europe
9.3.1.1 Trends Analysis
9.3.1.2 Eastern Europe Industrial Gases Market Estimates and Forecasts, by Country (2020-2032) (USD Billion)
9.3.1.3 Eastern Europe Industrial Gases Market Estimates and Forecasts, By Gas Type (2020-2032) (USD Billion)
9.3.1.4 Eastern Europe Industrial Gases Market Estimates and Forecasts, by End-Use Industry (2020-2032) (USD Billion)
9.3.1.5 Poland
9.3.1.5.1 Poland Industrial Gases Market Estimates and Forecasts, By Gas Type (2020-2032) (USD Billion)
9.3.1.5.2 Poland Industrial Gases Market Estimates and Forecasts, by End-Use Industry (2020-2032) (USD Billion)
9.3.1.6 Romania
9.3.1.6.1 Romania Industrial Gases Market Estimates and Forecasts, By Gas Type (2020-2032) (USD Billion)
9.3.1.6.2 Romania Industrial Gases Market Estimates and Forecasts, by End-Use Industry (2020-2032) (USD Billion)
9.3.1.7 Hungary
9.3.1.7.1 Hungary Industrial Gases Market Estimates and Forecasts, By Gas Type (2020-2032) (USD Billion)
9.3.1.7.2 Hungary Industrial Gases Market Estimates and Forecasts, by End-Use Industry (2020-2032) (USD Billion)
9.3.1.8 Turkey
9.3.1.8.1 Turkey Industrial Gases Market Estimates and Forecasts, By Gas Type (2020-2032) (USD Billion)
9.3.1.8.2 Turkey Industrial Gases Market Estimates and Forecasts, by End-Use Industry (2020-2032) (USD Billion)
9.3.1.9 Rest of Eastern Europe
9.3.1.9.1 Rest of Eastern Europe Industrial Gases Market Estimates and Forecasts, By Gas Type (2020-2032) (USD Billion)
9.3.1.9.2 Rest of Eastern Europe Industrial Gases Market Estimates and Forecasts, by End-Use Industry (2020-2032) (USD Billion)
9.3.2 Western Europe
9.3.2.1 Trends Analysis
9.3.2.2 Western Europe Industrial Gases Market Estimates and Forecasts, by Country (2020-2032) (USD Billion)
9.3.2.3 Western Europe Industrial Gases Market Estimates and Forecasts, By Gas Type (2020-2032) (USD Billion)
9.3.2.4 Western Europe Industrial Gases Market Estimates and Forecasts, by End-Use Industry (2020-2032) (USD Billion)
9.3.2.5 Germany
9.3.2.5.1 Germany Industrial Gases Market Estimates and Forecasts, By Gas Type (2020-2032) (USD Billion)
9.3.2.5.2 Germany Industrial Gases Market Estimates and Forecasts, by End-Use Industry (2020-2032) (USD Billion)
9.3.2.6 France
9.3.2.6.1 France Industrial Gases Market Estimates and Forecasts, By Gas Type (2020-2032) (USD Billion)
9.3.2.6.2 France Industrial Gases Market Estimates and Forecasts, by End-Use Industry (2020-2032) (USD Billion)
9.3.2.7 UK
9.3.2.7.1 UK Industrial Gases Market Estimates and Forecasts, By Gas Type (2020-2032) (USD Billion)
9.3.2.7.2 UK Industrial Gases Market Estimates and Forecasts, by End-Use Industry (2020-2032) (USD Billion)
9.3.2.8 Italy
9.3.2.8.1 Italy Industrial Gases Market Estimates and Forecasts, By Gas Type (2020-2032) (USD Billion)
9.3.2.8.2 Italy Industrial Gases Market Estimates and Forecasts, by End-Use Industry (2020-2032) (USD Billion)
9.3.2.9 Spain
9.3.2.9.1 Spain Industrial Gases Market Estimates and Forecasts, By Gas Type (2020-2032) (USD Billion)
9.3.2.9.2 Spain Industrial Gases Market Estimates and Forecasts, by End-Use Industry (2020-2032) (USD Billion)
9.3.2.10 Netherlands
9.3.2.10.1 Netherlands Industrial Gases Market Estimates and Forecasts, By Gas Type (2020-2032) (USD Billion)
9.3.2.10.2 Netherlands Industrial Gases Market Estimates and Forecasts, by End-Use Industry (2020-2032) (USD Billion)
9.3.2.11 Switzerland
9.3.2.11.1 Switzerland Industrial Gases Market Estimates and Forecasts, By Gas Type (2020-2032) (USD Billion)
9.3.2.11.2 Switzerland Industrial Gases Market Estimates and Forecasts, by End-Use Industry (2020-2032) (USD Billion)
9.3.2.12 Austria
9.3.2.12.1 Austria Industrial Gases Market Estimates and Forecasts, By Gas Type (2020-2032) (USD Billion)
9.3.2.12.2 Austria Industrial Gases Market Estimates and Forecasts, by End-Use Industry (2020-2032) (USD Billion)
9.3.2.13 Rest of Western Europe
9.3.2.13.1 Rest of Western Europe Industrial Gases Market Estimates and Forecasts, By Gas Type (2020-2032) (USD Billion)
9.3.2.13.2 Rest of Western Europe Industrial Gases Market Estimates and Forecasts, by End-Use Industry (2020-2032) (USD Billion)
9.4 Asia Pacific
9.4.1 Trends Analysis
9.4.2 Asia Pacific Industrial Gases Market Estimates and Forecasts, by Country (2020-2032) (USD Billion)
9.4.3 Asia Pacific Industrial Gases Market Estimates and Forecasts, By Gas Type (2020-2032) (USD Billion)
9.4.4 Asia Pacific Industrial Gases Market Estimates and Forecasts, by End-Use Industry (2020-2032) (USD Billion)
9.4.5 China
9.4.5.1 China Industrial Gases Market Estimates and Forecasts, By Gas Type (2020-2032) (USD Billion)
9.4.5.2 China Industrial Gases Market Estimates and Forecasts, by End-Use Industry (2020-2032) (USD Billion)
9.4.6 India
9.4.5.1 India Industrial Gases Market Estimates and Forecasts, By Gas Type (2020-2032) (USD Billion)
9.4.5.2 India Industrial Gases Market Estimates and Forecasts, by End-Use Industry (2020-2032) (USD Billion)
9.4.5 Japan
9.4.5.1 Japan Industrial Gases Market Estimates and Forecasts, By Gas Type (2020-2032) (USD Billion)
9.4.5.2 Japan Industrial Gases Market Estimates and Forecasts, by End-Use Industry (2020-2032) (USD Billion)
9.4.6 South Korea
9.4.6.1 South Korea Industrial Gases Market Estimates and Forecasts, By Gas Type (2020-2032) (USD Billion)
9.4.6.2 South Korea Industrial Gases Market Estimates and Forecasts, by End-Use Industry (2020-2032) (USD Billion)
9.4.7 Vietnam
9.4.7.1 Vietnam Industrial Gases Market Estimates and Forecasts, By Gas Type (2020-2032) (USD Billion)
9.2.7.2 Vietnam Industrial Gases Market Estimates and Forecasts, by End-Use Industry (2020-2032) (USD Billion)
9.4.8 Singapore
9.4.8.1 Singapore Industrial Gases Market Estimates and Forecasts, By Gas Type (2020-2032) (USD Billion)
9.4.8.2 Singapore Industrial Gases Market Estimates and Forecasts, by End-Use Industry (2020-2032) (USD Billion)
9.4.9 Australia
9.4.9.1 Australia Industrial Gases Market Estimates and Forecasts, By Gas Type (2020-2032) (USD Billion)
9.4.9.2 Australia Industrial Gases Market Estimates and Forecasts, by End-Use Industry (2020-2032) (USD Billion)
9.4.10 Rest of Asia Pacific
9.4.10.1 Rest of Asia Pacific Industrial Gases Market Estimates and Forecasts, By Gas Type (2020-2032) (USD Billion)
9.4.10.2 Rest of Asia Pacific Industrial Gases Market Estimates and Forecasts, by End-Use Industry (2020-2032) (USD Billion)
9.5 Middle East and Africa
9.5.1 Middle East
9.5.1.1 Trends Analysis
9.5.1.2 Middle East Industrial Gases Market Estimates and Forecasts, by Country (2020-2032) (USD Billion)
9.5.1.3 Middle East Industrial Gases Market Estimates and Forecasts, By Gas Type (2020-2032) (USD Billion)
9.5.1.4 Middle East Industrial Gases Market Estimates and Forecasts, by End-Use Industry (2020-2032) (USD Billion)
9.5.1.5 UAE
9.5.1.5.1 UAE Industrial Gases Market Estimates and Forecasts, By Gas Type (2020-2032) (USD Billion)
9.5.1.5.2 UAE Industrial Gases Market Estimates and Forecasts, by End-Use Industry (2020-2032) (USD Billion)
9.5.1.6 Egypt
9.5.1.6.1 Egypt Industrial Gases Market Estimates and Forecasts, By Gas Type (2020-2032) (USD Billion)
9.5.1.6.2 Egypt Industrial Gases Market Estimates and Forecasts, by End-Use Industry (2020-2032) (USD Billion)
9.5.1.7 Saudi Arabia
9.5.1.7.1 Saudi Arabia Industrial Gases Market Estimates and Forecasts, By Gas Type (2020-2032) (USD Billion)
9.5.1.7.2 Saudi Arabia Industrial Gases Market Estimates and Forecasts, by End-Use Industry (2020-2032) (USD Billion)
9.5.1.8 Qatar
9.5.1.8.1 Qatar Industrial Gases Market Estimates and Forecasts, By Gas Type (2020-2032) (USD Billion)
9.5.1.8.2 Qatar Industrial Gases Market Estimates and Forecasts, by End-Use Industry (2020-2032) (USD Billion)
9.5.1.9 Rest of Middle East
9.5.1.9.1 Rest of Middle East Industrial Gases Market Estimates and Forecasts, By Gas Type (2020-2032) (USD Billion)
9.5.1.9.2 Rest of Middle East Industrial Gases Market Estimates and Forecasts, by End-Use Industry (2020-2032) (USD Billion)
9.5.2 Africa
9.5.2.1 Trends Analysis
9.5.2.2 Africa Industrial Gases Market Estimates and Forecasts, by Country (2020-2032) (USD Billion)
9.5.2.3 Africa Industrial Gases Market Estimates and Forecasts, By Gas Type (2020-2032) (USD Billion)
9.5.2.4 Africa Industrial Gases Market Estimates and Forecasts, by End-Use Industry (2020-2032) (USD Billion)
9.5.2.5 South Africa
9.5.2.5.1 South Africa Industrial Gases Market Estimates and Forecasts, By Gas Type (2020-2032) (USD Billion)
9.5.2.5.2 South Africa Industrial Gases Market Estimates and Forecasts, by End-Use Industry (2020-2032) (USD Billion)
9.5.2.6 Nigeria
9.5.2.6.1 Nigeria Industrial Gases Market Estimates and Forecasts, By Gas Type (2020-2032) (USD Billion)
9.5.2.6.2 Nigeria Industrial Gases Market Estimates and Forecasts, by End-Use Industry (2020-2032) (USD Billion)
9.6 Latin America
9.6.1 Trends Analysis
9.6.2 Latin America Industrial Gases Market Estimates and Forecasts, by Country (2020-2032) (USD Billion)
9.6.3 Latin America Industrial Gases Market Estimates and Forecasts, By Gas Type (2020-2032) (USD Billion)
9.6.4 Latin America Industrial Gases Market Estimates and Forecasts, by End-Use Industry (2020-2032) (USD Billion)
9.6.5 Brazil
9.6.5.1 Brazil Industrial Gases Market Estimates and Forecasts, By Gas Type (2020-2032) (USD Billion)
9.6.5.2 Brazil Industrial Gases Market Estimates and Forecasts, by End-Use Industry (2020-2032) (USD Billion)
9.6.6 Argentina
9.6.6.1 Argentina Industrial Gases Market Estimates and Forecasts, By Gas Type (2020-2032) (USD Billion)
9.6.6.2 Argentina Industrial Gases Market Estimates and Forecasts, by End-Use Industry (2020-2032) (USD Billion)
9.6.7 Colombia
9.6.7.1 Colombia Industrial Gases Market Estimates and Forecasts, By Gas Type (2020-2032) (USD Billion)
9.6.7.2 Colombia Industrial Gases Market Estimates and Forecasts, by End-Use Industry (2020-2032) (USD Billion)
9.6.8 Rest of Latin America
9.6.8.1 Rest of Latin America Industrial Gases Market Estimates and Forecasts, By Gas Type (2020-2032) (USD Billion)
9.6.8.2 Rest of Latin America Industrial Gases Market Estimates and Forecasts, by End-Use Industry (2020-2032) (USD Billion)
10. Company Profiles
10.1 BASF SE
10.1.1 Company Overview
10.1.2 Financial
10.1.3 Product / Services Offered
10.1.4 SWOT Analysis
10.2 Huntsman Corporation
10.2.1 Company Overview
10.2.2 Financial
10.2.3 Product/ Services Offered
10.2.4 SWOT Analysis
10.3 LyondellBasell Industries
10.3.1 Company Overview
10.3.2 Financial
10.3.3 Product/ Services Offered
10.3.4 SWOT Analysis
10.4 Dow Inc.
10.4.1 Company Overview
10.4.2 Financial
10.4.3 Product/ Services Offered
10.4.4 SWOT Analysis
10.5 Lotte Chemical Corporation
10.5.1 Company Overview
10.5.2 Financial
10.5.3 Product/ Services Offered
10.5.4 SWOT Analysis
10.6 Hi-Tech Chemicals Co., Ltd.
10.6.1 Company Overview
10.6.2 Financial
10.6.3 Product/ Services Offered
10.6.4 SWOT Analysis
10.7 Nippon Chemical Industrial Co., Ltd.
10.7.1 Company Overview
10.7.2 Financial
10.7.3 Product/ Services Offered
10.7.4 SWOT Analysis
10.8 Eastman Chemical Company
10.8.1 Company Overview
10.8.2 Financial
10.8.3 Product/ Services Offered
10.8.4 SWOT Analysis
10.9 Mitsubishi Chemical Corporation
10.9.1 Company Overview
10.9.2 Financial
10.9.3 Product/ Services Offered
10.9.4 SWOT Analysis
10.10 Jiangsu Aoke Chemical Co., Ltd.
10.10.1 Company Overview
10.10.2 Financial
10.10.3 Product/ Services Offered
10.10.4 SWOT Analysis
11. Use Cases and Best Practices
12. Conclusion
An accurate research report requires proper strategizing as well as implementation. There are multiple factors involved in the completion of good and accurate research report and selecting the best methodology to compete the research is the toughest part. Since the research reports we provide play a crucial role in any company’s decision-making process, therefore we at SNS Insider always believe that we should choose the best method which gives us results closer to reality. This allows us to reach at a stage wherein we can provide our clients best and accurate investment to output ratio.
Each report that we prepare takes a timeframe of 350-400 business hours for production. Starting from the selection of titles through a couple of in-depth brain storming session to the final QC process before uploading our titles on our website we dedicate around 350 working hours. The titles are selected based on their current market cap and the foreseen CAGR and growth.
The 5 steps process:
Step 1: Secondary Research:
Secondary Research or Desk Research is as the name suggests is a research process wherein, we collect data through the readily available information. In this process we use various paid and unpaid databases which our team has access to and gather data through the same. This includes examining of listed companies’ annual reports, Journals, SEC filling etc. Apart from this our team has access to various associations across the globe across different industries. Lastly, we have exchange relationships with various university as well as individual libraries.

Step 2: Primary Research
When we talk about primary research, it is a type of study in which the researchers collect relevant data samples directly, rather than relying on previously collected data. This type of research is focused on gaining content specific facts that can be sued to solve specific problems. Since the collected data is fresh and first hand therefore it makes the study more accurate and genuine.
We at SNS Insider have divided Primary Research into 2 parts.
Part 1 wherein we interview the KOLs of major players as well as the upcoming ones across various geographic regions. This allows us to have their view over the market scenario and acts as an important tool to come closer to the accurate market numbers. As many as 45 paid and unpaid primary interviews are taken from both the demand and supply side of the industry to make sure we land at an accurate judgement and analysis of the market.
This step involves the triangulation of data wherein our team analyses the interview transcripts, online survey responses and observation of on filed participants. The below mentioned chart should give a better understanding of the part 1 of the primary interview.

Part 2: In this part of primary research the data collected via secondary research and the part 1 of the primary research is validated with the interviews from individual consultants and subject matter experts.
Consultants are those set of people who have at least 12 years of experience and expertise within the industry whereas Subject Matter Experts are those with at least 15 years of experience behind their back within the same space. The data with the help of two main processes i.e., FGDs (Focused Group Discussions) and IDs (Individual Discussions). This gives us a 3rd party nonbiased primary view of the market scenario making it a more dependable one while collation of the data pointers.
Step 3: Data Bank Validation
Once all the information is collected via primary and secondary sources, we run that information for data validation. At our intelligence centre our research heads track a lot of information related to the market which includes the quarterly reports, the daily stock prices, and other relevant information. Our data bank server gets updated every fortnight and that is how the information which we collected using our primary and secondary information is revalidated in real time.

Step 4: QA/QC Process
After all the data collection and validation our team does a final level of quality check and quality assurance to get rid of any unwanted or undesired mistakes. This might include but not limited to getting rid of the any typos, duplication of numbers or missing of any important information. The people involved in this process include technical content writers, research heads and graphics people. Once this process is completed the title gets uploader on our platform for our clients to read it.
Step 5: Final QC/QA Process:
This is the last process and comes when the client has ordered the study. In this process a final QA/QC is done before the study is emailed to the client. Since we believe in giving our clients a good experience of our research studies, therefore, to make sure that we do not lack at our end in any way humanly possible we do a final round of quality check and then dispatch the study to the client.
Key Segments:
By Gas Type
Oxygen
Nitrogen
Hydrogen
Carbon dioxide
Acetylene
Argon
By End-Use Industry
Healthcare
Manufacturing
Metallurgy & Glass
Food & Beverage
Retail
Chemicals & Energy
Others
Request for Segment Customization as per your Business Requirement: Segment Customization Request
Regional Coverage:
North America
US
Canada
Mexico
Europe
Eastern Europe
Poland
Romania
Hungary
Turkey
Rest of Eastern Europe
Western Europe
Germany
France
UK
Italy
Spain
Netherlands
Switzerland
Austria
Rest of Western Europe
Asia Pacific
China
India
Japan
South Korea
Vietnam
Singapore
Australia
Rest of Asia Pacific
Middle East & Africa
Middle East
UAE
Egypt
Saudi Arabia
Qatar
Rest of Middle East
Africa
Nigeria
South Africa
Rest of Africa
Latin America
Brazil
Argentina
Colombia
Rest of Latin America
Request for Country Level Research Report: Country Level Customization Request
Available Customization
With the given market data, SNS Insider offers customization as per the company’s specific needs. The following customization options are available for the report:
Detailed Volume Analysis
Criss-Cross segment analysis (e.g. Product X Application)
Competitive Product Benchmarking
Geographic Analysis
Additional countries in any of the regions
Customized Data Representation
Detailed analysis and profiling of additional market players
The Glutaraldehyde Market size was valued at USD 701.3 million in 2023. It is estimated to hit USD 1039.1 million by 2032 and grow at a CAGR of 4.5% over the forecast period of 2024-2032.
The Slip Additives Market size was USD 276.94 million in 2023 and is expected to reach USD 402.20 million by 2032 and grow at a CAGR of 4.23% over the forecast period of 2024-2032.
Nitrogenous Fertilizer Market size was USD 63.55 Billion in 2023 and is expected to reach USD 105.36 Billion by 2032, growing at a CAGR of 5.78% from 2024-2032.
Enzyme Substrates Market Size was valued at USD 14.3 Billion in 2023 and is expected to reach USD 26.1 Billion by 2032 and grow at a CAGR of 6.9% over the forecast period 2024-2032.
The Foam Glass Market Size was valued at USD 2.0 billion in 2023 and is expected to reach USD 3.3 billion by 2032 and grow at a CAGR of 5.6% over the forecast period 2024-2032.
The Water Treatment Polymers Market Size was USD 42.99 Billion in 2023 and will reach USD 76.09 Billion by 2032 and grow at a CAGR of 6.55% by 2024-2032.

Hi! Click one of our member below to chat on Phone
© 2025 All Rights Reserved by SNS Insider Pvt Ltd


