To get more information on Industrial Display Market- Request Free Sample Report
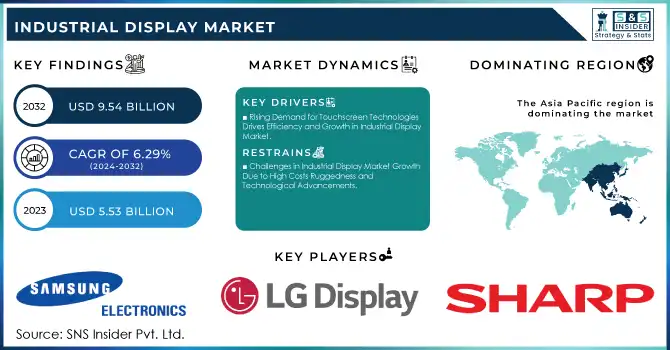
The Industrial Display Market Size was valued at USD 5.53 Billion in 2023 and is expected to reach USD 9.54 Billion by 2032 and grow at a CAGR of 6.29% over the forecast period 2024-2032.
The increase in operational efficiency and real-time decision-making has played a substantial role in edging up the Industrial Display Market. With the need for fast-paced yet simplified operations across industrial sectors, the demand for high-performance displays that perform various tasks and offer clear visibility is on the rise. Usage of industrial displays in control rooms, command centers, remote monitoring, and other applications are integrated due to the increasing digital transformation in many sectors such as automotive, aerospace, and logistics. In addition, an increase in the installation of automation systems and ongoing innovations in touch screen technologies get hold of a well-packed growth into the market as these displays become more interactive, intuitive, and integrated with new digital tools. Touchscreen technology adoption in 2023 grew 15% from the previous year, breaking the 50% of the market share threshold for the first time, and Industrial displays in Control Rooms & command centers grew 11%. Installation of automation systems with industrial displays increased by 13% and major demand increases of 10% were noted in rugged, weather-resistant displays, especially in mining, oil & gas, and power generation. Solutions such as smart display solutions for worker safety and productivity, which adapted 9%, while interactive displays for real-time decision-making went up by 12%.
Increasing focus on worker safety and productivity of the equipment
As manufacturers embrace the Industrial Internet of Things (IIoT) and the related network of Industry 4.0 technologies, they are implementing smart display to provide manufacturers with immediate access to relevant information to avoid equipment mishaps and minimize downtime. Vibration-proof displays have been witnessed during the Global pandemic, owing to various industries operating in harsh environments such as mining, oil & gas, and power generation. The mentioned factors coupled with the increasing efforts for sustainability, and energy-efficient display technologies, act as the catalysts for the growth of the industrial display market. The demand for vibration-proof industrial displays increased by 14%, particularly in mining, oil & gas, and power generation. Smart display systems incorporating IIoT and Industry 4.0 technologies increased by 16%, allowing for better and immediate access to data about equipment maintenance. For energy-efficient displays, usage was up 12%, as more organizations focused on sustainability, and smart displays for operational efficiency to improve worker safety and productivity rose 11%.
KEY DRIVERS:
Rising Demand for Touchscreen Technologies Drives Efficiency and Growth in Industrial Display Market
One of the major factors driving the growth of the Industrial Display Market is the increasing demand for touchscreen and interactive display technologies in industrial applications. User-friendly interfaces are facilitated by touchscreen displays as they enable operators to directly interact with machines and systems. Improving operational efficiency across systems, especially in sectors such as healthcare, automotive manufacturing, and logistics, where detailed inputs need to be processed at speed accurately and real-time monitoring data is crucial. Touchscreen technology continues to advance, leading to increasingly responsive, ruggedized displays that can withstand industrial operating conditions that involve dust, humidity, and/or extreme temperatures. The need for easy and simple interactions in industrial systems led to a rise of 20% in user-friendly touchscreen interface demands in 2023.
On the healthcare side, touchscreen displays for medical equipment and monitoring systems jumped 15%, and new data processing methods opened up real-time data processing capabilities. Vision to do on the automotive manufacturing part, where the touchscreen and interactive displays for the production line came to about 17% of precision and speed. Logistics saw a 13% increase in the use of interactive displays for warehouse automation, which improved inventory tracking and operational efficiency. Such trends reveal the increasing dependence on touchscreen technologies in the major industrial sectors. Interactive displays enable rapid access to key functions with minimal manual input, which is a major advantage in industrial workflow, so companies willing to modernize their control systems and maximize productivity can be drawn to such solution investment.
Sustainability Drives Growth in Industrial Display Market with Energy Efficient OLED and E Paper Technologies
The demand for advanced industrial displays is also being influenced by the transition to sustainable and energy-efficient solutions. Encouraged energy-efficient display technologies like OLED and e-paper are getting more popular getting more companies to want to reduce the energy consumption and cost of operation. Since these display types use less power than conventional LCD and LED displays, they can be ideal in any application where a display must be on in the background, or in remote locations. Moreover, the demand for eco-clean components and materials in industrial equipment is rising, resulting in displays that are less contributing to the environmental burden, in addition to efficient operating displays. These demands are coupled with wider industry plans for lowering carbon footprints and optimizing resource use, further underlining the position of energy-efficient displays in underpinning the industrial display market growth. Such an emphasis on sustainable tech is likely to encourage long-term investments in display technology advancements. The widespread interest in cutting down on energy consumption in complicated and sophisticated devices accelerated the adoption of energy-efficient OLED and e-paper displays by 18 % in 2023 which uses up to 40% less energy than a traditional LCD and LED displays, which makes them suitable for continuous or remote operation. Sales of eco-clean components, which help industrial facilities operate more sustainably, grew by 16%. Moreover, carbon footprint reduction industries have been increasingly integrated with energy-efficient displays, showing a 14% increase in this area, which reflects the trend of sustainability in the industrial display market.
RESTRAIN:
Challenges in Industrial Display Market Growth Due to High Costs Ruggedness and Technological Advancements
The high cost of various advanced display technologies, such as OLED, e-paper, etc. plays a vital role as a restraining factor for the Industrial Display Market, as the deployment of these technologies is extremely costly which limits their adoption, especially in the small and mid-sized enterprises segment. While offering perks like reduced energy usage and superb longevity, these displays also cost more than traditional LCDs and LEDs. However, the upfront cost is a major obstacle to low-budget companies putting these advanced techs to widespread use. One of the biggest challenges in the market is the longevity and reliability of displays in industrial temperature range (ITR) environments. Industrial displays deployed in industries like mining, oil, gas, and manufacturing are often subjected to very high temperatures, dust, vibration, moisture, etc. The display should still function in such conditions, and this scenario necessitates constant technological advancement in the display design & materials. The need for increased product ruggedness - over and above existing ruggedness levels - has resulted in continuous pressure on manufacturers to do more while keeping costs at a manageable level, which is a difficult proposition due to the technical challenges involved.
BY TYPE
The Industrial Display Market was led by Panel-Mount Monitors, which represented 30% of the market share in 2023, mainly due to their versatility and broad suitability with a variety of industrial applications. Industrial monitors are more rigid and can be embedded in any machine, control panel, and other industrial equipment and are often developed to offer a solid and stable unit. Essential in pressing environments with limited physical space, and where supervision must be stable (manufacturing plants, process control center), they deliver a clean, reliable interface for operators. Also, since panel-mount screens are frequently manufactured to endure tough surroundings, that is, exposure to dirt, moisture, and resonance, they are often preferred inside industries like manufacturing plants, energy, and shipping and delivery.
Open Frame Monitors is likely to grow with the fastest CAGR during the forecast period from 2024 to 2032, which can be attributed to its custom-tailored and flexible design. Open frame monitors are more flexible and allow manufacturers and industrial users greater versatility and more options to integrate them into their unique set-ups, housings, or equipment that require a specific display need than fully enclosed monitors do. This is especially advantageous for industries that provide bespoke machinery or those that need constant updates and changes in their equipment. Moreover, the need for open-frame monitors will grow rapidly in the upcoming years as different industries are adopting modular and flexible systems to keep pace with the technology.
BY APPLICATION
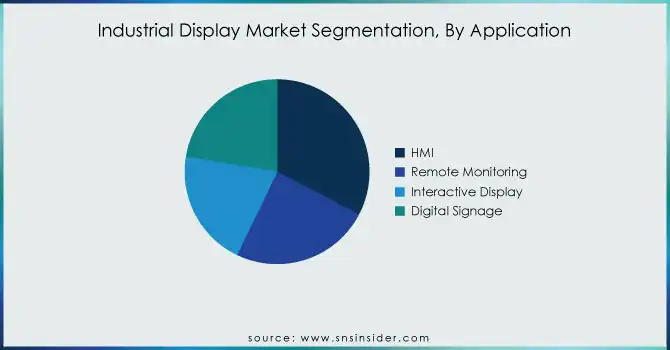
The Industrial Display Market is dominated by Human-Machine Interface (HMI) with a share of 32% in 2023, as it plays an important role in modern industrial settings. HMI systems are crucial for operators to monitor, control, and interact with machinery and processes, ensuring efficiency and safety. With the advent of automation and digitalization, industries have benefitted from the intuitive, real-time information HMI displays provide to users dealing with the complexity of discrete and continuous processes that are prevalent in sectors like manufacturing, energy, and chemicals. Their capability of making machines talk simply, conduct more work, and be more controlled has led them to be adopted widely and ensure that they continued to lead in their market share.
The Interactive Displays will experience the fastest CAGR growth during the forecast period of 2024-2032. This will continue to grow due to the rising need for intuitive and user-friendly interfaces in industrial applications. Interactive touchscreen displays are effective at replacing traditional displays because they enable touch- and gesture-based control, providing operators with increased flexibility and engagement. With the movement of industries toward smart factories and IIoT-based working environments, intuitive information access and control is a top priority, and interactive displays have a big role to play in future success.
BY TECHNOLOGY
In 2023, LCD dominated the Industrial Display Market, with a share of 38%, primarily due to broad affordability, versatility, and reliability in the industrial sector. Thanks to its maturity, LCD technology provides decent display quality, durability, and price, making it a great option for budget-limited and large-scale display installations. In addition, LCDs are versatile and can be designed for an extensive variety of environments, including rough industries, where both industrial durability and industrial performance are essential. This has also made them more popular, ensuring that LCDs have become the top display technology in manufacturing, control rooms, and other industrial applications, due mainly to their good visibility even in high light conditions.
In contrast, E-Paper Displays are projected to register the fastest CAGR from 2024 to 2032, due to their unique energy-efficient properties and incorporation in certain industrial applications. E-paper displays draw very little power (note the second screenshot) compared to LCDs, which is useful and even necessary for applications that would be displayed continuously or where there is prohibitive access to mains power. E-paper, on the other hand, has high visibility indoors and outdoors due to reflectance that makes it suitable in very bright places, even if the light comes directly exactly to the displays 7. With the industries moving towards sustainable and low-power options, the market for e-paper displays is expected to be on the rise, driving their rapid growth over the forecast timeline.
BY END USE
In 2023, Manufacturing held the largest share 35% of the Industrial Display Market, as industrial displays are extensively adopted for monitoring, control, and automation of manufacturing facilities. Hence, these displays play an important role in HMI Applications, Process Control, and Real-Time data visualization, which in turn minimize the total amount of production time and ensure that the manufacturing industry runs smoothly. Manufacturing displays aid in visualizing the status of your machine, and metrics needed to manage production and facilitate decision-making to prevent any form of idle loss scenarios on the floor. Coming to their general application and demand in manufacturing, solutions such as these are always going to be in demand in manufacturing, as businesses aspire to enhance productivity and quality control as well as embrace Industry 4.0 philosophies.
The energy & Power segment is anticipated to be the fastest CAGR growing segment for the forecast period 2024 to 2032, owing to the growing requirement of the sector for reliable and durable display systems with energy-efficient displays. As the energy and power industry pivots to renewable energy sources, smart grids, and distributed power generation, it needs displays capable of enduring harsh environmental conditions and providing real-time monitoring for critical systems. This sector will also be interested in e-paper and such low-power display technologies to minimize energy as well as maintaining an outdoor and remote application where visibility is a critical aspect. Hence, the energy and power sector will account for a major chunk of the demand for advanced industrial displays, thereby propelling rapid growth.
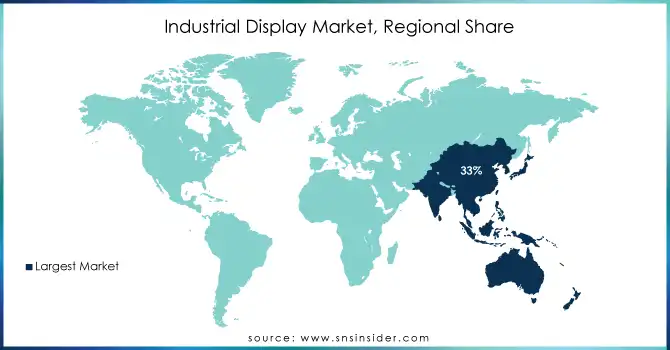
In 2023, Asia Pacific had the highest market share 33% in the Industrial Display Market due to further industrialization of various industries, including utilities and OEMs, in China, Japan, South Korea, and India. They turned into world manufacturing centers, with huge investments in electronics, automotive, and heavy machinery. Such as in the case, China has "Made in China 2025" and India has "Made in India" which mobilizes local industry towards digitalization and automation have increases industrial display demand. The regional consumer electronics and automotive manufacturing giants that enabled Japan and South Korea to dominate bitter battles over global economies (Toyota, Sony, Samsung) are all entirely dependent on the use of industrial displays to run their factories and their finessed production and monitoring processes. The expansion of smart factories and Industry 4.0 in this region is also fuelling demand for advanced display solutions.
North America is expected to grow at the fastest rate CAGR from 2024 to 2032, attributed to the growing transition toward automation and digitalization in a variety of industries such as energy, healthcare, and manufacturing. Smart manufacturing practices and investment in the Industrial Internet of Things (IIoT) in the United States are boosting the demand for displays that provide data visualization and visualizing real-time data. In the U.S., the energy sector is seeing major developments in smart grids and renewable energy projects, both of which depend on robust, energy-efficient displays that can perform monitoring functions. Furthermore, growing awareness regarding worker safety and operational proficiency, coupled with increasing adoption of advanced HMI systems, video walls, and interactive displays across various industries in North America is slated to accelerate market expansion in the coming years.
Get Customized Report as per Your Business Requirement - Enquiry Now
Some of the major players in the Industrial Display Market are:
Samsung Electronics (LCD Industrial Panels, OLED Displays)
LG Display (TFT-LCD Displays, IPS Monitors)
Sharp Corporation (Industrial TFT Displays, LCD Modules)
AU Optronics (AMOLED Displays, LCD Industrial Screens)
Panasonic Corporation (Rugged LCD Displays, Industrial Touch Screens)
BOE Technology Group (Ultra HD Displays, Flexible OLED Panels)
Mitsubishi Electric (TFT-LCD Modules, Industrial Touch Panels)
Advantech Co., Ltd. (Industrial Panel PCs, LCD Monitor Panels)
Planar Systems (Open-Frame Monitors, Industrial Video Walls)
Siemens AG (HMI Panels, Industrial Operator Interfaces)
Rockwell Automation (Graphic Terminals, Industrial Monitors)
Winmate Inc. (Rugged Displays, Industrial Panel PCs)
Kyocera Corporation (TFT-LCD Modules, Medical Displays)
Omron Corporation (Touchscreen HMIs, Industrial LCD Screens)
Eizo Corporation (Ruggedized Monitors, LCD Display Panels)
Crystal Display Systems (Custom LCD Displays, Rugged Monitors)
HannStar Display (TFT LCD Modules, Display Panels)
Phoenix Contact (HMI Display Solutions, Industrial Display Panels)
Innolux Corporation (Touch Display Modules, TFT-LCD Panels)
Schneider Electric (Industrial HMI, Operator Terminals)
3M
Corning Inc.
DuPont
Merck Group
BASF SE
Dow Inc.
Saint-Gobain
Asahi Glass Co. (AGC Inc.)
Nitto Denko Corporation
Toray Industries
Sony and Siemens will launch a VR headset by December 2024, tailored for Siemens' industrial metaverse focus. Currently integrated with Siemens' NX engineering platform, it will expand to other products, per a senior executive.
LG Display has unveiled its 27-inch 480Hz QHD Gaming OLED display, set to debut at CES 2024, marking a new era in ultra-high refresh rate OLED technology.
Report Attributes | Details |
---|---|
Market Size in 2023 | USD 5.53 Billion |
Market Size by 2032 | USD 9.54 Billion |
CAGR | CAGR of 6.29% From 2024 to 2032 |
Base Year | 2023 |
Forecast Period | 2024-2032 |
Historical Data | 2020-2022 |
Report Scope & Coverage | Market Size, Segments Analysis, Competitive Landscape, Regional Analysis, DROC & SWOT Analysis, Forecast Outlook |
Key Segments | • by Type (Rugged Displays, Open Frame Monitors, Panel-Mount Monitors, Marine Displays, Video Walls) • by Application (HMI, Remote Monitoring, Interactive Display, Digital Signage) • by Technology (LCD, LED, OLED, E-Paper Display) • by End Use (Manufacturing, Mining & Metals, Chemical, Oil, and Gas, Energy & Power, Others) |
Regional Analysis/Coverage | North America (US, Canada, Mexico), Europe (Eastern Europe [Poland, Romania, Hungary, Turkey, Rest of Eastern Europe] Western Europe] Germany, France, UK, Italy, Spain, Netherlands, Switzerland, Austria, Rest of Western Europe]), Asia Pacific (China, India, Japan, South Korea, Vietnam, Singapore, Australia, Rest of Asia Pacific), Middle East & Africa (Middle East [UAE, Egypt, Saudi Arabia, Qatar, Rest of Middle East], Africa [Nigeria, South Africa, Rest of Africa], Latin America (Brazil, Argentina, Colombia, Rest of Latin America) |
Company Profiles | Samsung Electronics, LG Display, Sharp Corporation, AU Optronics, Panasonic Corporation, BOE Technology Group, Mitsubishi Electric, Advantech Co., Ltd., Planar Systems, Siemens AG, Rockwell Automation, Winmate Inc., Kyocera Corporation, Omron Corporation, Eizo Corporation, Crystal Display Systems, HannStar Display, Phoenix Contact, Innolux Corporation, Schneider Electric. |
Key Drivers | • Rising Demand for Touchscreen Technologies Drives Efficiency and Growth in Industrial Display Market • Sustainability Drives Growth in Industrial Display Market with Energy Efficient OLED and E Paper Technologies |
Restraints | • Challenges in Industrial Display Market Growth Due to High Costs Ruggedness and Technological Advancements |
Ans: The Industrial Display Market is expected to grow at a CAGR of 6.29% during 2024-2032.
Ans: Industrial Display Market size was USD 5.53 billion in 2023 and is expected to Reach USD 9.54 billion by 2032.
Ans: The major growth factor of the Industrial Display Market is the increasing adoption of automation and digitalization across industries for enhanced monitoring and operational efficiency.
Ans: The HMI segment dominated the Industrial Display Market in 2023.
Ans: Asia Pacific dominated the Industrial Display Market in 2023.
Table of Contents
1. Introduction
1.1 Market Definition
1.2 Scope (Inclusion and Exclusions)
1.3 Research Assumptions
2. Executive Summary
2.1 Market Overview
2.2 Regional Synopsis
2.3 Competitive Summary
3. Research Methodology
3.1 Top-Down Approach
3.2 Bottom-up Approach
3.3. Data Validation
3.4 Primary Interviews
4. Market Dynamics Impact Analysis
4.1 Market Driving Factors Analysis
4.1.1 Drivers
4.1.2 Restraints
4.1.3 Opportunities
4.1.4 Challenges
4.2 PESTLE Analysis
4.3 Porter’s Five Forces Model
5. Statistical Insights and Trends Reporting
5.1 Industrial Display Adoption Rate (2023)
5.2 Industrial Display Energy Efficiency Metrics (2023)
5.3 Industrial Display Installation and Maintenance Costs
5.4 Industrial Display Technological Advancements
5.5 Industrial Display Supply Chain Metrics
6. Competitive Landscape
6.1 List of Major Companies, By Region
6.2 Market Share Analysis, By Region
6.3 Product Benchmarking
6.3.1 Product specifications and features
6.3.2 Pricing
6.4 Strategic Initiatives
6.4.1 Marketing and promotional activities
6.4.2 Distribution and Supply Chain Strategies
6.4.3 Expansion plans and new product launches
6.4.4 Strategic partnerships and collaborations
6.5 Technological Advancements
6.6 Market Positioning and Branding
7. Industrial Display Market Segmentation, by Type
7.1 Chapter Overview
7.2 Rugged Displays
7.2.1 Rugged Displays Market Trends Analysis (2020-2032)
7.2.2 Rugged Displays Market Size Estimates and Forecasts to 2032 (USD Billion)
7.3 Open Frame Monitors
7.3.1 Open Frame Monitors Market Trends Analysis (2020-2032)
7.3.2 Open Frame Monitors Market Size Estimates and Forecasts to 2032 (USD Billion)
7.4 Panel-Mount Monitors
7.4.1 Panel-Mount Monitors Market Trends Analysis (2020-2032)
7.4.2 Panel-Mount Monitors Market Size Estimates and Forecasts to 2032 (USD Billion)
7.5 Marine Displays
7.5.1 Marine Displays Market Trends Analysis (2020-2032)
7.5.2 Marine Displays Market Size Estimates and Forecasts to 2032 (USD Billion)
7.6 Video Walls
7.6.1 Video Walls Market Trends Analysis (2020-2032)
7.6.2 Video Walls Market Size Estimates and Forecasts to 2032 (USD Billion)
8. Industrial Display Market Segmentation, By Application
8.1 Chapter Overview
8.2 HMI
8.2.1 HMI Market Trends Analysis (2020-2032)
8.2.2 HMI Market Size Estimates and Forecasts to 2032 (USD Billion)
8.3 Remote Monitoring
8.3.1 Remote Monitoring Market Trends Analysis (2020-2032)
8.3.2 Remote Monitoring Market Size Estimates and Forecasts to 2032 (USD Billion)
8.4 Interactive Display
8.4.1 Interactive Display Market Trends Analysis (2020-2032)
8.4.2 Interactive Display Market Size Estimates and Forecasts to 2032 (USD Billion)
8.5 Digital Signage
8.5.1 Digital Signage Market Trends Analysis (2020-2032)
8.5.2 Digital Signage Market Size Estimates and Forecasts to 2032 (USD Billion)
9. Industrial Display Market Segmentation, By Technology
9.1 Chapter Overview
9.2 LCD
9.2.1 LCD Market Trends Analysis (2020-2032)
9.2.2 LCD Market Size Estimates and Forecasts to 2032 (USD Billion)
9.3 LED
9.3.1 LED Market Trends Analysis (2020-2032)
9.3.2 LED Market Size Estimates and Forecasts to 2032 (USD Billion)
9.4 OLED
9.4.1 OLED Market Trends Analysis (2020-2032)
9.4.2 OLED Market Size Estimates and Forecasts to 2032 (USD Billion)
9.5 E-Paper Display
9.5.1 E-Paper Display Market Trends Analysis (2020-2032)
9.5.2 E-Paper Display Market Size Estimates and Forecasts to 2032 (USD Billion)
10. Industrial Display Market Segmentation, by End Use
10.1 Chapter Overview
10.2 Manufacturing
10.2.1 Manufacturing Market Trends Analysis (2020-2032)
10.2.2 Manufacturing Market Size Estimates and Forecasts to 2032 (USD Billion)
10.3 Mining & Metals
10.3.1 Mining & Metals Market Trends Analysis (2020-2032)
10.3.2 Mining & Metals Market Size Estimates and Forecasts to 2032 (USD Billion)
10.4 Chemical, Oil, and Gas
10.4.1 Chemical, Oil, and Gas Market Trends Analysis (2020-2032)
10.4.2 Chemical, Oil, and Gas Market Size Estimates and Forecasts to 2032 (USD Billion)
10.5 Energy & Power
10.5.1 Energy & Power Market Trends Analysis (2020-2032)
10.5.2 Energy & Power Market Size Estimates and Forecasts to 2032 (USD Billion)
10.6 Others
10.6.1 Others Market Trends Analysis (2020-2032)
10.6.2 Others Market Size Estimates and Forecasts to 2032 (USD Billion)
11. Regional Analysis
11.1 Chapter Overview
11.2 North America
11.2.1 Trends Analysis
11.2.2 North America Industrial Display Market Estimates and Forecasts, by Country (2020-2032) (USD Billion)
11.2.3 North America Industrial Display Market Estimates and Forecasts, by Type (2020-2032) (USD Billion)
11.2.4 North America Industrial Display Market Estimates and Forecasts, By Application (2020-2032) (USD Billion)
11.2.5 North America Industrial Display Market Estimates and Forecasts, By Technology (2020-2032) (USD Billion)
11.2.6 North America Industrial Display Market Estimates and Forecasts, by End Use (2020-2032) (USD Billion)
11.2.7 USA
11.2.7.1 USA Industrial Display Market Estimates and Forecasts, by Type (2020-2032) (USD Billion)
11.2.7.2 USA Industrial Display Market Estimates and Forecasts, By Application (2020-2032) (USD Billion)
11.2.7.3 USA Industrial Display Market Estimates and Forecasts, By Technology (2020-2032) (USD Billion)
11.2.7.4 USA Industrial Display Market Estimates and Forecasts, by End Use (2020-2032) (USD Billion)
11.2.8 Canada
11.2.8.1 Canada Industrial Display Market Estimates and Forecasts, by Type (2020-2032) (USD Billion)
11.2.8.2 Canada Industrial Display Market Estimates and Forecasts, By Application (2020-2032) (USD Billion)
11.2.8.3 Canada Industrial Display Market Estimates and Forecasts, By Technology (2020-2032) (USD Billion)
11.2.8.4 Canada Industrial Display Market Estimates and Forecasts, by End Use (2020-2032) (USD Billion)
11.2.9 Mexico
11.2.9.1 Mexico Industrial Display Market Estimates and Forecasts, by Type (2020-2032) (USD Billion)
11.2.9.2 Mexico Industrial Display Market Estimates and Forecasts, By Application (2020-2032) (USD Billion)
11.2.9.3 Mexico Industrial Display Market Estimates and Forecasts, By Technology (2020-2032) (USD Billion)
11.2.9.4 Mexico Industrial Display Market Estimates and Forecasts, by End Use (2020-2032) (USD Billion)
11.3 Europe
11.3.1 Eastern Europe
11.3.1.1 Trends Analysis
11.3.1.2 Eastern Europe Industrial Display Market Estimates and Forecasts, by Country (2020-2032) (USD Billion)
11.3.1.3 Eastern Europe Industrial Display Market Estimates and Forecasts, by Type (2020-2032) (USD Billion)
11.3.1.4 Eastern Europe Industrial Display Market Estimates and Forecasts, By Application (2020-2032) (USD Billion)
11.3.1.5 Eastern Europe Industrial Display Market Estimates and Forecasts, By Technology (2020-2032) (USD Billion)
11.3.1.6 Eastern Europe Industrial Display Market Estimates and Forecasts, by End Use (2020-2032) (USD Billion)
11.3.1.7 Poland
11.3.1.7.1 Poland Industrial Display Market Estimates and Forecasts, by Type (2020-2032) (USD Billion)
11.3.1.7.2 Poland Industrial Display Market Estimates and Forecasts, By Application (2020-2032) (USD Billion)
11.3.1.7.3 Poland Industrial Display Market Estimates and Forecasts, By Technology (2020-2032) (USD Billion)
11.3.1.7.4 Poland Industrial Display Market Estimates and Forecasts, by End Use (2020-2032) (USD Billion)
11.3.1.8 Romania
11.3.1.8.1 Romania Industrial Display Market Estimates and Forecasts, by Type (2020-2032) (USD Billion)
11.3.1.8.2 Romania Industrial Display Market Estimates and Forecasts, By Application (2020-2032) (USD Billion)
11.3.1.8.3 Romania Industrial Display Market Estimates and Forecasts, By Technology (2020-2032) (USD Billion)
11.3.1.8.4 Romania Industrial Display Market Estimates and Forecasts, by End Use (2020-2032) (USD Billion)
11.3.1.9 Hungary
11.3.1.9.1 Hungary Industrial Display Market Estimates and Forecasts, by Type (2020-2032) (USD Billion)
11.3.1.9.2 Hungary Industrial Display Market Estimates and Forecasts, By Application (2020-2032) (USD Billion)
11.3.1.9.3 Hungary Industrial Display Market Estimates and Forecasts, By Technology (2020-2032) (USD Billion)
11.3.1.9.4 Hungary Industrial Display Market Estimates and Forecasts, by End Use (2020-2032) (USD Billion)
11.3.1.10 turkey
11.3.1.10.1 Turkey Industrial Display Market Estimates and Forecasts, by Type (2020-2032) (USD Billion)
11.3.1.10.2 Turkey Industrial Display Market Estimates and Forecasts, By Application (2020-2032) (USD Billion)
11.3.1.10.3 Turkey Industrial Display Market Estimates and Forecasts, By Technology (2020-2032) (USD Billion)
11.3.1.10.4 Turkey Industrial Display Market Estimates and Forecasts, by End Use (2020-2032) (USD Billion)
11.3.1.11 Rest of Eastern Europe
11.3.1.11.1 Rest of Eastern Europe Industrial Display Market Estimates and Forecasts, by Type (2020-2032) (USD Billion)
11.3.1.11.2 Rest of Eastern Europe Industrial Display Market Estimates and Forecasts, By Application (2020-2032) (USD Billion)
11.3.1.11.3 Rest of Eastern Europe Industrial Display Market Estimates and Forecasts, By Technology (2020-2032) (USD Billion)
11.3.1.11.4 Rest of Eastern Europe Industrial Display Market Estimates and Forecasts, by End Use (2020-2032) (USD Billion)
11.3.2 Western Europe
11.3.2.1 Trends Analysis
11.3.2.2 Western Europe Industrial Display Market Estimates and Forecasts, by Country (2020-2032) (USD Billion)
11.3.2.3 Western Europe Industrial Display Market Estimates and Forecasts, by Type (2020-2032) (USD Billion)
11.3.2.4 Western Europe Industrial Display Market Estimates and Forecasts, By Application (2020-2032) (USD Billion)
11.3.2.5 Western Europe Industrial Display Market Estimates and Forecasts, By Technology (2020-2032) (USD Billion)
11.3.2.6 Western Europe Industrial Display Market Estimates and Forecasts, by End Use (2020-2032) (USD Billion)
11.3.2.7 Germany
11.3.2.7.1 Germany Industrial Display Market Estimates and Forecasts, by Type (2020-2032) (USD Billion)
11.3.2.7.2 Germany Industrial Display Market Estimates and Forecasts, By Application (2020-2032) (USD Billion)
11.3.2.7.3 Germany Industrial Display Market Estimates and Forecasts, By Technology (2020-2032) (USD Billion)
11.3.2.7.4 Germany Industrial Display Market Estimates and Forecasts, by End Use (2020-2032) (USD Billion)
11.3.2.8 France
11.3.2.8.1 France Industrial Display Market Estimates and Forecasts, by Type (2020-2032) (USD Billion)
11.3.2.8.2 France Industrial Display Market Estimates and Forecasts, By Application (2020-2032) (USD Billion)
11.3.2.8.3 France Industrial Display Market Estimates and Forecasts, By Technology (2020-2032) (USD Billion)
11.3.2.8.4 France Industrial Display Market Estimates and Forecasts, by End Use (2020-2032) (USD Billion)
11.3.2.9 UK
11.3.2.9.1 UK Industrial Display Market Estimates and Forecasts, by Type (2020-2032) (USD Billion)
11.3.2.9.2 UK Industrial Display Market Estimates and Forecasts, By Application (2020-2032) (USD Billion)
11.3.2.9.3 UK Industrial Display Market Estimates and Forecasts, By Technology (2020-2032) (USD Billion)
11.3.2.9.4 UK Industrial Display Market Estimates and Forecasts, by End Use (2020-2032) (USD Billion)
11.3.2.10 Italy
11.3.2.10.1 Italy Industrial Display Market Estimates and Forecasts, by Type (2020-2032) (USD Billion)
11.3.2.10.2 Italy Industrial Display Market Estimates and Forecasts, By Application (2020-2032) (USD Billion)
11.3.2.10.3 Italy Industrial Display Market Estimates and Forecasts, By Technology (2020-2032) (USD Billion)
11.3.2.10.4 Italy Industrial Display Market Estimates and Forecasts, by End Use (2020-2032) (USD Billion)
11.3.2.11 Spain
11.3.2.11.1 Spain Industrial Display Market Estimates and Forecasts, by Type (2020-2032) (USD Billion)
11.3.2.11.2 Spain Industrial Display Market Estimates and Forecasts, By Application (2020-2032) (USD Billion)
11.3.2.11.3 Spain Industrial Display Market Estimates and Forecasts, By Technology (2020-2032) (USD Billion)
11.3.2.11.4 Spain Industrial Display Market Estimates and Forecasts, by End Use (2020-2032) (USD Billion)
11.3.2.12 Netherlands
11.3.2.12.1 Netherlands Industrial Display Market Estimates and Forecasts, by Type (2020-2032) (USD Billion)
11.3.2.12.2 Netherlands Industrial Display Market Estimates and Forecasts, By Application (2020-2032) (USD Billion)
11.3.2.12.3 Netherlands Industrial Display Market Estimates and Forecasts, By Technology (2020-2032) (USD Billion)
11.3.2.12.4 Netherlands Industrial Display Market Estimates and Forecasts, by End Use (2020-2032) (USD Billion)
11.3.2.13 Switzerland
11.3.2.13.1 Switzerland Industrial Display Market Estimates and Forecasts, by Type (2020-2032) (USD Billion)
11.3.2.13.2 Switzerland Industrial Display Market Estimates and Forecasts, By Application (2020-2032) (USD Billion)
11.3.2.13.3 Switzerland Industrial Display Market Estimates and Forecasts, By Technology (2020-2032) (USD Billion)
11.3.2.13.4 Switzerland Industrial Display Market Estimates and Forecasts, by End Use (2020-2032) (USD Billion)
11.3.2.14 Austria
11.3.2.14.1 Austria Industrial Display Market Estimates and Forecasts, by Type (2020-2032) (USD Billion)
11.3.2.14.2 Austria Industrial Display Market Estimates and Forecasts, By Application (2020-2032) (USD Billion)
11.3.2.14.3 Austria Industrial Display Market Estimates and Forecasts, By Technology (2020-2032) (USD Billion)
11.3.2.14.4 Austria Industrial Display Market Estimates and Forecasts, by End Use (2020-2032) (USD Billion)
11.3.2.15 Rest of Western Europe
11.3.2.15.1 Rest of Western Europe Industrial Display Market Estimates and Forecasts, by Type (2020-2032) (USD Billion)
11.3.2.15.2 Rest of Western Europe Industrial Display Market Estimates and Forecasts, By Application (2020-2032) (USD Billion)
11.3.2.15.3 Rest of Western Europe Industrial Display Market Estimates and Forecasts, By Technology (2020-2032) (USD Billion)
11.3.2.15.4 Rest of Western Europe Industrial Display Market Estimates and Forecasts, by End Use (2020-2032) (USD Billion)
11.4 Asia Pacific
11.4.1 Trends Analysis
11.4.2 Asia Pacific Industrial Display Market Estimates and Forecasts, by Country (2020-2032) (USD Billion)
11.4.3 Asia Pacific Industrial Display Market Estimates and Forecasts, by Type (2020-2032) (USD Billion)
11.4.4 Asia Pacific Industrial Display Market Estimates and Forecasts, By Application (2020-2032) (USD Billion)
11.4.5 Asia Pacific Industrial Display Market Estimates and Forecasts, By Technology (2020-2032) (USD Billion)
11.4.6 Asia Pacific Industrial Display Market Estimates and Forecasts, by End Use (2020-2032) (USD Billion)
11.4.7 China
11.4.7.1 China Industrial Display Market Estimates and Forecasts, by Type (2020-2032) (USD Billion)
11.4.7.2 China Industrial Display Market Estimates and Forecasts, By Application (2020-2032) (USD Billion)
11.4.7.3 China Industrial Display Market Estimates and Forecasts, By Technology (2020-2032) (USD Billion)
11.4.7.4 China Industrial Display Market Estimates and Forecasts, by End Use (2020-2032) (USD Billion)
11.4.8 India
11.4.8.1 India Industrial Display Market Estimates and Forecasts, by Type (2020-2032) (USD Billion)
11.4.8.2 India Industrial Display Market Estimates and Forecasts, By Application (2020-2032) (USD Billion)
11.4.8.3 India Industrial Display Market Estimates and Forecasts, By Technology (2020-2032) (USD Billion)
11.4.8.4 India Industrial Display Market Estimates and Forecasts, by End Use (2020-2032) (USD Billion)
11.4.9 Japan
11.4.9.1 Japan Industrial Display Market Estimates and Forecasts, by Type (2020-2032) (USD Billion)
11.4.9.2 Japan Industrial Display Market Estimates and Forecasts, By Application (2020-2032) (USD Billion)
11.4.9.3 Japan Industrial Display Market Estimates and Forecasts, By Technology (2020-2032) (USD Billion)
11.4.9.4 Japan Industrial Display Market Estimates and Forecasts, by End Use (2020-2032) (USD Billion)
11.4.10 South Korea
11.4.10.1 South Korea Industrial Display Market Estimates and Forecasts, by Type (2020-2032) (USD Billion)
11.4.10.2 South Korea Industrial Display Market Estimates and Forecasts, By Application (2020-2032) (USD Billion)
11.4.10.3 South Korea Industrial Display Market Estimates and Forecasts, By Technology (2020-2032) (USD Billion)
11.4.10.4 South Korea Industrial Display Market Estimates and Forecasts, by End Use (2020-2032) (USD Billion)
11.4.11 Vietnam
11.4.11.1 Vietnam Industrial Display Market Estimates and Forecasts, by Type (2020-2032) (USD Billion)
11.4.11.2 Vietnam Industrial Display Market Estimates and Forecasts, By Application (2020-2032) (USD Billion)
11.4.11.3 Vietnam Industrial Display Market Estimates and Forecasts, By Technology (2020-2032) (USD Billion)
11.4.11.4 Vietnam Industrial Display Market Estimates and Forecasts, by End Use (2020-2032) (USD Billion)
11.4.12 Singapore
11.4.12.1 Singapore Industrial Display Market Estimates and Forecasts, by Type (2020-2032) (USD Billion)
11.4.12.2 Singapore Industrial Display Market Estimates and Forecasts, By Application (2020-2032) (USD Billion)
11.4.12.3 Singapore Industrial Display Market Estimates and Forecasts, By Technology (2020-2032) (USD Billion)
11.4.12.4 Singapore Industrial Display Market Estimates and Forecasts, by End Use (2020-2032) (USD Billion)
11.4.13 Australia
11.4.13.1 Australia Industrial Display Market Estimates and Forecasts, by Type (2020-2032) (USD Billion)
11.4.13.2 Australia Industrial Display Market Estimates and Forecasts, By Application (2020-2032) (USD Billion)
11.4.13.3 Australia Industrial Display Market Estimates and Forecasts, By Technology (2020-2032) (USD Billion)
11.4.13.4 Australia Industrial Display Market Estimates and Forecasts, by End Use (2020-2032) (USD Billion)
11.4.14 Rest of Asia Pacific
11.4.14.1 Rest of Asia Pacific Industrial Display Market Estimates and Forecasts, by Type (2020-2032) (USD Billion)
11.4.14.2 Rest of Asia Pacific Industrial Display Market Estimates and Forecasts, By Application (2020-2032) (USD Billion)
11.4.14.3 Rest of Asia Pacific Industrial Display Market Estimates and Forecasts, By Technology (2020-2032) (USD Billion)
11.4.14.4 Rest of Asia Pacific Industrial Display Market Estimates and Forecasts, by End Use (2020-2032) (USD Billion)
11.5 Middle East and Africa
11.5.1 Middle East
11.5.1.1 Trends Analysis
11.5.1.2 Middle East Industrial Display Market Estimates and Forecasts, by Country (2020-2032) (USD Billion)
11.5.1.3 Middle East Industrial Display Market Estimates and Forecasts, by Type (2020-2032) (USD Billion)
11.5.1.4 Middle East Industrial Display Market Estimates and Forecasts, By Application (2020-2032) (USD Billion)
11.5.1.5 Middle East Industrial Display Market Estimates and Forecasts, By Technology (2020-2032) (USD Billion)
11.5.1.6 Middle East Industrial Display Market Estimates and Forecasts, by End Use (2020-2032) (USD Billion)
11.5.1.7 UAE
11.5.1.7.1 UAE Industrial Display Market Estimates and Forecasts, by Type (2020-2032) (USD Billion)
11.5.1.7.2 UAE Industrial Display Market Estimates and Forecasts, By Application (2020-2032) (USD Billion)
11.5.1.7.3 UAE Industrial Display Market Estimates and Forecasts, By Technology (2020-2032) (USD Billion)
11.5.1.7.4 UAE Industrial Display Market Estimates and Forecasts, by End Use (2020-2032) (USD Billion)
11.5.1.8 Egypt
11.5.1.8.1 Egypt Industrial Display Market Estimates and Forecasts, by Type (2020-2032) (USD Billion)
11.5.1.8.2 Egypt Industrial Display Market Estimates and Forecasts, By Application (2020-2032) (USD Billion)
11.5.1.8.3 Egypt Industrial Display Market Estimates and Forecasts, By Technology (2020-2032) (USD Billion)
11.5.1.8.4 Egypt Industrial Display Market Estimates and Forecasts, by End Use (2020-2032) (USD Billion)
11.5.1.9 Saudi Arabia
11.5.1.9.1 Saudi Arabia Industrial Display Market Estimates and Forecasts, by Type (2020-2032) (USD Billion)
11.5.1.9.2 Saudi Arabia Industrial Display Market Estimates and Forecasts, By Application (2020-2032) (USD Billion)
11.5.1.9.3 Saudi Arabia Industrial Display Market Estimates and Forecasts, By Technology (2020-2032) (USD Billion)
11.5.1.9.4 Saudi Arabia Industrial Display Market Estimates and Forecasts, by End Use (2020-2032) (USD Billion)
11.5.1.10 Qatar
11.5.1.10.1 Qatar Industrial Display Market Estimates and Forecasts, by Type (2020-2032) (USD Billion)
11.5.1.10.2 Qatar Industrial Display Market Estimates and Forecasts, By Application (2020-2032) (USD Billion)
11.5.1.10.3 Qatar Industrial Display Market Estimates and Forecasts, By Technology (2020-2032) (USD Billion)
11.5.1.10.4 Qatar Industrial Display Market Estimates and Forecasts, by End Use (2020-2032) (USD Billion)
11.5.1.11 Rest of Middle East
11.5.1.11.1 Rest of Middle East Industrial Display Market Estimates and Forecasts, by Type (2020-2032) (USD Billion)
11.5.1.11.2 Rest of Middle East Industrial Display Market Estimates and Forecasts, By Application (2020-2032) (USD Billion)
11.5.1.11.3 Rest of Middle East Industrial Display Market Estimates and Forecasts, By Technology (2020-2032) (USD Billion)
11.5.1.11.4 Rest of Middle East Industrial Display Market Estimates and Forecasts, by End Use (2020-2032) (USD Billion)
11.5.2 Africa
11.5.2.1 Trends Analysis
11.5.2.2 Africa Industrial Display Market Estimates and Forecasts, by Country (2020-2032) (USD Billion)
11.5.2.3 Africa Industrial Display Market Estimates and Forecasts, by Type (2020-2032) (USD Billion)
11.5.2.4 Africa Industrial Display Market Estimates and Forecasts, By Application (2020-2032) (USD Billion)
11.5.2.5 Africa Industrial Display Market Estimates and Forecasts, By Technology (2020-2032) (USD Billion)
11.5.2.6 Africa Industrial Display Market Estimates and Forecasts, by End Use (2020-2032) (USD Billion)
11.5.2.7 South Africa
11.5.2.7.1 South Africa Industrial Display Market Estimates and Forecasts, by Type (2020-2032) (USD Billion)
11.5.2.7.2 South Africa Industrial Display Market Estimates and Forecasts, By Application (2020-2032) (USD Billion)
11.5.2.7.3 South Africa Industrial Display Market Estimates and Forecasts, By Technology (2020-2032) (USD Billion)
11.5.2.7.4 South Africa Industrial Display Market Estimates and Forecasts, by End Use (2020-2032) (USD Billion)
11.5.2.8 Nigeria
11.5.2.8.1 Nigeria Industrial Display Market Estimates and Forecasts, by Type (2020-2032) (USD Billion)
11.5.2.8.2 Nigeria Industrial Display Market Estimates and Forecasts, By Application (2020-2032) (USD Billion)
11.5.2.8.3 Nigeria Industrial Display Market Estimates and Forecasts, By Technology (2020-2032) (USD Billion)
11.5.2.8.4 Nigeria Industrial Display Market Estimates and Forecasts, by End Use (2020-2032) (USD Billion)
11.5.2.9 Rest of Africa
11.5.2.9.1 Rest of Africa Industrial Display Market Estimates and Forecasts, by Type (2020-2032) (USD Billion)
11.5.2.9.2 Rest of Africa Industrial Display Market Estimates and Forecasts, By Application (2020-2032) (USD Billion)
11.5.2.9.3 Rest of Africa Industrial Display Market Estimates and Forecasts, By Technology (2020-2032) (USD Billion)
11.5.2.9.4 Rest of Africa Industrial Display Market Estimates and Forecasts, by End Use (2020-2032) (USD Billion)
11.6 Latin America
11.6.1 Trends Analysis
11.6.2 Latin America Industrial Display Market Estimates and Forecasts, by Country (2020-2032) (USD Billion)
11.6.3 Latin America Industrial Display Market Estimates and Forecasts, by Type (2020-2032) (USD Billion)
11.6.4 Latin America Industrial Display Market Estimates and Forecasts, By Application (2020-2032) (USD Billion)
11.6.5 Latin America Industrial Display Market Estimates and Forecasts, By Technology (2020-2032) (USD Billion)
11.6.6 Latin America Industrial Display Market Estimates and Forecasts, by End Use (2020-2032) (USD Billion)
11.6.7 Brazil
11.6.7.1 Brazil Industrial Display Market Estimates and Forecasts, by Type (2020-2032) (USD Billion)
11.6.7.2 Brazil Industrial Display Market Estimates and Forecasts, By Application (2020-2032) (USD Billion)
11.6.7.3 Brazil Industrial Display Market Estimates and Forecasts, By Technology (2020-2032) (USD Billion)
11.6.7.4 Brazil Industrial Display Market Estimates and Forecasts, by End Use (2020-2032) (USD Billion)
11.6.8 Argentina
11.6.8.1 Argentina Industrial Display Market Estimates and Forecasts, by Type (2020-2032) (USD Billion)
11.6.8.2 Argentina Industrial Display Market Estimates and Forecasts, By Application (2020-2032) (USD Billion)
11.6.8.3 Argentina Industrial Display Market Estimates and Forecasts, By Technology (2020-2032) (USD Billion)
11.6.8.4 Argentina Industrial Display Market Estimates and Forecasts, by End Use (2020-2032) (USD Billion)
11.6.9 Colombia
11.6.9.1 Colombia Industrial Display Market Estimates and Forecasts, by Type (2020-2032) (USD Billion)
11.6.9.2 Colombia Industrial Display Market Estimates and Forecasts, By Application (2020-2032) (USD Billion)
11.6.9.3 Colombia Industrial Display Market Estimates and Forecasts, By Technology (2020-2032) (USD Billion)
11.6.9.4 Colombia Industrial Display Market Estimates and Forecasts, by End Use (2020-2032) (USD Billion)
11.6.10 Rest of Latin America
11.6.10.1 Rest of Latin America Industrial Display Market Estimates and Forecasts, by Type (2020-2032) (USD Billion)
11.6.10.2 Rest of Latin America Industrial Display Market Estimates and Forecasts, By Application (2020-2032) (USD Billion)
11.6.10.3 Rest of Latin America Industrial Display Market Estimates and Forecasts, By Technology (2020-2032) (USD Billion)
11.6.10.4 Rest of Latin America Industrial Display Market Estimates and Forecasts, by End Use (2020-2032) (USD Billion)
12. Company Profiles
12.1 Samsung Electronics
12.1.1 Company Overview
12.1.2 Financial
12.1.3 Products/ Services Offered
12.1.4 SWOT Analysis
12.2 LG Display
12.2.1 Company Overview
12.2.2 Financial
12.2.3 Products/ Services Offered
12.2.4 SWOT Analysis
12.3 Sharp Corporation
12.3.1 Company Overview
12.3.2 Financial
12.3.3 Products/ Services Offered
12.3.4 SWOT Analysis
12.4 AU Optronics
12.4.1 Company Overview
12.4.2 Financial
12.4.3 Products/ Services Offered
12.4.4 SWOT Analysis
12.5 Panasonic Corporation
12.5.1 Company Overview
12.5.2 Financial
12.5.3 Products/ Services Offered
12.5.4 SWOT Analysis
12.6 BOE Technology Group
12.6.1 Company Overview
12.6.2 Financial
12.6.3 Products/ Services Offered
12.6.4 SWOT Analysis
12.7 Mitsubishi Electric
12.7.1 Company Overview
12.7.2 Financial
12.7.3 Products/ Services Offered
12.7.4 SWOT Analysis
12.8 Advantech Co., Ltd
12.8.1 Company Overview
12.8.2 Financial
12.8.3 Products/ Services Offered
12.8.4 SWOT Analysis
12.9 Planar Systems
12.9.1 Company Overview
12.9.2 Financial
12.9.3 Products/ Services Offered
12.9.4 SWOT Analysis
12.10 Siemens AG
12.10.1 Company Overview
12.10.2 Financial
12.10.3 Products/ Services Offered
12.10.4 SWOT Analysis
13. Use Cases and Best Practices
14. Conclusion
An accurate research report requires proper strategizing as well as implementation. There are multiple factors involved in the completion of good and accurate research report and selecting the best methodology to compete the research is the toughest part. Since the research reports we provide play a crucial role in any company’s decision-making process, therefore we at SNS Insider always believe that we should choose the best method which gives us results closer to reality. This allows us to reach at a stage wherein we can provide our clients best and accurate investment to output ratio.
Each report that we prepare takes a timeframe of 350-400 business hours for production. Starting from the selection of titles through a couple of in-depth brain storming session to the final QC process before uploading our titles on our website we dedicate around 350 working hours. The titles are selected based on their current market cap and the foreseen CAGR and growth.
The 5 steps process:
Step 1: Secondary Research:
Secondary Research or Desk Research is as the name suggests is a research process wherein, we collect data through the readily available information. In this process we use various paid and unpaid databases which our team has access to and gather data through the same. This includes examining of listed companies’ annual reports, Journals, SEC filling etc. Apart from this our team has access to various associations across the globe across different industries. Lastly, we have exchange relationships with various university as well as individual libraries.
Step 2: Primary Research
When we talk about primary research, it is a type of study in which the researchers collect relevant data samples directly, rather than relying on previously collected data. This type of research is focused on gaining content specific facts that can be sued to solve specific problems. Since the collected data is fresh and first hand therefore it makes the study more accurate and genuine.
We at SNS Insider have divided Primary Research into 2 parts.
Part 1 wherein we interview the KOLs of major players as well as the upcoming ones across various geographic regions. This allows us to have their view over the market scenario and acts as an important tool to come closer to the accurate market numbers. As many as 45 paid and unpaid primary interviews are taken from both the demand and supply side of the industry to make sure we land at an accurate judgement and analysis of the market.
This step involves the triangulation of data wherein our team analyses the interview transcripts, online survey responses and observation of on filed participants. The below mentioned chart should give a better understanding of the part 1 of the primary interview.
Part 2: In this part of primary research the data collected via secondary research and the part 1 of the primary research is validated with the interviews from individual consultants and subject matter experts.
Consultants are those set of people who have at least 12 years of experience and expertise within the industry whereas Subject Matter Experts are those with at least 15 years of experience behind their back within the same space. The data with the help of two main processes i.e., FGDs (Focused Group Discussions) and IDs (Individual Discussions). This gives us a 3rd party nonbiased primary view of the market scenario making it a more dependable one while collation of the data pointers.
Step 3: Data Bank Validation
Once all the information is collected via primary and secondary sources, we run that information for data validation. At our intelligence centre our research heads track a lot of information related to the market which includes the quarterly reports, the daily stock prices, and other relevant information. Our data bank server gets updated every fortnight and that is how the information which we collected using our primary and secondary information is revalidated in real time.
Step 4: QA/QC Process
After all the data collection and validation our team does a final level of quality check and quality assurance to get rid of any unwanted or undesired mistakes. This might include but not limited to getting rid of the any typos, duplication of numbers or missing of any important information. The people involved in this process include technical content writers, research heads and graphics people. Once this process is completed the title gets uploader on our platform for our clients to read it.
Step 5: Final QC/QA Process:
This is the last process and comes when the client has ordered the study. In this process a final QA/QC is done before the study is emailed to the client. Since we believe in giving our clients a good experience of our research studies, therefore, to make sure that we do not lack at our end in any way humanly possible we do a final round of quality check and then dispatch the study to the client.
Key Segmentation
By Type
Rugged Displays
Open Frame Monitors
Panel-Mount Monitors
Marine Displays
Video Walls
By Application
HMI
Remote Monitoring
Interactive Display
Digital Signage
By Technology
LCD
LED
OLED
E-Paper Display
By End Use
Manufacturing
Mining & Metals
Chemical, Oil, and Gas
Energy & Power
Others
Request for Segment Customization as per your Business Requirement: Segment Customization Request
REGIONAL COVERAGE:
North America
US
Canada
Mexico
Europe
Eastern Europe
Poland
Romania
Hungary
Turkey
Rest of Eastern Europe
Western Europe
Germany
France
UK
Italy
Spain
Netherlands
Switzerland
Austria
Rest of Western Europe
Asia Pacific
China
India
Japan
South Korea
Vietnam
Singapore
Australia
Rest of Asia Pacific
Middle East & Africa
Middle East
UAE
Egypt
Saudi Arabia
Qatar
Rest of the Middle East
Africa
Nigeria
South Africa
Rest of Africa
Latin America
Brazil
Argentina
Colombia
Rest of Latin America
Request for Country Level Research Report: Country Level Customization Request
Available Customization
With the given market data, SNS Insider offers customization as per the company’s specific needs. The following customization options are available for the report:
Product Analysis
Criss-Cross segment analysis (e.g. Product X Application)
Product Matrix which gives a detailed comparison of the product portfolio of each company
Geographic Analysis
Additional countries in any of the regions
Company Information
Detailed analysis and profiling of additional market players (Up to five)
The Gallium Nitride Semiconductor Devices Market size was valued at USD 2.25 billion in 2022. It is estimated to hit USD 13.58 billion by 2030 and grow at a growth rate of 25.2% during the forecast period of 2023-2030.
The mmWave Sensors and Modules Market Size was valued at USD 0.25 Billion in 2023 and is expected to reach USD 2.40 Billion, at a CAGR of 28.59% by 2024-2032
The Artificial Intelligence Robots Market Size was valued at USD 7.80 Billion in 2023 and is expected to reach USD 105.77 Billion by 2032 and grow at a CAGR of 35.69% over the forecast period 2024-2032.
The Automatic number plate recognition (ANPR) System Market Size was valued at USD 3.20 Billion in 2023 and is expected to grow at a CAGR of 9.10% to reach USD 7.00 Billion by 2032.
The Washing Machine Market Size was valued at USD 62.22 Billion in 2023 and is expected to reach USD 117.54 Billion by 2032 and grow at a CAGR of 7.4% over the forecast period 2024-2032.
The Circuit Protection Market Size was valued at USD 49.28 Billion in 2023 and is expected to reach USD 81.52 Billion by 2032 and grow at a CAGR of 5.79% over the forecast period 2024-2032.
Hi! Click one of our member below to chat on Phone