Get More Information on Industrial Automation Marke - Request Sample Report
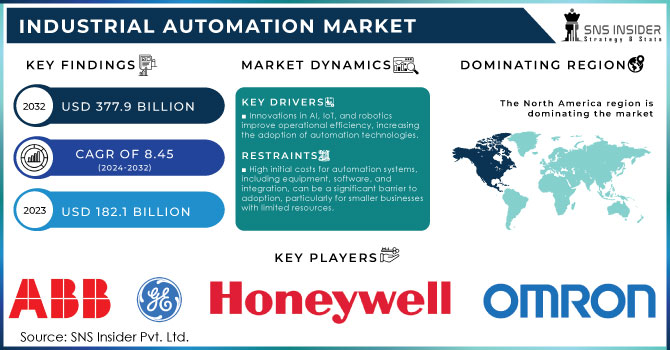
The Industrial Automation Market Size was valued at USD 182.1 Billion in 2023 and is expected to reach USD 377.9 Billion by 2032 and grow at a CAGR of 8.45% over the forecast period 2024-2032.
The use of equipment to automate systems or manufacturing processes is referred to as automation. The manufacturer’s purpose is to increase efficiency in the production process, cost optimization, and higher accuracy. Automation assists in collecting all the activities of the firm and it makes it easy to flow information throughout its components. The job that requires to do endurance or accuracy, and the works are dull and repetition-based and require specialized expertise are performed by the manufacturer. Automation in the manufacturing industry reduces human labor and improves precision, consistency, and operational efficiency. It does not only enhance production output but also offers dependable manufacturing. The sensors are mainly employed in linking production lines and also make use of devices that monitor the equipment and provide friendly data, visuals, and other outputs. All this provides other extra benefits such as reduced downtime, predictable maintenance, and improved decision-making. The adoption of digital twins and AR technologies in manufacturing is driving the growth of industrial automation as it has assisted the organization in recognizing the feasibility, reducing the risk, and making any essential improvements.
The implementation and management of digital twins have become possible with the invention of the industrial Internet of Things such as cloud systems and smart sensors and the use of disruptive technologies like AR. IoT Technology will play a crucial role in the future of Industrial IoT solutions. Automation technology enables us to drive the creation and flow of effective, inexpensive, and responsive systems architectures. The utilization of industrial IoT solutions allows the connection of industrial assets and the easy and quick meaning of increased transparency and productivity. The IIoT and edge solutions streamlined the device management and shop floor software throughout its lifecycle in terms of delivering the best customer experience. Other solutions such as AI, advanced analytics, edge computing and cloud computing will facilitate the analyses of machines’ data, providing invaluable information to optimize assets’ productivity and availability.
In September 1, 2024: Schneider Electric announced its goal to increase India's share in the global industrial automation market to 25% from less than 10% by leveraging growth in key sectors like water, transportation, mining, energy, and food and beverages.
DRIVERS
Innovations in AI, IoT, and robotics improve operational efficiency, increasing the adoption of automation technologies.
Innovations in automation technologies are being driven by breakthroughs in artificial intelligence, the internet of things, and robotics. Impacts on efficiency across a variety of domains are being seen with medium and large enterprises which is facilitating the continued rise of adoption. In this essay the contribution of these technologies will be discussed: artificial intelligence which allows machines to perform tasks that require intelligence and intervention in terms of adaptability with real-time decision-making processes, the internet of things which is the facilitation of devices being connected across vast networks, and robotics which is utilizing increasingly sophisticated machinery to replace and replicate physical tasks which would be hazardous for humans. The major effects of these technologies are the reduction of reliance on human factors for many operations along with an increase in efficiency in terms of speed and quality.
The move towards smart manufacturing and digital transformation drives higher demand for advanced automation solutions.
The growing popularity of smart manufacturing and digital transformation results in a high demand for modern automation solutions. Smart manufacturing implies the use of such advanced technologies as the Internet of Things pro, AI, big data pro, and other instruments that help to develop more flexible, fast, and responsive enterprise environments. Such an approach allows controlling all processes on the basis of real-time data. The associated benefits are that the speed and quality of items being produced increase, while waste reducing. In its turn, the concept of digital transformation is regarded to enhance every stage of the manufacturing lifecycle, such as design, production, maintenance, and supply chain management, and optimize it through the use of digital solutions and data. In these circumstances, businesses have to make their efforts to stay competitive and meet continuous changes in customer demands. Therefore, they start using modern automation solutions to optimize their job experience and guarantee high flexibility and scalability of enterprises. Nowadays, it is possible to observe a high demand for modern automation solutions. More companies aim to locate the power of sophisticated technical solutions that are expected to bring various benefits to the manufacturing process. The winning idea is to be in line with the fundamental principles of digital manufacturing and meet every possible demand with the help of appropriate toolsets.
RESTRAINTS
High initial costs for automation systems, including equipment, software, and integration, can be a significant barrier to adoption, particularly for smaller businesses with limited resources.
High initial costs are one of the most significant problems, as they serve as a considerable entry barrier for companies that want to implement automation systems. Investing funds in advanced equipment, software, and the processes of their integration into the workflow is an essential issue for both kinds of companies. High initial costs have some impact on small- and medium-sized businesses. Automated systems require realizations that would meet the needs of a specific industry, which makes the situation more complicated and demands more costs. In addition, the necessity for continuous maintenance of the systems, employee training, and account of regular updates to improve the work conditions are required. It means that the combined financial burden does not allow the companies to spend sufficient funds to be able to enter the market and compete with companies that can afford this expensive but prospective investment. It should be stated that benefits in the form of increased productivity, reduced expenses on the labor force, and improvements in general operational conditions can be observed in the long run.
In 2023, sensor segment accounted for the highest revenue share of over 25.2%, the servo was the major fragment, followed by the sensor. However, the robot segment is anticipated to grow at the most moderate rate. The players operating in the market are focusing on introducing highly advanced robots for automation.
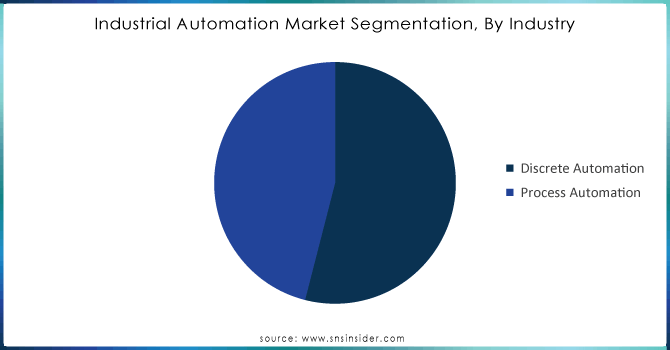
In 2023, the discrete automation segment accounted for the highest revenue share of over 54% and is further segmented as automotive, electronics, heavy manufacturing, packaging, and others. The automotive and heavy manufacturing industry enforced for the growth of the segment.
Need any customization research on Industrial Automation Market - Enquiry Now
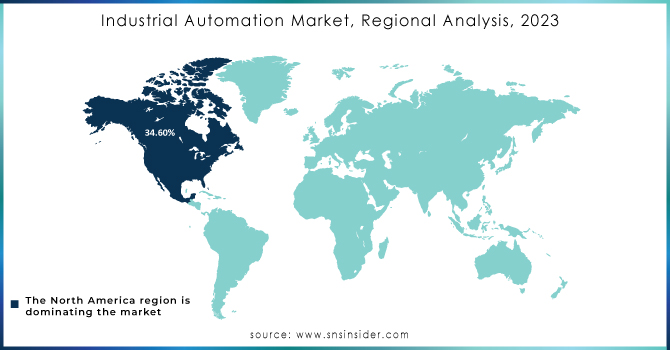
In 2023, North America has emerged as the dominant region, representing more than 34.6% of the total revenue., the Industrial Automation Market due to the high level of technological advancement and early adoption of automation solutions. The U.S. and Canada have a strong industrial base with substantial investments in automation technologies, driven by sectors such as automotive, aerospace, and electronics. North America’s focus on technological innovation and a well-established infrastructure supports its dominant position in the market.
The Asia-Pacific region is the fastest-growing market for industrial automation, driven by rapid industrialization and urbanization, particularly in countries like China, India, and Japan. The region’s manufacturing sector, including electronics and automotive industries, is expanding swiftly, fueling the demand for automation solutions. The burgeoning middle class and increasing technological adoption are significant factors driving the expansion of the industrial automation market in APAC.
The major key players are Siemens, Rockwell Automation, Honeywell, Schneider Electric, ABB, Mitsubishi Electric, Emerson Electric, Fanuc, Bosch Rexroth, Omron, Yokogawa Electric, General Electric, Delta Electronics and other players
RECENT DEVELOPMENTS
In May 2023: Mitsubishi Electric invested in Otto Motors the leading producer of autonomous mobile robots to promote global industrial automation as well as elaborate factory automation and business collaboration.
In October 2022: Rockwell Automation Inc., a company specializing in industrial automation and digital transformation, purchased CUBIC, the producer of modular systems for the installation of electric panels.
Report Attributes | Details |
Market Size in 2023 | US$ 182.1 Bn |
Market Size by 2032 | US$ 377.9 Bn |
CAGR | CAGR of 8.45% From 2024 to 2031 |
Base Year | 2023 |
Forecast Period | 2024-2032 |
Historical Data | 2020-2022 |
Report Scope & Coverage | Market Size, Segments Analysis, Competitive Landscape, Regional Analysis, DROC & SWOT Analysis, Forecast Outlook |
Key Segments | • By Components (Hardware (Photoelectric, Laser, Inductive, Others, Motor (AC, DC)), Drive, Sensors (PLC, HMI, Servo, Laser Markers, Safety Light Curtain, Robots), Software) • By Industry (Discrete Automation (Automotive, Electronics, Heavy Manufacturing, Packaging, Others), Process Automation (Oil and gas, Chemicals, Pulp and paper, Mining and Metals, Healthcare, Others)) |
Regional Analysis/Coverage | North America (US, Canada, Mexico), Europe (Eastern Europe [Poland, Romania, Hungary, Turkey, Rest of Eastern Europe] Western Europe] Germany, France, UK, Italy, Spain, Netherlands, Switzerland, Austria, Rest of Western Europe]), Asia Pacific (China, India, Japan, South Korea, Vietnam, Singapore, Australia, Rest of Asia Pacific), Middle East & Africa (Middle East [UAE, Egypt, Saudi Arabia, Qatar, Rest of Middle East], Africa [Nigeria, South Africa, Rest of Africa], Latin America (Brazil, Argentina, Colombia Rest of Latin America) |
Company Profiles | ABB Ltd., Emerson Electric Co., General Electric Company, Honeywell International Inc., Mitsubishi Electric Corporation, Omron Corporation, Rockwell Automation Inc., Schneider Electric SE, Siemens AG, Yokogawa Electric Corporation |
Key Drivers | • Operational efficiency in automation increases production effectiveness, lowers manual errors, and boosts the speed and consistency of all processes. • Cost By reducing labor costs, increasing resource efficiency, and reducing downtime, a reduction in automation can result in cost savings. • By reducing differences and deviations, quality improvement in automation helps maintain consistent product quality. |
Market Restraints | • Integration challenges, a significant initial investment. • Change resistance |
The Industrial Automation Market Market is expected to grow at 9.7% CAGR from 2023 to 2030.
Ans: The Industrial Automation Market Market is anticipated to reach USD 433.8 billion By 2030.
The market is expanding as a result of numerous deployments of fifth-generation wireless technologies, industrial IoT, industry 4.0, smart factories, and robotics.
The leading participants the ABB Ltd., Emerson Electric Co., General Electric Company, Honeywell International Inc., and Mitsubishi Electric Corporation.
Yes, you may request customization based on your company's needs.
Table of Contents
1. Introduction
1.1 Market Definition
1.2 Scope (Inclusion and Exclusions)
1.3 Research Assumptions
2. Executive Summary
2.1 Market Overview
2.2 Regional Synopsis
2.3 Competitive Summary
3. Research Methodology
3.1 Top-Down Approach
3.2 Bottom-up Approach
3.3. Data Validation
3.4 Primary Interviews
4. Market Dynamics Impact Analysis
4.1 Market Driving Factors Analysis
4.1.2 Drivers
4.1.2 Restraints
4.1.3 Opportunities
4.1.4 Challenges
4.2 PESTLE Analysis
4.3 Porter’s Five Forces Model
5. Statistical Insights and Trends Reporting
5.1 Manufacturing Output, by region, (2020-2023)
5.2 Utilization Rates, by region, (2020-2023)
5.3 Maintenance and Downtime Metrix
5.4 Technological Adoption Rates, by region
5.6 Export/Import Data, by region (2023)
6. Competitive Landscape
6.1 List of Major Companies, By Region
6.2 Market Share Analysis, By Region
6.3 Product Benchmarking
6.3.1 Product specifications and features
6.3.2 Pricing
6.4 Strategic Initiatives
6.4.1 Marketing and promotional activities
6.4.2 Distribution and supply chain strategies
6.4.3 Expansion plans and new product launches
6.4.4 Strategic partnerships and collaborations
6.5 Technological Advancements
6.6 Market Positioning and Branding
7. Industrial Automation Market Segmentation, by Components
7.1 Chapter Overview
7.2 Hardware
7.2.1 Hardware Market Trends Analysis (2020-2032)
7.2.2 Hardware Market Size Estimates and Forecasts to 2032 (USD Billion)
7.2.3 Photoelectric
7.2.3.1 Photoelectric Market Trends Analysis (2020-2032)
7.2.3.2 Photoelectric Market Size Estimates and Forecasts to 2032 (USD Billion)
7.2.4 Laser
7.2.4.1 Laser Market Trends Analysis (2020-2032)
7.2.4.2 Laser Market Size Estimates and Forecasts to 2032 (USD Billion)
7.2.5 Inductive
7.2.5.1 Inductive Market Trends Analysis (2020-2032)
7.2.5.2 Inductive Market Size Estimates and Forecasts to 2032 (USD Billion)
7.2.6 Others
7.2.6.1 Others Market Trends Analysis (2020-2032)
7.2.6.2 Others Market Size Estimates and Forecasts to 2032 (USD Billion)
7.2.7 Motor
7.2.7.1 Motor Market Trends Analysis (2020-2032)
7.2.7.2 Motor Market Size Estimates and Forecasts to 2032 (USD Billion)
7.2.8 Drive
7.2.8.1 Drive Market Trends Analysis (2020-2032)
7.2.8.2 Drive Market Size Estimates and Forecasts to 2032 (USD Billion)
7.3 Sensors
7.3.1 Sensors Market Trends Analysis (2020-2032)
7.3.2 Sensors Market Size Estimates and Forecasts to 2032 (USD Billion)
7.3.3 PLC
7.3.3.1 PLC Market Trends Analysis (2020-2032)
7.3.3.2 PLC Market Size Estimates and Forecasts to 2032 (USD Billion)
7.3.4 HMI
7.3.4.1 HMI Market Trends Analysis (2020-2032)
7.3.4.2 HMI Market Size Estimates and Forecasts to 2032 (USD Billion)
7.3.5 Servo
7.3.5.1 Servo Market Trends Analysis (2020-2032)
7.3.5.2 Servo Market Size Estimates and Forecasts to 2032 (USD Billion)
7.3.6 Laser Markers
7.3.6.1 Laser Markers Market Trends Analysis (2020-2032)
7.3.6.2 Laser Markers Market Size Estimates and Forecasts to 2032 (USD Billion)
7.3.7 Safety Light Curtain
7.3.7.1 Safety Light Curtain Market Trends Analysis (2020-2032)
7.3.7.2 Safety Light Curtain Market Size Estimates and Forecasts to 2032 (USD Billion)
7.3.8 Robots
7.3.8.1 Robots Market Trends Analysis (2020-2032)
7.3.8.2 Robots Market Size Estimates and Forecasts to 2032 (USD Billion)
7.9 Software
7.9.1 Software Market Trends Analysis (2020-2032)
7.9.2 Software Market Size Estimates and Forecasts to 2032 (USD Billion)
8. Industrial Automation Market Segmentation, by Industry
8.1 Chapter Overview
8.2 Discrete Automation
8.2.1 Discrete Automation Market Trends Analysis (2020-2032)
8.2.2 Discrete Automation Market Size Estimates and Forecasts to 2032 (USD Billion)
8.2.2 Automotive
8.2.2.1 Automotive Market Trends Analysis (2020-2032)
8.2.2.2 Automotive Market Size Estimates and Forecasts to 2032 (USD Billion)
8.2.3 Electronics
8.2.3.1 Electronics Market Trends Analysis (2020-2032)
8.2.3.2 Electronics Market Size Estimates and Forecasts to 2032 (USD Billion)
8.2.4 Heavy Manufacturing
8.2.4.1 Heavy Manufacturing Market Trends Analysis (2020-2032)
8.2.4.2 Heavy Manufacturing Market Size Estimates and Forecasts to 2032 (USD Billion)
8.2.5 Packaging
8.2.5.1 Packaging Market Trends Analysis (2020-2032)
8.2.5.2 Packaging Market Size Estimates and Forecasts to 2032 (USD Billion)
8.2.6 Others
8.2.6.1 Others Market Trends Analysis (2020-2032)
8.2.6.2 Others Market Size Estimates and Forecasts to 2032 (USD Billion)
8.3 Process Automation
8.3.1 Process Automation Market Trends Analysis (2020-2032)
8.3.2 Process Automation Market Size Estimates and Forecasts to 2032 (USD Billion)
8.3.3 Oil & Gas
8.3.3.1 Oil & Gas Market Trends Analysis (2020-2032)
8.3.3.2 Oil & Gas Market Size Estimates and Forecasts to 2032 (USD Billion)
8.3.4 Chemicals
8.3.4.1Chemicals Market Trends Analysis (2020-2032)
8.3.4.2 Chemicals Market Size Estimates and Forecasts to 2032 (USD Billion)
8.3.5 Pulp & Paper
8.3.5.1 Pulp & Paper Market Trends Analysis (2020-2032)
8.3.5.2 Pulp & Paper Curtain Market Size Estimates and Forecasts to 2032 (USD Billion)
8.3.6 Mining and Metals
8.3.6.1 Mining and Metals Market Trends Analysis (2020-2032)
8.3.6.2 Mining and Metals Market Size Estimates and Forecasts to 2032 (USD Billion)
8.3.7 Healthcare
8.3.7.1 Healthcare Market Trends Analysis (2020-2032)
8.3.7.2 Healthcare Market Size Estimates and Forecasts to 2032 (USD Billion)
8.3.8 Others
8.3.8.1 Others Market Trends Analysis (2020-2032)
8.3.8.2 Others Market Size Estimates and Forecasts to 2032 (USD Billion)
9. Regional Analysis
9.1 Chapter Overview
9.2 North America
9.2.1 Trends Analysis
9.2.2 North America Industrial Automation Market Estimates and Forecasts, by Country (2020-2032) (USD Billion)
9.2.3 North America Industrial Automation Market Estimates and Forecasts, by Components (2020-2032) (USD Billion)
9.2.4 North America Industrial Automation Market Estimates and Forecasts, by Industry (2020-2032) (USD Billion)
9.2.5 USA
9.2.5.1 USA Industrial Automation Market Estimates and Forecasts, by Components (2020-2032) (USD Billion)
9.2.5.2 USA Industrial Automation Market Estimates and Forecasts, by Industry (2020-2032) (USD Billion)
9.2.6 Canada
9.2.6.1 Canada Industrial Automation Market Estimates and Forecasts, by Components (2020-2032) (USD Billion)
9.2.6.2 Canada Industrial Automation Market Estimates and Forecasts, by Industry (2020-2032) (USD Billion)
9.2.7 Mexico
9.2.7.1 Mexico Industrial Automation Market Estimates and Forecasts, by Components (2020-2032) (USD Billion)
9.2.7.2 Mexico Industrial Automation Market Estimates and Forecasts, by Industry (2020-2032) (USD Billion)
9.3 Europe
9.3.1 Eastern Europe
9.3.1.1 Trends Analysis
9.3.1.2 Eastern Europe Industrial Automation Market Estimates and Forecasts, by Country (2020-2032) (USD Billion)
9.3.1.3 Eastern Europe Industrial Automation Market Estimates and Forecasts, by Components (2020-2032) (USD Billion)
9.3.1.4 Eastern Europe Industrial Automation Market Estimates and Forecasts, by Industry (2020-2032) (USD Billion)
9.3.1.5 Poland
9.3.1.5.1 Poland Industrial Automation Market Estimates and Forecasts, by Components (2020-2032) (USD Billion)
9.3.1.5.2 Poland Industrial Automation Market Estimates and Forecasts, by Industry (2020-2032) (USD Billion)
9.3.1.6 Romania
9.3.1.6.1 Romania Industrial Automation Market Estimates and Forecasts, by Components (2020-2032) (USD Billion)
9.3.1.6.2 Romania Industrial Automation Market Estimates and Forecasts, by Industry (2020-2032) (USD Billion)
9.3.1.7 Hungary
9.3.1.7.1 Hungary Industrial Automation Market Estimates and Forecasts, by Components (2020-2032) (USD Billion)
9.3.1.7.2 Hungary Industrial Automation Market Estimates and Forecasts, by Industry (2020-2032) (USD Billion)
9.3.1.8 Turkey
9.3.1.8.1 Turkey Industrial Automation Market Estimates and Forecasts, by Components (2020-2032) (USD Billion)
9.3.1.8.2 Turkey Industrial Automation Market Estimates and Forecasts, by Industry (2020-2032) (USD Billion)
9.3.1.9 Rest of Eastern Europe
9.3.1.9.1 Rest of Eastern Europe Industrial Automation Market Estimates and Forecasts, by Components (2020-2032) (USD Billion)
9.3.1.9.2 Rest of Eastern Europe Industrial Automation Market Estimates and Forecasts, by Industry (2020-2032) (USD Billion)
9.3.2 Western Europe
9.3.2.1 Trends Analysis
9.3.2.2 Western Europe Industrial Automation Market Estimates and Forecasts, by Country (2020-2032) (USD Billion)
9.3.2.3 Western Europe Industrial Automation Market Estimates and Forecasts, by Components (2020-2032) (USD Billion)
9.3.2.4 Western Europe Industrial Automation Market Estimates and Forecasts, by Industry (2020-2032) (USD Billion)
9.3.2.5 Germany
9.3.2.5.1 Germany Industrial Automation Market Estimates and Forecasts, by Components (2020-2032) (USD Billion)
9.3.2.5.2 Germany Industrial Automation Market Estimates and Forecasts, by Industry (2020-2032) (USD Billion)
9.3.2.6 France
9.3.2.6.1 France Industrial Automation Market Estimates and Forecasts, by Components (2020-2032) (USD Billion)
9.3.2.6.2 France Industrial Automation Market Estimates and Forecasts, by Industry (2020-2032) (USD Billion)
9.3.2.7 UK
9.3.2.7.1 UK Industrial Automation Market Estimates and Forecasts, by Components (2020-2032) (USD Billion)
9.3.2.7.2 UK Industrial Automation Market Estimates and Forecasts, by Industry (2020-2032) (USD Billion)
9.3.2.8 Italy
9.3.2.8.1 Italy Industrial Automation Market Estimates and Forecasts, by Components (2020-2032) (USD Billion)
9.3.2.8.2 Italy Industrial Automation Market Estimates and Forecasts, by Industry (2020-2032) (USD Billion)
9.3.2.9 Spain
9.3.2.9.1 Spain Industrial Automation Market Estimates and Forecasts, by Components (2020-2032) (USD Billion)
9.3.2.9.2 Spain Industrial Automation Market Estimates and Forecasts, by Industry (2020-2032) (USD Billion)
9.3.2.10 Netherlands
9.3.2.10.1 Netherlands Industrial Automation Market Estimates and Forecasts, by Components (2020-2032) (USD Billion)
9.3.2.10.2 Netherlands Industrial Automation Market Estimates and Forecasts, by Industry (2020-2032) (USD Billion)
9.3.2.11 Switzerland
9.3.2.11.1 Switzerland Industrial Automation Market Estimates and Forecasts, by Components (2020-2032) (USD Billion)
9.3.2.11.2 Switzerland Industrial Automation Market Estimates and Forecasts, by Industry (2020-2032) (USD Billion)
9.3.2.12 Austria
9.3.2.12.1 Austria Industrial Automation Market Estimates and Forecasts, by Components (2020-2032) (USD Billion)
9.3.2.12.2 Austria Industrial Automation Market Estimates and Forecasts, by Industry (2020-2032) (USD Billion)
9.3.2.13 Rest of Western Europe
9.3.2.13.1 Rest of Western Europe Industrial Automation Market Estimates and Forecasts, by Components (2020-2032) (USD Billion)
9.3.2.13.2 Rest of Western Europe Industrial Automation Market Estimates and Forecasts, by Industry (2020-2032) (USD Billion)
9.4 Asia-Pacific
9.4.1 Trends Analysis
9.4.2 Asia-Pacific Industrial Automation Market Estimates and Forecasts, by Country (2020-2032) (USD Billion)
9.4.3 Asia-Pacific Industrial Automation Market Estimates and Forecasts, by Components (2020-2032) (USD Billion)
9.4.4 Asia-Pacific Industrial Automation Market Estimates and Forecasts, by Industry (2020-2032) (USD Billion)
9.4.5 China
9.4.5.1 China Industrial Automation Market Estimates and Forecasts, by Components (2020-2032) (USD Billion)
9.4.5.2 China Industrial Automation Market Estimates and Forecasts, by Industry (2020-2032) (USD Billion)
9.4.6 India
9.4.5.1 India Industrial Automation Market Estimates and Forecasts, by Components (2020-2032) (USD Billion)
9.4.5.2 India Industrial Automation Market Estimates and Forecasts, by Industry (2020-2032) (USD Billion)
9.4.5 Japan
9.4.5.1 Japan Industrial Automation Market Estimates and Forecasts, by Components (2020-2032) (USD Billion)
9.4.5.2 Japan Industrial Automation Market Estimates and Forecasts, by Industry (2020-2032) (USD Billion)
9.4.6 South Korea
9.4.6.1 South Korea Industrial Automation Market Estimates and Forecasts, by Components (2020-2032) (USD Billion)
9.4.6.2 South Korea Industrial Automation Market Estimates and Forecasts, by Industry (2020-2032) (USD Billion)
9.4.7 Vietnam
9.4.7.1 Vietnam Industrial Automation Market Estimates and Forecasts, by Components (2020-2032) (USD Billion)
9.2.7.2 Vietnam Industrial Automation Market Estimates and Forecasts, by Industry (2020-2032) (USD Billion)
9.4.8 Singapore
9.4.8.1 Singapore Industrial Automation Market Estimates and Forecasts, by Components (2020-2032) (USD Billion)
9.4.8.2 Singapore Industrial Automation Market Estimates and Forecasts, by Industry (2020-2032) (USD Billion)
9.4.9 Australia
9.4.9.1 Australia Industrial Automation Market Estimates and Forecasts, by Components (2020-2032) (USD Billion)
9.4.9.2 Australia Industrial Automation Market Estimates and Forecasts, by Industry (2020-2032) (USD Billion)
9.4.10 Rest of Asia Pacific
9.4.10.1 Rest of Asia Pacific Industrial Automation Market Estimates and Forecasts, by Components (2020-2032) (USD Billion)
9.4.10.2 Rest of Asia Pacific Industrial Automation Market Estimates and Forecasts, by Industry (2020-2032) (USD Billion)
9.5 Middle East and Africa
9.5.1 Middle East
9.5.1.1 Trends Analysis
9.5.1.2 Middle East Industrial Automation Market Estimates and Forecasts, by Country (2020-2032) (USD Billion)
9.5.1.3 Middle East Industrial Automation Market Estimates and Forecasts, by Components (2020-2032) (USD Billion)
9.5.1.4 Middle East Industrial Automation Market Estimates and Forecasts, by Industry (2020-2032) (USD Billion)
9.5.1.5 UAE
9.5.1.5.1 UAE Industrial Automation Market Estimates and Forecasts, by Components (2020-2032) (USD Billion)
9.5.1.5.2 UAE Industrial Automation Market Estimates and Forecasts, by Industry (2020-2032) (USD Billion)
9.5.1.6 Egypt
9.5.1.6.1 Egypt Industrial Automation Market Estimates and Forecasts, by Components (2020-2032) (USD Billion)
9.5.1.6.2 Egypt Industrial Automation Market Estimates and Forecasts, by Industry (2020-2032) (USD Billion)
9.5.1.7 Saudi Arabia
9.5.1.7.1 Saudi Arabia Industrial Automation Market Estimates and Forecasts, by Components (2020-2032) (USD Billion)
9.5.1.7.2 Saudi Arabia Industrial Automation Market Estimates and Forecasts, by Industry (2020-2032) (USD Billion)
9.5.1.8 Qatar
9.5.1.8.1 Qatar Industrial Automation Market Estimates and Forecasts, by Components (2020-2032) (USD Billion)
9.5.1.8.2 Qatar Industrial Automation Market Estimates and Forecasts, by Industry (2020-2032) (USD Billion)
9.5.1.9 Rest of Middle East
9.5.1.9.1 Rest of Middle East Industrial Automation Market Estimates and Forecasts, by Components (2020-2032) (USD Billion)
9.5.1.9.2 Rest of Middle East Industrial Automation Market Estimates and Forecasts, by Industry (2020-2032) (USD Billion)
9.5.2 Africa
9.5.2.1 Trends Analysis
9.5.2.2 Africa Industrial Automation Market Estimates and Forecasts, by Country (2020-2032) (USD Billion)
9.5.2.3 Africa Industrial Automation Market Estimates and Forecasts, by Components (2020-2032) (USD Billion)
9.5.2.4 Africa Industrial Automation Market Estimates and Forecasts, by Industry (2020-2032) (USD Billion)
9.5.2.5 South Africa
9.5.2.5.1 South Africa Industrial Automation Market Estimates and Forecasts, by Components (2020-2032) (USD Billion)
9.5.2.5.2 South Africa Industrial Automation Market Estimates and Forecasts, by Industry (2020-2032) (USD Billion)
9.5.2.6 Nigeria
9.5.2.6.1 Nigeria Industrial Automation Market Estimates and Forecasts, by Components (2020-2032) (USD Billion)
9.5.2.6.2 Nigeria Industrial Automation Market Estimates and Forecasts, by Industry (2020-2032) (USD Billion)
9.5.2.7 Rest of Africa
9.5.2.7.1 Rest of Africa Industrial Automation Market Estimates and Forecasts, by Components (2020-2032) (USD Billion)
9.5.2.7.2 Rest of Africa Industrial Automation Market Estimates and Forecasts, by Industry (2020-2032) (USD Billion)
9.6 Latin America
9.6.1 Trends Analysis
9.6.2 Latin America Industrial Automation Market Estimates and Forecasts, by Country (2020-2032) (USD Billion)
9.6.3 Latin America Industrial Automation Market Estimates and Forecasts, by Components (2020-2032) (USD Billion)
9.6.4 Latin America Industrial Automation Market Estimates and Forecasts, by Industry (2020-2032) (USD Billion)
9.6.5 Brazil
9.6.5.1 Brazil Industrial Automation Market Estimates and Forecasts, by Components (2020-2032) (USD Billion)
9.6.5.2 Brazil Industrial Automation Market Estimates and Forecasts, by Industry (2020-2032) (USD Billion)
9.6.6 Argentina
9.6.6.1 Argentina Industrial Automation Market Estimates and Forecasts, by Components (2020-2032) (USD Billion)
9.6.6.2 Argentina Industrial Automation Market Estimates and Forecasts, by Industry (2020-2032) (USD Billion)
9.6.7 Colombia
9.6.7.1 Colombia Industrial Automation Market Estimates and Forecasts, by Components (2020-2032) (USD Billion)
9.6.7.2 Colombia Industrial Automation Market Estimates and Forecasts, by Industry (2020-2032) (USD Billion)
9.6.8 Rest of Latin America
9.6.8.1 Rest of Latin America Industrial Automation Market Estimates and Forecasts, by Components (2020-2032) (USD Billion)
9.6.8.2 Rest of Latin America Industrial Automation Market Estimates and Forecasts, by Industry (2020-2032) (USD Billion)
10. Company Profiles
10.1 Siemens
10.1.1 Company Overview
10.1.2 Financial
10.1.3 Products/ Services Offered
110.1.4 SWOT Analysis
10.2 Rockwell Automation
10.2.1 Company Overview
10.2.2 Financial
10.2.3 Products/ Services Offered
10.2.4 SWOT Analysis
10.3 Honeywell, Schneider Electric
10.3.1 Company Overview
10.3.2 Financial
10.3.3 Products/ Services Offered
10.3.4 SWOT Analysis
10.4 ABB
10.4.1 Company Overview
10.4.2 Financial
10.4.3 Products/ Services Offered
10.4.4 SWOT Analysis
10.5 Mitsubishi Electric
10.5.1 Company Overview
10.5.2 Financial
10.5.3 Products/ Services Offered
10.5.4 SWOT Analysis
10.6 Emerson Electric
10.6.1 Company Overview
10.6.2 Financial
10.6.3 Products/ Services Offered
10.6.4 SWOT Analysis
10.7 Fanuc
10.7.1 Company Overview
10.7.2 Financial
10.7.3 Products/ Services Offered
10.7.4 SWOT Analysis
10.8 Bosch Rexroth
10.8.1 Company Overview
10.8.2 Financial
10.8.3 Products/ Services Offered
10.8.4 SWOT Analysis
10.9 Omron
10.9.1 Company Overview
10.9.2 Financial
10.9.3 Products/ Services Offered
10.9.4 SWOT Analysis
10.10 Yokogawa Electric
10.9.1 Company Overview
10.9.2 Financial
10.9.3 Products/ Services Offered
10.9.4 SWOT Analysis
11. Use Cases and Best Practices
12. Conclusion
An accurate research report requires proper strategizing as well as implementation. There are multiple factors involved in the completion of good and accurate research report and selecting the best methodology to compete the research is the toughest part. Since the research reports we provide play a crucial role in any company’s decision-making process, therefore we at SNS Insider always believe that we should choose the best method which gives us results closer to reality. This allows us to reach at a stage wherein we can provide our clients best and accurate investment to output ratio.
Each report that we prepare takes a timeframe of 350-400 business hours for production. Starting from the selection of titles through a couple of in-depth brain storming session to the final QC process before uploading our titles on our website we dedicate around 350 working hours. The titles are selected based on their current market cap and the foreseen CAGR and growth.
The 5 steps process:
Step 1: Secondary Research:
Secondary Research or Desk Research is as the name suggests is a research process wherein, we collect data through the readily available information. In this process we use various paid and unpaid databases which our team has access to and gather data through the same. This includes examining of listed companies’ annual reports, Journals, SEC filling etc. Apart from this our team has access to various associations across the globe across different industries. Lastly, we have exchange relationships with various university as well as individual libraries.
Step 2: Primary Research
When we talk about primary research, it is a type of study in which the researchers collect relevant data samples directly, rather than relying on previously collected data. This type of research is focused on gaining content specific facts that can be sued to solve specific problems. Since the collected data is fresh and first hand therefore it makes the study more accurate and genuine.
We at SNS Insider have divided Primary Research into 2 parts.
Part 1 wherein we interview the KOLs of major players as well as the upcoming ones across various geographic regions. This allows us to have their view over the market scenario and acts as an important tool to come closer to the accurate market numbers. As many as 45 paid and unpaid primary interviews are taken from both the demand and supply side of the industry to make sure we land at an accurate judgement and analysis of the market.
This step involves the triangulation of data wherein our team analyses the interview transcripts, online survey responses and observation of on filed participants. The below mentioned chart should give a better understanding of the part 1 of the primary interview.
Part 2: In this part of primary research the data collected via secondary research and the part 1 of the primary research is validated with the interviews from individual consultants and subject matter experts.
Consultants are those set of people who have at least 12 years of experience and expertise within the industry whereas Subject Matter Experts are those with at least 15 years of experience behind their back within the same space. The data with the help of two main processes i.e., FGDs (Focused Group Discussions) and IDs (Individual Discussions). This gives us a 3rd party nonbiased primary view of the market scenario making it a more dependable one while collation of the data pointers.
Step 3: Data Bank Validation
Once all the information is collected via primary and secondary sources, we run that information for data validation. At our intelligence centre our research heads track a lot of information related to the market which includes the quarterly reports, the daily stock prices, and other relevant information. Our data bank server gets updated every fortnight and that is how the information which we collected using our primary and secondary information is revalidated in real time.
Step 4: QA/QC Process
After all the data collection and validation our team does a final level of quality check and quality assurance to get rid of any unwanted or undesired mistakes. This might include but not limited to getting rid of the any typos, duplication of numbers or missing of any important information. The people involved in this process include technical content writers, research heads and graphics people. Once this process is completed the title gets uploader on our platform for our clients to read it.
Step 5: Final QC/QA Process:
This is the last process and comes when the client has ordered the study. In this process a final QA/QC is done before the study is emailed to the client. Since we believe in giving our clients a good experience of our research studies, therefore, to make sure that we do not lack at our end in any way humanly possible we do a final round of quality check and then dispatch the study to the client.
KEY MARKET SEGMENTATION
By Components
Hardware
Photoelectric
Laser
Inductive
Others
Motor
Drive
Sensors
PLC
HMI
Servo
Laser Markers
Safety Light Curtain
Robots
Software
By Industry
Discrete Automation
Automotive
Electronics
Heavy Manufacturing
Packaging
Others
Process Automation
Oil & Gas
Chemicals
Pulp & Paper
Mining and Metals
Healthcare
Others
Request for Segment Customization as per your Business Requirement: Segment Customization Request
REGIONAL COVERAGE:
North America
US
Canada
Mexico
Europe
Eastern Europe
Poland
Romania
Hungary
Turkey
Rest of Eastern Europe
Western Europe
Germany
France
UK
Italy
Spain
Netherlands
Switzerland
Austria
Rest of Western Europe
Asia Pacific
China
India
Japan
South Korea
Vietnam
Singapore
Australia
Rest of Asia Pacific
Middle East & Africa
Middle East
UAE
Egypt
Saudi Arabia
Qatar
Rest of the Middle East
Africa
Nigeria
South Africa
Rest of Africa
Latin America
Brazil
Argentina
Colombia
Request for Country Level Research Report: Country Level Customization Request
Available Customization
With the given market data, SNS Insider offers customization as per the company’s specific needs. The following customization options are available for the report:
Product Analysis
Criss-Cross segment analysis (e.g. Product X Application)
Product Matrix which gives a detailed comparison of the product portfolio of each company
Geographic Analysis
Additional countries in any of the regions
Company Information
Detailed analysis and profiling of additional market players (Up to five)
The Fuel Transfer Pumps Market size was valued at USD 1.82 Bn in 2023 and is expected to reach USD 2.60 Bn by 2031 and grow at a CAGR of 4.65 % over the forecast period 2024-2031.
The Industrial Robotics Market Size was valued at USD 17.3 billion in 2023 and is expected to reach USD 47.64 billion by 2032 and grow at a CAGR of 13.5% over the forecast period 2024-2032.
The Industrial Pumps Market Size was valued at USD 55.95 Billion in 2023 and is expected to reach USD 87.3 Billion by 2032 and grow at a CAGR of 4.92% over the forecast period 2024-2032.
Industrial Vacuum Cleaner Market size was estimated at USD 1.06 Billion in 2023 and is expected to reach USD 1.78 Billion by 2032 at a CAGR of 5.95% during the forecast period of 2024-2032.
The Food Packaging Equipment Market size was estimated at USD19.87 billion in 2022 and is expected to reach USD 29.3 billion by 2030 at a CAGR of 4.98% during the forecast period of 2023-2030.
The Smart Factory Market size was valued at USD 116.50 Billion in 2023. It is expected to grow to USD 285.65 Billion by 2032 and grow at a CAGR of 10.50 % over the forecast period of 2024-2032.
Hi! Click one of our member below to chat on Phone