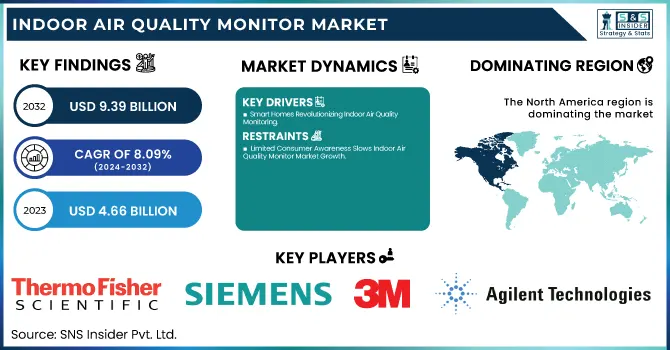
The Indoor Air Quality Monitor Market was valued at USD 4.66 billion in 2023 and is projected to reach USD 9.39 billion by 2032, growing at a CAGR of 8.09% from 2024 to 2032. Rising health issues regarding respiratory diseases, stringent government regulations as such the EPA’s Clean Air Act, and growing acceptance of smart home automation are the major market drivers. Poor indoor air quality impairs workplace productivity by 12%, driving the need for IAQ monitors in commercial and residential spaces.
To Get more information on Indoor Air Quality Monitor Market - Request Free Sample Report
Additionally, the U.S. IAQ Monitor Market, valued at USD 1.29 billion in 2023, is expected to reach USD 2.15 billion by 2032 at a CAGR of 5.18%, driven by awareness of airborne viruses, OSHA regulations, and IoT-enabled monitoring systems. Offices with high CO₂ levels experience a 25% drop in cognitive function, while 30% of asthma cases are linked to indoor pollution, highlighting the critical role of IAQ monitors in public health and smart city infrastructure.
Drivers:
Smart Homes Revolutionizing Indoor Air Quality Monitoring
The rapid adoption of smart home technology and building automation is transforming the Indoor Air Quality (IAQ) Monitor Market, making air quality management more intelligent and efficient. The integration of IoT-enabled sensors, AI-driven analytics, and automated HVAC systems allows homeowners to monitor and optimize indoor air conditions in real time. Studies indicate that smart home penetration will drive a 40% increase in IAQ device demand in developed markets, while AI-driven building management can reduce energy consumption and carbon emissions by at least 8%. Advanced IAQ monitors, such as the Apollo AIR-1, provide comprehensive tracking of pollutants like CO₂, CO, PM2.5, and VOCs, offering detailed insights into indoor environments. Governments and health organizations are promoting smart ventilation systems as part of energy-efficient initiatives, further accelerating adoption. As concerns over airborne pollutants and respiratory health risks rise, smart IAQ solutions are becoming essential in future smart cities and sustainable living spaces.
Restraints:
Limited Consumer Awareness Slows Indoor Air Quality Monitor Market Growth
With increasing health concerns, lack of consumer awareness regarding indoor air quality (IAQ) is restricting growth of the market. People are often unaware that everyday products, including scented candles, may emit harmful VOCs, while ongoing exposure to poor IAQ is a serious risk factor for respiratory diseases, cognitive decline, and much more. The EPA recommends IAQ monitors, and regulatory measures have been implemented, but studies shows that every day only a small percentage of consumers actually search for IAQ monitors. Real-time IAQ data and digital interventions increased self-awareness, resulting in a window opening hours increase between 11%–39 %, according to pilot studies in Bradford. The COM-B model-based interventions vastly enhanced the IAQ-linked behaviors. 37% of broadband households are concerned about indoor dust and allergens, but 50% find smart air purification devices valuable. Bridging this awareness gap through government policies, industry initiatives, and consumer education efforts is vital for the successful adoption of long-term IAQ monitors.
Opportunities:
Expanding Industrial & Workplace Safety Regulations Unlock New Opportunities for the IAQ Monitor Market
The indoor air quality (IAQ) monitor market is gaining momentum as industrial safety regulations and workplace health standards tighten worldwide. Governments and regulatory bodies like OSHA, EPA, and WHO are enforcing stricter IAQ guidelines in factories, warehouses, and commercial offices, creating demand for advanced monitoring solutions. The growth of hybrid work environments is also pushing businesses to invest in real-time IAQ monitoring to ensure employee well-being and productivity. Additionally, industries such as pharmaceuticals, semiconductor manufacturing, and food processing require highly controlled indoor environments, driving demand for precision air quality sensors. The adoption of AI-powered predictive maintenance in IAQ monitoring systems presents a new opportunity, allowing businesses to automate ventilation adjustments, reduce energy costs, and prevent hazardous air conditions. As industries shift toward carbon neutrality and ESG compliance, IAQ monitoring is emerging as a critical component of sustainable workplace strategies.
Challenges:
Overcoming Cost, Calibration, and Data Accuracy Challenges in the IAQ Monitor Market
The indoor air quality (IAQ) monitor market faces significant challenges despite its growing demand. High initial costs and maintenance expenses deter widespread adoption, particularly in price-sensitive markets. Advanced IAQ monitors require frequent calibration and sensor replacements to ensure accuracy, increasing operational costs for businesses and homeowners. Variability in sensor performance and data reliability is another major issue, as environmental factors like humidity and temperature fluctuations can skew readings. Additionally, lack of standardization in IAQ metrics and regulations across regions creates confusion among consumers and businesses, slowing market penetration. The challenge of real-time data interpretation and actionable insights also persists, as many users struggle to translate IAQ data into effective ventilation and filtration strategies. Addressing these issues through cost-effective sensor technology, AI-driven calibration solutions, and standardized guidelines is crucial for unlocking the full potential of IAQ monitoring systems.
By Pollutant Type
The chemical sensor segment dominated the Indoor Air Quality (IAQ) Monitor Market in 2023, accounting for 54% of total revenue. These sensors have wide application in powerful Detection of harmful volatile organic compounds (VOCs), carbon monoxide (CO), carbon dioxide (CO₂), nitrogen dioxide (NO₂), ozone (O₃) etc. Growing concerns over indoor pollution from household products, industrial emissions, and inadequate ventilation have driven the demand for chemical-based IAQ monitors across residential, commercial, and industrial sectors. Moreover, increasing government regulations regarding air quality standards, particularly in offices and healthcare buildings, is driving the adoption of advanced chemical sensing technologies. Developments of miniaturized electrochemical and photoionization sensors are boosting the ability for real-time monitoring & in turn propels the growth of market. This projected growth in the need for accurate and continuous air quality monitoring at increasing number of places around the globe is encouraging the chemical sensors segment to be the leading segment in the indoor air quality monitor market throughout the forecast years.
The physical sensor segment is projected to be the fastest-growing in the Indoor Air Quality (IAQ) Monitor Market from 2024 to 2032, driven by rising demand for real-time particulate matter (PM) detection. Laser-based and optical particle counters are among these sensors, which are quite effective in monitoring PM2. 2.5, PM10, humidity and temperature, making them indispensable in residential, commercial and industrial applications. Rising awareness of airborne pollutants including dust, smoke, and allergens and their effects on respiratory health is driving adoption. Moreover, the presence of strict air quality laws and further incorporation of IAQ sensors with smart home technology are bolstering market growth. Advancement in technology like miniaturized, low-power sensors with wireless connectivity are also boosting adoption in portable and IoT enabled air quality monitors. The rising concerns regarding the airborne particulate pollution is majorly projected to boost the demand for physical sensors segment over the forecast period.
By Product
The fixed segment held a dominant 69% market share in the Indoor Air Quality (IAQ) Monitor Market in 2023, driven by its widespread adoption in commercial buildings, industrial facilities, healthcare institutions, and residential complexes. Fixed IAQ monitors provide continuous, real-time air quality assessment, making them essential for compliance with indoor air quality regulations and occupational health standards. Businesses and institutions are increasingly deploying these systems to monitor pollutants such as CO₂, VOCs, PM2.5, and humidity, ensuring a healthier environment for occupants. Government regulations, such as ASHRAE and EPA air quality standards, further drive demand for permanent, high-precision monitoring solutions. Additionally, the integration of fixed IAQ monitors into smart building management systems is boosting adoption. Their ability to provide long-term data analytics, automated ventilation control, and remote monitoring capabilities makes them the preferred choice for large-scale, high-traffic environments.
The portable segment is projected to be the fastest-growing in the Indoor Air Quality (IAQ) Monitor Market from 2024 to 2032, ue to rising demand for the assessment of air quality on the go as a part in residential, commercial, and industrial applications. These small, battery-operated devices offer real-time monitoring of pollutants like CO₂, VOCs, PM2. 5, and enables it to withstand extreme temperatures and humidity, making it perfect for homeowners, travelers, and mobile professionals. Increasing consumer awareness about indoor pollution, growing demand for smart home devices, and stringent air quality regulations are the key drivers of market growth. Furthermore, development of IoT connectivity, AI-driven analytics and smartphone integration improves usability and afforadility of portable IAQ monitors. Finally, they are affordable and easy to deploy, further driving adoption in developing countries where air pollution and urbanization trends are driving demand for personal air quality monitoring solutions.
By End Use
The commercial buildings segment held the largest revenue share of around 45% in 2023 in the Indoor Air Quality (IAQ) Monitor Market, driven by stringent air quality regulations, increasing corporate wellness initiatives, and rising concerns over employee health and productivity. Office spaces, shopping malls, hospitals, hotels, and educational institutions are investing heavily in advanced IAQ monitoring systems to ensure compliance with safety standards and enhance indoor environments. Government mandates promoting healthy workplace environments and energy-efficient buildings have accelerated IAQ monitor adoption. Additionally, the integration of AI-driven analytics, HVAC automation, and IoT-enabled air quality sensors has improved real-time monitoring and response capabilities. With growing awareness of airborne diseases and long-term respiratory health risks, businesses prioritize IAQ solutions to create safer, more comfortable, and energy-efficient indoor spaces, reinforcing this segment's dominance in the market.
The industrial segment is projected to be the fastest-growing in the Indoor Air Quality (IAQ) Monitor Market from 2024 to 2032, driven by stringent workplace safety regulations, rising concerns over hazardous air pollutants, and increasing adoption of smart monitoring technologies. Industries such as manufacturing, chemical processing, pharmaceuticals, and oil & gas face significant risks from airborne contaminants like volatile organic compounds (VOCs), particulate matter (PM), and toxic gases, necessitating advanced IAQ monitoring solutions. Regulatory bodies like OSHA, EPA, and EU-OSHA mandate compliance with strict air quality standards, prompting industries to invest in real-time IAQ sensors, AI-driven analytics, and IoT-enabled air purification systems. Additionally, rising awareness of worker health, operational efficiency, and sustainability initiatives is accelerating the adoption of automated air quality management solutions, positioning the industrial segment as a key driver of IAQ market expansion.
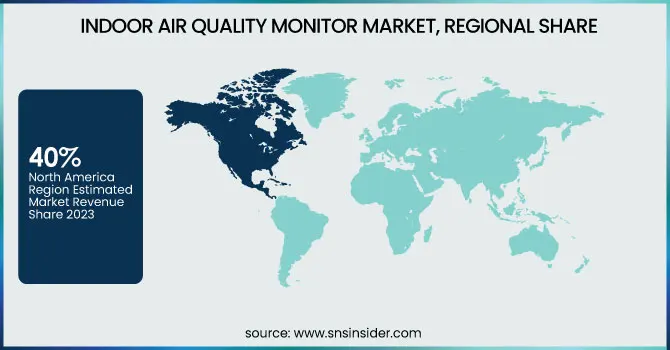
North America dominated the Indoor Air Quality (IAQ) Monitor Market, accounting for approximately 40% of global revenue in 2023, owing to stringent regulations on the air quality, growing consumer awareness, and high-speed adoption of smart homes. As a result, the demand increased from residential, commercial, and industrial sectors on the back of government initiatives like EPA’s IAQ guidelines and OSHA’s workplace air quality standards. Moreover, the increasing occurrence of respiratory disorders in the region, the growing concerns for indoor pollution and the rapid implementation of IoT-based air quality monitoring systems have also fueled the growth of the market. Corporate sustainability goals and LEED-certified green buildings are also driving the adoption of IAQ monitors. North America is expected to retain its leadership in the IAQ monitor market during the forecast period, owing to the high penetration of smart city initiatives and technological advancements in the U.S. and Canada.
The Asia Pacific region is the fastest-growing market for Indoor Air Quality (IAQ) monitors Over the forecast period 2024-2032, driven by rapid urbanization, industrial expansion, and increasing awareness of air pollution's health effects. Countries like China, India, and Japan are witnessing a surge in demand due to worsening air quality, stringent environmental regulations, and rising adoption of smart home technologies. Governments are implementing strict emission control policies and indoor air quality standards, fueling the need for IAQ monitoring devices in residential, commercial, and industrial sectors. Additionally, the rising prevalence of respiratory diseases, increasing disposable income, and smart city initiatives are further accelerating market expansion. The integration of IoT-enabled IAQ sensors and AI-driven analytics is expected to drive sustained growth across the region.
Get Customized Report as per Your Business Requirement - Enquiry Now
Some of the Major Players in Indoor Air Quality Monitor Market along with their Products:
Thermo Fisher Scientific Inc. (US) – Air quality monitoring instruments, gas analyzers
Siemens AG (Germany) – Smart building automation, HVAC control systems
Emerson Electric Co. (US) – Environmental monitoring sensors, air quality analyzers
3M (US) – Particulate matter sensors, air filtration solutions
TSI Inc. (US) – Indoor air quality meters, particle counters
Ingersoll Rand PLC (Ireland) – HVAC systems, air purifiers
Horiba Ltd. (Japan) – Gas analyzers, air pollution monitors
Testo SE & Co. KGaA (Germany) – IAQ measuring devices, CO₂ detectors
Aeroqual Ltd. (New Zealand) – Portable and fixed air quality monitors
Agilent Technologies Inc. (US) – Environmental gas analyzers
Air System Components, Inc. (US) – Airflow measurement systems
Airveda (India) – Smart IAQ monitors, real-time air quality tracking
Awair Inc. (US) – Smart air quality sensors for homes and businesses
Bernard Technologies GmbH (Germany) – VOC and CO₂ monitoring solutions
Camfil AB (Sweden) – Advanced air filtration and purification systems
Daikin Industries, Ltd. (Japan) – Smart HVAC and air purification systems
General Electric Company (US) – Environmental monitoring solutions
Honeywell International Inc. (US) – IAQ sensors, building automation systems
Johnson Controls International PLC (Ireland) – Smart HVAC and air filtration solutions
Lennox International Inc. (US) – Ventilation and air purification systems
Merck KGaA (Germany) – Air sampling and environmental monitoring equipment
Mettler Toledo (Switzerland) – Gas and particulate analyzers
Omicron Sensing Pvt. Ltd. (India) – IAQ sensors, VOC analyzers
Panasonic Corporation (Japan) – Smart air purifiers, IAQ monitoring systems
Scentroid (Canada) – Odor and gas monitoring systems
Sensirion AG (Switzerland) – Air quality sensors, particulate matter detectors
Shimadzu Corporation (Japan) – Environmental monitoring instruments
Teledyne Technologies Incorporated (US) – IAQ monitoring and sensor solutions
Trane Technologies Company, LLC (US) – HVAC and air purification solutions
Trion, Inc. (US) – Indoor air filtration and humidification systems
On November 16, 2024, Thermo Fisher Scientific introduced a ‘Make in India’ Class 1 CAAQMS which would further improve the real-time air monitoring in India with the help of locally manufactured analysers and global expertise. The FTIR-based Max-iR, company’s advanced CEMS solutions support the environmental regulations helping authorities to control pollution from diverse sectors.
On 29 August 2024, Siemens' Desigo building automation solutions enhance energy efficiency and digital transformation for buildings of all sizes. With future-proof technology, it optimizes indoor air quality, reduces carbon footprint, and lowers operational costs for sustainable building management.
| Report Attributes | Details |
|---|---|
| Market Size in 2023 | USD 4.66 Billion |
| Market Size by 2032 | USD 9.39 Billion |
| CAGR | CAGR of 8.09% From 2024 to 2032 |
| Base Year | 2023 |
| Forecast Period | 2024-2032 |
| Historical Data | 2020-2022 |
| Report Scope & Coverage | Market Size, Segments Analysis, Competitive Landscape, Regional Analysis, DROC & SWOT Analysis, Forecast Outlook |
| Key Segments | • By Pollutant Type (Biological, Physical, Chemical) • By Product Type(Portable, Fixed) • By End-User(Residential, Commercial Buildings, Industrial, Government Buildings) |
| Regional Analysis/Coverage | North America (US, Canada, Mexico), Europe (Eastern Europe [Poland, Romania, Hungary, Turkey, Rest of Eastern Europe] Western Europe] Germany, France, UK, Italy, Spain, Netherlands, Switzerland, Austria, Rest of Western Europe]), Asia Pacific (China, India, Japan, South Korea, Vietnam, Singapore, Australia, Rest of Asia Pacific), Middle East & Africa (Middle East [UAE, Egypt, Saudi Arabia, Qatar, Rest of Middle East], Africa [Nigeria, South Africa, Rest of Africa], Latin America (Brazil, Argentina, Colombia, Rest of Latin America) |
| Company Profiles | Thermo Fisher Scientific Inc. (US), Siemens AG (Germany), Emerson Electric Co. (US), 3M (US), TSI Inc. (US), Ingersoll Rand PLC (Ireland), Horiba Ltd. (Japan), Testo SE & Co. KGaA (Germany), Aeroqual Ltd. (New Zealand), Agilent Technologies Inc. (US), Air System Components, Inc. (US), Airveda (India), Awair Inc. (US), Bernard Technologies GmbH (Germany), Camfil AB (Sweden), Daikin Industries, Ltd. (Japan), General Electric Company (US), Honeywell International Inc. (US), Johnson Controls International PLC (Ireland), Lennox International Inc. (US), Merck KGaA (Germany), Mettler Toledo (Switzerland), Omicron Sensing Pvt. Ltd. (India), Panasonic Corporation (Japan), Scentroid (Canada), Sensirion AG (Switzerland), Shimadzu Corporation (Japan), Teledyne Technologies Incorporated (US), Trane Technologies Company, LLC (US), Trion, Inc. (US). |
Ans: The Indoor Air Quality Monitor Market is expected to grow at a CAGR of 8.09% during 2024-2032.
Ans: The Indoor Air Quality Monitor Market was USD 4.66 Billion in 2023 and is expected to Reach USD 9.39 Billion by 2032.
Ans: Include rising industrial automation, increasing adoption of variable frequency drives (VFDs), growing demand for power quality solutions, and stringent government regulations on electrical harmonics.
Ans: The “Fixed” segment dominated the Indoor Air Quality Monitor Market.
Ans: North America dominated the Indoor Air Quality Monitor Market in 2023.
1. Introduction
1.1 Market Definition
1.2 Scope (Inclusion and Exclusions)
1.3 Research Assumptions
2. Executive Summary
2.1 Market Overview
2.2 Regional Synopsis
2.3 Competitive Summary
3. Research Methodology
3.1 Top-Down Approach
3.2 Bottom-up Approach
3.3. Data Validation
3.4 Primary Interviews
4. Market Dynamics Impact Analysis
4.1 Market Driving Factors Analysis
4.1.1 Drivers
4.1.2 Restraints
4.1.3 Opportunities
4.1.4 Challenges
4.2 PESTLE Analysis
4.3 Porter’s Five Forces Model
5. Statistical Insights and Trends Reporting
5.1 Impact of Digital Transformation
5 .2 Remote Work and Distributed Systems
5.3 Growing Need for Cybersecurity
5.4 Sustainability and Green IT
5.5 Cloud Adoption and Hybrid Environments
6. Competitive Landscape
6.1 List of Major Companies, By Region
6.2 Market Share Analysis, By Region
6.3 Product Benchmarking
6.3.1 Product specifications and features
6.3.2 Pricing
6.4 Strategic Initiatives
6.4.1 Marketing and promotional activities
6.4.2 Distribution and supply chain strategies
6.4.3 Expansion plans and new product launches
6.4.4 Strategic partnerships and collaborations
6.5 Technological Advancements
6.6 Market Positioning and Branding
7. Intelligent Platform Management Interface (IPMI) Market Segmentation, by Component
7.1 Chapter Overview
7.2 Baseboard management controller
7.2.1 Baseboard management controller Market Trends Analysis (2020-2032)
7.2.2 Baseboard management controller Market Size Estimates and Forecasts to 2032 (USD Billion)
7.3 Sensors & controls
7.3.1 Sensors & controls Market Trends Analysis (2020-2032)
7.3.2 Sensors & controls Market Size Estimates and Forecasts to 2032 (USD Billion)
7.4 Memory devices
7.4.1 Memory devices Market Trends Analysis (2020-2032)
7.4.2 Memory devices Market Size Estimates and Forecasts to 2032 (USD Billion)
7.5 Others
7.5.1 Others Market Trends Analysis (2020-2032)
7.5.2 Others Market Size Estimates and Forecasts to 2032 (USD Billion)
8. Intelligent Platform Management Interface (IPMI) Market Segmentation, by Application
8.1 Chapter Overview
8.2 Server
8.2.1 Server Market Trends Analysis (2020-2032)
8.2.2 Server Market Size Estimates and Forecasts to 2032 (USD Billion)
8.3 Storage devices
8.3.1 Storage devices Market Trends Analysis (2020-2032)
8.3.2 Storage devices Market Size Estimates and Forecasts to 2032 (USD Billion)
8.4 Telecommunication equipment
8.4.1 Telecommunication equipment Market Trends Analysis (2020-2032)
8.4.2 Telecommunication equipment Market Size Estimates and Forecasts to 2032 (USD Billion)
9. Intelligent Platform Management Interface (IPMI) Market Segmentation, by Verticals
9.1 Chapter Overview
9.2 Banking, Financial services, and Insurance (BFSI)
9.2.1 Banking, Financial services, and Insurance (BFSI) Market Trends Analysis (2020-2032)
9.2.2 Banking, Financial services, and Insurance (BFSI) Market Size Estimates and Forecasts to 2032 (USD Billion)
9.3 Healthcare
9.3.1 Healthcare Market Trends Analysis (2020-2032)
9.3.2 Healthcare Market Size Estimates and Forecasts to 2032 (USD Billion)
9.4 Education & research
9.4.1 Education & research Market Trends Analysis (2020-2032)
9.4.2 Education & research Market Size Estimates and Forecasts to 2032 (USD Billion)
9.5 Retail
9.5.1 Retail Market Trends Analysis (2020-2032)
9.5.2 Retail Market Size Estimates and Forecasts to 2032 (USD Billion)
9.6 Manufacturing
9.6.1 Manufacturing Market Trends Analysis (2020-2032)
9.6.2 Manufacturing Market Size Estimates and Forecasts to 2032 (USD Billion)
9.7 Public sector
9.7.1 Public sector Market Trends Analysis (2020-2032)
9.7.2 Public sector Market Size Estimates and Forecasts to 2032 (USD Billion)
9.8 IT & telecom
9.8.1 IT & telecom Market Trends Analysis (2020-2032)
9.8.2 IT & telecom Market Size Estimates and Forecasts to 2032 (USD Billion)
9.9 Others
9.9.1 Others Market Trends Analysis (2020-2032)
9.9.2 Others Market Size Estimates and Forecasts to 2032 (USD Billion)
10. Regional Analysis
10.1 Chapter Overview
10.2 North America
10.2.1 Trends Analysis
10.2.2 North America Intelligent Platform Management Interface (IPMI) Market Estimates and Forecasts, by Country (2020-2032) (USD Billion)
10.2.3 North America Intelligent Platform Management Interface (IPMI) Market Estimates and Forecasts, by Component (2020-2032) (USD Billion)
10.2.4 North America Intelligent Platform Management Interface (IPMI) Market Estimates and Forecasts, by Application (2020-2032) (USD Billion)
10.2.5 North America Intelligent Platform Management Interface (IPMI) Market Estimates and Forecasts, by Verticals (2020-2032) (USD Billion)
10.2.6 USA
10.2.6.1 USA Intelligent Platform Management Interface (IPMI) Market Estimates and Forecasts, by Component (2020-2032) (USD Billion)
10.2.6.2 USA Intelligent Platform Management Interface (IPMI) Market Estimates and Forecasts, by Application (2020-2032) (USD Billion)
10.2.6.3 USA Intelligent Platform Management Interface (IPMI) Market Estimates and Forecasts, by Verticals (2020-2032) (USD Billion)
10.2.7 Canada
10.2.7.1 Canada Intelligent Platform Management Interface (IPMI) Market Estimates and Forecasts, by Component (2020-2032) (USD Billion)
10.2.7.2 Canada Intelligent Platform Management Interface (IPMI) Market Estimates and Forecasts, by Application (2020-2032) (USD Billion)
10.2.7.3 Canada Intelligent Platform Management Interface (IPMI) Market Estimates and Forecasts, by Verticals (2020-2032) (USD Billion)
10.2.8 Mexico
10.2.8.1 Mexico Intelligent Platform Management Interface (IPMI) Market Estimates and Forecasts, by Component (2020-2032) (USD Billion)
10.2.8.2 Mexico Intelligent Platform Management Interface (IPMI) Market Estimates and Forecasts, by Application (2020-2032) (USD Billion)
10.2.8.3 Mexico Intelligent Platform Management Interface (IPMI) Market Estimates and Forecasts, by Verticals (2020-2032) (USD Billion)
10.3 Europe
10.3.1 Eastern Europe
10.3.1.1 Trends Analysis
10.3.1.2 Eastern Europe Intelligent Platform Management Interface (IPMI) Market Estimates and Forecasts, by Country (2020-2032) (USD Billion)
10.3.1.3 Eastern Europe Intelligent Platform Management Interface (IPMI) Market Estimates and Forecasts, by Component (2020-2032) (USD Billion)
10.3.1.4 Eastern Europe Intelligent Platform Management Interface (IPMI) Market Estimates and Forecasts, by Application (2020-2032) (USD Billion)
10.3.1.5 Eastern Europe Intelligent Platform Management Interface (IPMI) Market Estimates and Forecasts, by Verticals (2020-2032) (USD Billion)
10.3.1.6 Poland
10.3.1.6.1 Poland Intelligent Platform Management Interface (IPMI) Market Estimates and Forecasts, by Component (2020-2032) (USD Billion)
10.3.1.6.2 Poland Intelligent Platform Management Interface (IPMI) Market Estimates and Forecasts, by Application (2020-2032) (USD Billion)
10.3.1.6.3 Poland Intelligent Platform Management Interface (IPMI) Market Estimates and Forecasts, by Verticals (2020-2032) (USD Billion)
10.3.1.7 Romania
10.3.1.7.1 Romania Intelligent Platform Management Interface (IPMI) Market Estimates and Forecasts, by Component (2020-2032) (USD Billion)
10.3.1.7.2 Romania Intelligent Platform Management Interface (IPMI) Market Estimates and Forecasts, by Application (2020-2032) (USD Billion)
10.3.1.7.3 Romania Intelligent Platform Management Interface (IPMI) Market Estimates and Forecasts, by Verticals (2020-2032) (USD Billion)
10.3.1.8 Hungary
10.3.1.8.1 Hungary Intelligent Platform Management Interface (IPMI) Market Estimates and Forecasts, by Component (2020-2032) (USD Billion)
10.3.1.8.2 Hungary Intelligent Platform Management Interface (IPMI) Market Estimates and Forecasts, by Application (2020-2032) (USD Billion)
10.3.1.8.3 Hungary Intelligent Platform Management Interface (IPMI) Market Estimates and Forecasts, by Verticals (2020-2032) (USD Billion)
10.3.1.9 Turkey
10.3.1.9.1 Turkey Intelligent Platform Management Interface (IPMI) Market Estimates and Forecasts, by Component (2020-2032) (USD Billion)
10.3.1.9.2 Turkey Intelligent Platform Management Interface (IPMI) Market Estimates and Forecasts, by Application (2020-2032) (USD Billion)
10.3.1.9.3 Turkey Intelligent Platform Management Interface (IPMI) Market Estimates and Forecasts, by Verticals (2020-2032) (USD Billion)
10.3.1.10 Rest of Eastern Europe
10.3.1.10.1 Rest of Eastern Europe Intelligent Platform Management Interface (IPMI) Market Estimates and Forecasts, by Component (2020-2032) (USD Billion)
10.3.1.10.2 Rest of Eastern Europe Intelligent Platform Management Interface (IPMI) Market Estimates and Forecasts, by Application (2020-2032) (USD Billion)
10.3.1.10.3 Rest of Eastern Europe Intelligent Platform Management Interface (IPMI) Market Estimates and Forecasts, by Verticals (2020-2032) (USD Billion)
10.3.2 Western Europe
10.3.2.1 Trends Analysis
10.3.2.2 Western Europe Intelligent Platform Management Interface (IPMI) Market Estimates and Forecasts, by Country (2020-2032) (USD Billion)
10.3.2.3 Western Europe Intelligent Platform Management Interface (IPMI) Market Estimates and Forecasts, by Component (2020-2032) (USD Billion)
10.3.2.4 Western Europe Intelligent Platform Management Interface (IPMI) Market Estimates and Forecasts, by Application (2020-2032) (USD Billion)
10.3.2.5 Western Europe Intelligent Platform Management Interface (IPMI) Market Estimates and Forecasts, by Verticals (2020-2032) (USD Billion)
10.3.2.6 Germany
10.3.2.6.1 Germany Intelligent Platform Management Interface (IPMI) Market Estimates and Forecasts, by Component (2020-2032) (USD Billion)
10.3.2.6.2 Germany Intelligent Platform Management Interface (IPMI) Market Estimates and Forecasts, by Application (2020-2032) (USD Billion)
10.3.2.6.3 Germany Intelligent Platform Management Interface (IPMI) Market Estimates and Forecasts, by Verticals (2020-2032) (USD Billion)
10.3.2.7 France
10.3.2.7.1 France Intelligent Platform Management Interface (IPMI) Market Estimates and Forecasts, by Component (2020-2032) (USD Billion)
10.3.2.7.2 France Intelligent Platform Management Interface (IPMI) Market Estimates and Forecasts, by Application (2020-2032) (USD Billion)
10.3.2.7.3 France Intelligent Platform Management Interface (IPMI) Market Estimates and Forecasts, by Verticals (2020-2032) (USD Billion)
10.3.2.8 UK
10.3.2.8.1 UK Intelligent Platform Management Interface (IPMI) Market Estimates and Forecasts, by Component (2020-2032) (USD Billion)
10.3.2.8.2 UK Intelligent Platform Management Interface (IPMI) Market Estimates and Forecasts, by Application (2020-2032) (USD Billion)
10.3.2.8.3 UK Intelligent Platform Management Interface (IPMI) Market Estimates and Forecasts, by Verticals (2020-2032) (USD Billion)
10.3.2.9 Italy
10.3.2.9.1 Italy Intelligent Platform Management Interface (IPMI) Market Estimates and Forecasts, by Component (2020-2032) (USD Billion)
10.3.2.9.2 Italy Intelligent Platform Management Interface (IPMI) Market Estimates and Forecasts, by Application (2020-2032) (USD Billion)
10.3.2.9.3 Italy Intelligent Platform Management Interface (IPMI) Market Estimates and Forecasts, by Verticals (2020-2032) (USD Billion)
10.3.2.10 Spain
10.3.2.10.1 Spain Intelligent Platform Management Interface (IPMI) Market Estimates and Forecasts, by Component (2020-2032) (USD Billion)
10.3.2.10.2 Spain Intelligent Platform Management Interface (IPMI) Market Estimates and Forecasts, by Application (2020-2032) (USD Billion)
10.3.2.10.3 Spain Intelligent Platform Management Interface (IPMI) Market Estimates and Forecasts, by Verticals (2020-2032) (USD Billion)
10.3.2.11 Netherlands
10.3.2.11.1 Netherlands Intelligent Platform Management Interface (IPMI) Market Estimates and Forecasts, by Component (2020-2032) (USD Billion)
10.3.2.11.2 Netherlands Intelligent Platform Management Interface (IPMI) Market Estimates and Forecasts, by Application (2020-2032) (USD Billion)
10.3.2.11.3 Netherlands Intelligent Platform Management Interface (IPMI) Market Estimates and Forecasts, by Verticals (2020-2032) (USD Billion)
10.3.2.12 Switzerland
10.3.2.12.1 Switzerland Intelligent Platform Management Interface (IPMI) Market Estimates and Forecasts, by Component (2020-2032) (USD Billion)
10.3.2.12.2 Switzerland Intelligent Platform Management Interface (IPMI) Market Estimates and Forecasts, by Application (2020-2032) (USD Billion)
10.3.2.12.3 Switzerland Intelligent Platform Management Interface (IPMI) Market Estimates and Forecasts, by Verticals (2020-2032) (USD Billion)
10.3.2.13 Austria
10.3.2.13.1 Austria Intelligent Platform Management Interface (IPMI) Market Estimates and Forecasts, by Component (2020-2032) (USD Billion)
10.3.2.13.2 Austria Intelligent Platform Management Interface (IPMI) Market Estimates and Forecasts, by Application (2020-2032) (USD Billion)
10.3.2.13.3 Austria Intelligent Platform Management Interface (IPMI) Market Estimates and Forecasts, by Verticals (2020-2032) (USD Billion)
10.3.2.14 Rest of Western Europe
10.3.2.14.1 Rest of Western Europe Intelligent Platform Management Interface (IPMI) Market Estimates and Forecasts, by Component (2020-2032) (USD Billion)
10.3.2.14.2 Rest of Western Europe Intelligent Platform Management Interface (IPMI) Market Estimates and Forecasts, by Application (2020-2032) (USD Billion)
10.3.2.14.3 Rest of Western Europe Intelligent Platform Management Interface (IPMI) Market Estimates and Forecasts, by Verticals (2020-2032) (USD Billion)
10.4 Asia Pacific
10.4.1 Trends Analysis
10.4.2 Asia Pacific Intelligent Platform Management Interface (IPMI) Market Estimates and Forecasts, by Country (2020-2032) (USD Billion)
10.4.3 Asia Pacific Intelligent Platform Management Interface (IPMI) Market Estimates and Forecasts, by Component (2020-2032) (USD Billion)
10.4.4 Asia Pacific Intelligent Platform Management Interface (IPMI) Market Estimates and Forecasts, by Application (2020-2032) (USD Billion)
10.4.5 Asia Pacific Intelligent Platform Management Interface (IPMI) Market Estimates and Forecasts, by Verticals (2020-2032) (USD Billion)
10.4.6 China
10.4.6.1 China Intelligent Platform Management Interface (IPMI) Market Estimates and Forecasts, by Component (2020-2032) (USD Billion)
10.4.6.2 China Intelligent Platform Management Interface (IPMI) Market Estimates and Forecasts, by Application (2020-2032) (USD Billion)
10.4.6.3 China Intelligent Platform Management Interface (IPMI) Market Estimates and Forecasts, by Verticals (2020-2032) (USD Billion)
10.4.7 India
10.4.7.1 India Intelligent Platform Management Interface (IPMI) Market Estimates and Forecasts, by Component (2020-2032) (USD Billion)
10.4.7.2 India Intelligent Platform Management Interface (IPMI) Market Estimates and Forecasts, by Application (2020-2032) (USD Billion)
10.4.7.3 India Intelligent Platform Management Interface (IPMI) Market Estimates and Forecasts, by Verticals (2020-2032) (USD Billion)
10.4.8 Japan
10.4.8.1 Japan Intelligent Platform Management Interface (IPMI) Market Estimates and Forecasts, by Component (2020-2032) (USD Billion)
10.4.8.2 Japan Intelligent Platform Management Interface (IPMI) Market Estimates and Forecasts, by Application (2020-2032) (USD Billion)
10.4.8.3 Japan Intelligent Platform Management Interface (IPMI) Market Estimates and Forecasts, by Verticals (2020-2032) (USD Billion)
10.4.9 South Korea
10.4.9.1 South Korea Intelligent Platform Management Interface (IPMI) Market Estimates and Forecasts, by Component (2020-2032) (USD Billion)
10.4.9.2 South Korea Intelligent Platform Management Interface (IPMI) Market Estimates and Forecasts, by Application (2020-2032) (USD Billion)
10.4.9.3 South Korea Intelligent Platform Management Interface (IPMI) Market Estimates and Forecasts, by Verticals (2020-2032) (USD Billion)
10.4.10 Vietnam
10.4.10.1 Vietnam Intelligent Platform Management Interface (IPMI) Market Estimates and Forecasts, by Component (2020-2032) (USD Billion)
10.4.10.2 Vietnam Intelligent Platform Management Interface (IPMI) Market Estimates and Forecasts, by Application (2020-2032) (USD Billion)
10.4.10.3 Vietnam Intelligent Platform Management Interface (IPMI) Market Estimates and Forecasts, by Verticals (2020-2032) (USD Billion)
10.4.11 Singapore
10.4.11.1 Singapore Intelligent Platform Management Interface (IPMI) Market Estimates and Forecasts, by Component (2020-2032) (USD Billion)
10.4.11.2 Singapore Intelligent Platform Management Interface (IPMI) Market Estimates and Forecasts, by Application (2020-2032) (USD Billion)
10.4.11.3 Singapore Intelligent Platform Management Interface (IPMI) Market Estimates and Forecasts, by Verticals (2020-2032) (USD Billion)
10.4.12 Australia
10.4.12.1 Australia Intelligent Platform Management Interface (IPMI) Market Estimates and Forecasts, by Component (2020-2032) (USD Billion)
10.4.12.2 Australia Intelligent Platform Management Interface (IPMI) Market Estimates and Forecasts, by Application (2020-2032) (USD Billion)
10.4.12.3 Australia Intelligent Platform Management Interface (IPMI) Market Estimates and Forecasts, by Verticals (2020-2032) (USD Billion)
10.4.13 Rest of Asia Pacific
10.4.13.1 Rest of Asia Pacific Intelligent Platform Management Interface (IPMI) Market Estimates and Forecasts, by Component (2020-2032) (USD Billion)
10.4.13.2 Rest of Asia Pacific Intelligent Platform Management Interface (IPMI) Market Estimates and Forecasts, by Application (2020-2032) (USD Billion)
10.4.13.3 Rest of Asia Pacific Intelligent Platform Management Interface (IPMI) Market Estimates and Forecasts, by Verticals (2020-2032) (USD Billion)
10.5 Middle East and Africa
10.5.1 Middle East
10.5.1.1 Trends Analysis
10.5.1.2 Middle East Intelligent Platform Management Interface (IPMI) Market Estimates and Forecasts, by Country (2020-2032) (USD Billion)
10.5.1.3 Middle East Intelligent Platform Management Interface (IPMI) Market Estimates and Forecasts, by Component (2020-2032) (USD Billion)
10.5.1.4 Middle East Intelligent Platform Management Interface (IPMI) Market Estimates and Forecasts, by Application (2020-2032) (USD Billion)
10.5.1.5 Middle East Intelligent Platform Management Interface (IPMI) Market Estimates and Forecasts, by Verticals (2020-2032) (USD Billion)
10.5.1.6 UAE
10.5.1.6.1 UAE Intelligent Platform Management Interface (IPMI) Market Estimates and Forecasts, by Component (2020-2032) (USD Billion)
10.5.1.6.2 UAE Intelligent Platform Management Interface (IPMI) Market Estimates and Forecasts, by Application (2020-2032) (USD Billion)
10.5.1.6.3 UAE Intelligent Platform Management Interface (IPMI) Market Estimates and Forecasts, by Verticals (2020-2032) (USD Billion)
10.5.1.7 Egypt
10.5.1.7.1 Egypt Intelligent Platform Management Interface (IPMI) Market Estimates and Forecasts, by Component (2020-2032) (USD Billion)
10.5.1.7.2 Egypt Intelligent Platform Management Interface (IPMI) Market Estimates and Forecasts, by Application (2020-2032) (USD Billion)
10.5.1.7.3 Egypt Intelligent Platform Management Interface (IPMI) Market Estimates and Forecasts, by Verticals (2020-2032) (USD Billion)
10.5.1.8 Saudi Arabia
10.5.1.8.1 Saudi Arabia Intelligent Platform Management Interface (IPMI) Market Estimates and Forecasts, by Component (2020-2032) (USD Billion)
10.5.1.8.2 Saudi Arabia Intelligent Platform Management Interface (IPMI) Market Estimates and Forecasts, by Application (2020-2032) (USD Billion)
10.5.1.8.3 Saudi Arabia Intelligent Platform Management Interface (IPMI) Market Estimates and Forecasts, by Verticals (2020-2032) (USD Billion)
10.5.1.9 Qatar
10.5.1.9.1 Qatar Intelligent Platform Management Interface (IPMI) Market Estimates and Forecasts, by Component (2020-2032) (USD Billion)
10.5.1.9.2 Qatar Intelligent Platform Management Interface (IPMI) Market Estimates and Forecasts, by Application (2020-2032) (USD Billion)
10.5.1.9.3 Qatar Intelligent Platform Management Interface (IPMI) Market Estimates and Forecasts, by Verticals (2020-2032) (USD Billion)
10.5.1.10 Rest of Middle East
10.5.1.10.1 Rest of Middle East Intelligent Platform Management Interface (IPMI) Market Estimates and Forecasts, by Component (2020-2032) (USD Billion)
10.5.1.10.2 Rest of Middle East Intelligent Platform Management Interface (IPMI) Market Estimates and Forecasts, by Application (2020-2032) (USD Billion)
10.5.1.10.3 Rest of Middle East Intelligent Platform Management Interface (IPMI) Market Estimates and Forecasts, by Verticals (2020-2032) (USD Billion)
10.5.2 Africa
10.5.2.1 Trends Analysis
10.5.2.2 Africa Intelligent Platform Management Interface (IPMI) Market Estimates and Forecasts, by Country (2020-2032) (USD Billion)
10.5.2.3 Africa Intelligent Platform Management Interface (IPMI) Market Estimates and Forecasts, by Component (2020-2032) (USD Billion)
10.5.2.4 Africa Intelligent Platform Management Interface (IPMI) Market Estimates and Forecasts, by Application (2020-2032) (USD Billion)
10.5.2.5 Africa Intelligent Platform Management Interface (IPMI) Market Estimates and Forecasts, by Verticals (2020-2032) (USD Billion)
10.5.2.6 South Africa
10.5.2.6.1 South Africa Intelligent Platform Management Interface (IPMI) Market Estimates and Forecasts, by Component (2020-2032) (USD Billion)
10.5.2.6.2 South Africa Intelligent Platform Management Interface (IPMI) Market Estimates and Forecasts, by Application (2020-2032) (USD Billion)
10.5.2.6.3 South Africa Intelligent Platform Management Interface (IPMI) Market Estimates and Forecasts, by Verticals (2020-2032) (USD Billion)
10.5.2.7 Nigeria
10.5.2.7.1 Nigeria Intelligent Platform Management Interface (IPMI) Market Estimates and Forecasts, by Component (2020-2032) (USD Billion)
10.5.2.7.2 Nigeria Intelligent Platform Management Interface (IPMI) Market Estimates and Forecasts, by Application (2020-2032) (USD Billion)
10.5.2.7.3 Nigeria Intelligent Platform Management Interface (IPMI) Market Estimates and Forecasts, by Verticals (2020-2032) (USD Billion)
10.5.2.8 Rest of Africa
10.5.2.8.1 Rest of Africa Intelligent Platform Management Interface (IPMI) Market Estimates and Forecasts, by Component (2020-2032) (USD Billion)
10.5.2.8.2 Rest of Africa Intelligent Platform Management Interface (IPMI) Market Estimates and Forecasts, by Application (2020-2032) (USD Billion)
10.5.2.8.3 Rest of Africa Intelligent Platform Management Interface (IPMI) Market Estimates and Forecasts, by Verticals (2020-2032) (USD Billion)
10.6 Latin America
10.6.1 Trends Analysis
10.6.2 Latin America Intelligent Platform Management Interface (IPMI) Market Estimates and Forecasts, by Country (2020-2032) (USD Billion)
10.6.3 Latin America Intelligent Platform Management Interface (IPMI) Market Estimates and Forecasts, by Component (2020-2032) (USD Billion)
10.6.4 Latin America Intelligent Platform Management Interface (IPMI) Market Estimates and Forecasts, by Application (2020-2032) (USD Billion)
10.6.5 Latin America Intelligent Platform Management Interface (IPMI) Market Estimates and Forecasts, by Verticals (2020-2032) (USD Billion)
10.6.6 Brazil
10.6.6.1 Brazil Intelligent Platform Management Interface (IPMI) Market Estimates and Forecasts, by Component (2020-2032) (USD Billion)
10.6.6.2 Brazil Intelligent Platform Management Interface (IPMI) Market Estimates and Forecasts, by Application (2020-2032) (USD Billion)
10.6.6.3 Brazil Intelligent Platform Management Interface (IPMI) Market Estimates and Forecasts, by Verticals (2020-2032) (USD Billion)
10.6.7 Argentina
10.6.7.1 Argentina Intelligent Platform Management Interface (IPMI) Market Estimates and Forecasts, by Component (2020-2032) (USD Billion)
10.6.7.2 Argentina Intelligent Platform Management Interface (IPMI) Market Estimates and Forecasts, by Application (2020-2032) (USD Billion)
10.6.7.3 Argentina Intelligent Platform Management Interface (IPMI) Market Estimates and Forecasts, by Verticals (2020-2032) (USD Billion)
10.6.8 Colombia
10.6.8.1 Colombia Intelligent Platform Management Interface (IPMI) Market Estimates and Forecasts, by Component (2020-2032) (USD Billion)
10.6.8.2 Colombia Intelligent Platform Management Interface (IPMI) Market Estimates and Forecasts, by Application (2020-2032) (USD Billion)
10.6.8.3 Colombia Intelligent Platform Management Interface (IPMI) Market Estimates and Forecasts, by Verticals (2020-2032) (USD Billion)
10.6.9 Rest of Latin America
10.6.9.1 Rest of Latin America Intelligent Platform Management Interface (IPMI) Market Estimates and Forecasts, by Component (2020-2032) (USD Billion)
10.6.9.2 Rest of Latin America Intelligent Platform Management Interface (IPMI) Market Estimates and Forecasts, by Application (2020-2032) (USD Billion)
10.6.9.3 Rest of Latin America Intelligent Platform Management Interface (IPMI) Market Estimates and Forecasts, by Verticals (2020-2032) (USD Billion)
11. Company Profiles
11.1 Intel Corporation
11.1.1 Company Overview
11.1.2 Financial
11.1.3 Products/ Services Offered
11.1.4 SWOT Analysis
11.2 RM Holdings Inc.
11.2.1 Company Overview
11.2.2 Financial
11.2.3 Products/ Services Offered
11.2.4 SWOT Analysis
11.3 Emerson
11.3.1 Company Overview
11.3.2 Financial
11.3.3 Products/ Services Offered
11.3.4 SWOT Analysis
11.4 NEC Corporation
11.4.1 Company Overview
11.4.2 Financial
11.4.3 Products/ Services Offered
11.4.4 SWOT Analysis
11.5 Super Micro Computer, Inc.
11.5.1 Company Overview
11.5.2 Financial
11.5.3 Products/ Services Offered
11.5.4 SWOT Analysis
11.6 Cisco
11.6.1 Company Overview
11.6.2 Financial
11.6.3 Products/ Services Offered
11.6.4 SWOT Analysis
11.7 Dell, Inc.
11.7.1 Company Overview
11.7.2 Financial
11.7.3 Products/ Services Offered
11.7.4 SWOT Analysis
11.8 Hewlett Packard Enterprise
11.8.1 Company Overview
11.8.2 Financial
11.8.3 Products/ Services Offered
11.8.4 SWOT Analysis
11.9 Microsoft
11.9.1 Company Overview
11.9.2 Financial
11.9.3 Products/ Services Offered
11.9.4 SWOT Analysis
11.10 Softlayer Technologies, Inc.
11.10.1 Company Overview
11.10.2 Financial
11.10.3 Products/ Services Offered
11.10.4 SWOT Analysis
12. Use Cases and Best Practices
13. Conclusion
An accurate research report requires proper strategizing as well as implementation. There are multiple factors involved in the completion of good and accurate research report and selecting the best methodology to compete the research is the toughest part. Since the research reports we provide play a crucial role in any company’s decision-making process, therefore we at SNS Insider always believe that we should choose the best method which gives us results closer to reality. This allows us to reach at a stage wherein we can provide our clients best and accurate investment to output ratio.
Each report that we prepare takes a timeframe of 350-400 business hours for production. Starting from the selection of titles through a couple of in-depth brain storming session to the final QC process before uploading our titles on our website we dedicate around 350 working hours. The titles are selected based on their current market cap and the foreseen CAGR and growth.
The 5 steps process:
Step 1: Secondary Research:
Secondary Research or Desk Research is as the name suggests is a research process wherein, we collect data through the readily available information. In this process we use various paid and unpaid databases which our team has access to and gather data through the same. This includes examining of listed companies’ annual reports, Journals, SEC filling etc. Apart from this our team has access to various associations across the globe across different industries. Lastly, we have exchange relationships with various university as well as individual libraries.

Step 2: Primary Research
When we talk about primary research, it is a type of study in which the researchers collect relevant data samples directly, rather than relying on previously collected data. This type of research is focused on gaining content specific facts that can be sued to solve specific problems. Since the collected data is fresh and first hand therefore it makes the study more accurate and genuine.
We at SNS Insider have divided Primary Research into 2 parts.
Part 1 wherein we interview the KOLs of major players as well as the upcoming ones across various geographic regions. This allows us to have their view over the market scenario and acts as an important tool to come closer to the accurate market numbers. As many as 45 paid and unpaid primary interviews are taken from both the demand and supply side of the industry to make sure we land at an accurate judgement and analysis of the market.
This step involves the triangulation of data wherein our team analyses the interview transcripts, online survey responses and observation of on filed participants. The below mentioned chart should give a better understanding of the part 1 of the primary interview.

Part 2: In this part of primary research the data collected via secondary research and the part 1 of the primary research is validated with the interviews from individual consultants and subject matter experts.
Consultants are those set of people who have at least 12 years of experience and expertise within the industry whereas Subject Matter Experts are those with at least 15 years of experience behind their back within the same space. The data with the help of two main processes i.e., FGDs (Focused Group Discussions) and IDs (Individual Discussions). This gives us a 3rd party nonbiased primary view of the market scenario making it a more dependable one while collation of the data pointers.
Step 3: Data Bank Validation
Once all the information is collected via primary and secondary sources, we run that information for data validation. At our intelligence centre our research heads track a lot of information related to the market which includes the quarterly reports, the daily stock prices, and other relevant information. Our data bank server gets updated every fortnight and that is how the information which we collected using our primary and secondary information is revalidated in real time.

Step 4: QA/QC Process
After all the data collection and validation our team does a final level of quality check and quality assurance to get rid of any unwanted or undesired mistakes. This might include but not limited to getting rid of the any typos, duplication of numbers or missing of any important information. The people involved in this process include technical content writers, research heads and graphics people. Once this process is completed the title gets uploader on our platform for our clients to read it.
Step 5: Final QC/QA Process:
This is the last process and comes when the client has ordered the study. In this process a final QA/QC is done before the study is emailed to the client. Since we believe in giving our clients a good experience of our research studies, therefore, to make sure that we do not lack at our end in any way humanly possible we do a final round of quality check and then dispatch the study to the client.
By Pollutant Type
Biological
Physical
Chemical
By Product Type
Portable
Fixed
By End-User
Residential
Commercial Buildings
Industrial
Government Buildings
Request for Segment Customization as per your Business Requirement: Segment Customization Request
Regional Coverage:
North America
US
Canada
Mexico
Europe
Eastern Europe
Poland
Romania
Hungary
Turkey
Rest of Eastern Europe
Western Europe
Germany
France
UK
Italy
Spain
Netherlands
Switzerland
Austria
Rest of Western Europe
Asia Pacific
China
India
Japan
South Korea
Vietnam
Singapore
Australia
Rest of Asia Pacific
Middle East & Africa
Middle East
UAE
Egypt
Saudi Arabia
Qatar
Rest of Middle East
Africa
Nigeria
South Africa
Rest of Africa
Latin America
Brazil
Argentina
Colombia
Rest of Latin America
Request for Country Level Research Report: Country Level Customization Request
Available Customization
With the given market data, SNS Insider offers customization as per the company’s specific needs. The following customization options are available for the report:
Detailed Volume Analysis
Criss-Cross segment analysis (e.g. Product X Application)
Competitive Product Benchmarking
Geographic Analysis
Additional countries in any of the regions
Customized Data Representation
Detailed analysis and profiling of additional market players
The Substrate-Like PCB Market was valued at USD 1.93 billion in 2023 and is expected to reach USD 6.57 billion by 2032, growing at a CAGR of 14.66% over the forecast period 2024-2032.
The Drip Irrigation Market size was valued at USD 5.81 billion in 2023 and is expected to grow to USD 12.29 billion by 2032 and grow at a CAGR of 9.8% over the forecast period of 2024-2032.
The Desiccant Dehumidifier Market was valued at USD 595.21 Million in 2023 and is projected to reach USD 1012.25 Million by 2032, growing at a CAGR of 6.08% from 2024 to 2032.
The Simultaneous Localization and Mapping (SLAM) Market valued at USD 478.45 million in 2023 and is expected to grow at a CAGR of 36.43% During 2024-2032.
The Virtual Reality in Retail Market Size was valued at USD 3.33 Billion in 2023 and is expected to grow at a CAGR of 26.2% to reach USD 26.28 Billion by 2032.
The Purpose-built Backup Appliance (PBBA) Market was valued at 7.39 Billion in 2023 and is projected to reach USD 18.04 Billion by 2032, growing at a CAGR of 10.43% from 2024 to 2032.

Hi! Click one of our member below to chat on Phone
© 2025 All Rights Reserved by SNS Insider Pvt Ltd


