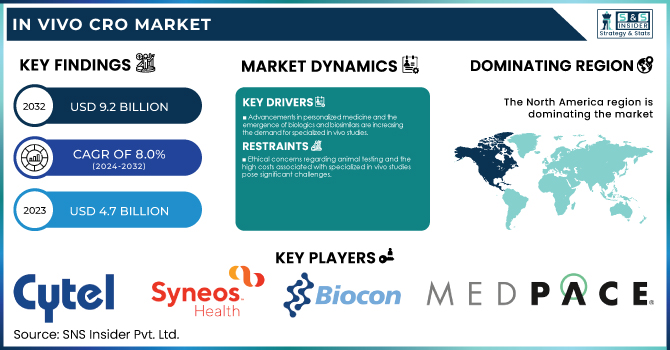
In Vivo CRO Market was valued at USD 4.7 billion in 2023 and is expected to reach USD 9.2 billion by 2032, growing at a CAGR of 8% over the forecast period 2024-2032.
To Get more information on In Vivo CRO Market - Request Free Sample Report
The in vivo CRO market report presents key statistical insights and trends of the market, including incidence and prevalence of diseases to identify the demand for in vivo research. This report discusses drug development timelines and the various ways CROs accelerate preclinical research. It also explores trends in investing, including how much pharmaceutical and biotech companies are funding. The report identifies trends in regulatory compliance, including information on FDA, EMA, and GLP. These insights offer a comprehensive view of the market’s evolution, growth drivers, and challenges shaping the industry. The growing demand for preclinical research and development services and an increase in investment of drug discovery and development are driving revenue growth of the In-Vivo CRO market. In 2023, the United States spent a reckoning $41.7 billion on biomedical research (NIH), including considerable funds on preclinical research.
Market Dynamics
Drivers
Advancements in personalized medicine and the emergence of biologics and biosimilars are increasing the demand for specialized in vivo studies.
Advancements in personalized medicine, along with the rise of biologics and biosimilars, are significantly driving the demand for specialized in vivo studies within the Contract Research Organization (CRO) market. Personalized medicine customizes treatments based on patient-specific profiles, which requires thorough in vivo tests to ascertain the safety and efficacy of such targeted therapies. In 2023, the FDA approved 16 new personalized treatments for rare disease patients, a substantial increase from six in 2022, highlighting the accelerated development in this sector. The biologics field, which includes highly complex molecules such as proteins and monoclonal antibodies, requires complex in vivo tests for their unique mechanisms of action and other properties. Likewise, extensive in vivo studies are required to establish biosimilarity for biological products that demonstrate high similarity to existing approved biologics. The growing burden of chronic diseases has also driven the demand for innovative biologic therapies and hence this has boosted the demand for in vivo CRO services. In addition, the sophisticated nature of new drug development has prompted pharmaceutical and biotechnology companies to outsource these services to dedicated CROs. The convergence of personalized medicine and the growth of biologics and biosimilars is propelling the in vivo CRO market, as these developments necessitate specialized preclinical studies to bring advanced therapies to market efficiently and safely.
Restraints:
Ethical concerns regarding animal testing and the high costs associated with specialized in vivo studies pose significant challenges.
The In Vivo Contract Research Organization (CRO) Market is significantly impacted by ethical concerns for animal testing. In 2022, France conducted nearly 2 million animal tests, contributing to approximately 10 million such tests across Europe annually. Animal experimentation is ineffective, with 95% of testing drugs that pass safety in animal studies subsequently failing in human clinical phase testing stages due either to toxicity or ineffectiveness. Such a discrepancy raises both ethical and scientific concerns, and there is a global movement toward alternative means of conducting research. Advanced methods such as organ-on-chip technologies and artificial intelligence provide both more predictive and economical solutions, decreasing dependence on models involving animals. Political initiatives in the U.S. and the Netherlands further promote this transition, but nevertheless, financial, regulatory, and validation challenges remain. The lack of standardized cruelty-free labeling further complicates consumer choices. Therefore, such ethical concerns, high costs, and regulatory complexities are major restraints for the In Vivo CRO market, emphasizing the demand for humane and efficient research methodologies.
Opportunities:
Expansion into emerging markets and the integration of advanced technologies, such as genetically modified animal models and non-invasive imaging techniques, offer growth prospects.
The In Vivo Contract Research Organisation (CRO) Market is expected to witness substantial growth, thanks to opportunities in developing economies and embrace for advanced technologies. There is a growing pharmaceutical and biotechnology industry in many emerging economies, especially Asian economies. This growth can be primarily attributed to the availability of affordable services in India and China, economic development, and advanced healthcare infrastructure. India is projected to have the highest CAGR in the region between forecast period, owing to the number of experts available in the country, coupled with low operational costs and recognition of intellectual property rights. In addition to geographical expansion, the integration of advanced technologies presents a substantial opportunity for in vivo CROs. The development of sophisticated animal models and in vivo imaging technologies enhances the accuracy and efficiency of preclinical studies. For example, the acquisition of SYNCROSOME by ETAP-Lab in October 2023 expanded ETAP-Lab's capabilities in offering advanced in vivo CRO services, thereby strengthening its position in the market. In summary, such technological advancements give CROs more tools to deliver more complete and relevant data for their pharmaceutical and biotechnology customers.
Challenges:
Stringent regulatory requirements and the variability in preclinical models can hinder the efficiency and reliability of in vivo testing.
The In Vivo Contract Research Organization (CRO) market is largely affected by stringent regulatory requirements and heterogeneity in preclinical models. In India, for instance, contract drug manufacturers often experience project initiation delays of 8 to 15 days, whereas their Chinese counterparts can commence within 3 days. The reason for this gap is mainly related to long approval times and complex regulatory requirements that limit the throughput of in vivo studies. Moreover, there are challenges in translating results from animal studies into human applications due to variability among the range of available preclinical models. Nevertheless, inter-species differences in disease pathology and physiology may introduce variability in the results, potentially impacting the process of drug development.
By Model Type
The rodents segment held the largest market share 80% of the market in 2023. The dominance of rodent models has several factors behind it, such as rodents and humans having a similar genetic basis, short life cycles, and cost-effectiveness for research. Rodents made up 95% of all animals used to conduct research in 2023, according to the U.S. Department of Agriculture (USDA), with mice comprising the overwhelming percentage at 61% and rats at 18%. According to the National Center for Biotechnology Information (NCBI), 2023 data indicated over 70% of published biomedical research papers incorporated rodent models. The extensive characterization of the genomes of rodents and the availability of transgenic strains also facilitates their use as an animal model for preclinical research. The NIH (National Institutes of Health) Knockout Mouse Project (KOMP) has produced more than 8,500 unique mouse strains that are useful in investigating their gene functions and disease mechanisms. Furthermore, the European Mouse Mutant Archive (EMMA) reported a 25% increase in requests for rodent models in 2023. The pharmaceutical industry's focus on developing targeted therapies and personalized medicine has also contributed to the popularity of rodent models. In 2023, the FDA approved 53 new drugs, and 85% of these underwent preclinical testing using rodent models. This trend highlights the importance of rodent-based research for drug development and the continued large share of this segment in the In Vivo CRO market.
By Modality
In 2023, the small molecules segment accounted for the majority of revenue. This is due to small molecule drugs being very relevant in the industrial context as well as their far-reaching application in preclinical studies. In the FDA's report, small molecules represented 62% of all new drug approvals in 2023, underlining their role in the drug development pipeline. The National Cancer Institute (NCI) reported that 75% of oncology drugs in clinical trials in 2023 were small molecules, further emphasizing their prevalence in therapeutic research. Small molecules continue to dominate in preclinical discovery due in part to their accessible pharmacokinetic properties and ease of optimization. The NIH's Molecular Libraries Program has screened over 500,000 small molecules for potential therapeutic applications, providing a vast resource for drug discovery efforts. Moreover, the public-private partnership known as the European Lead Factory highlighted a 30% increase in small molecule screening projects in 2023 over 2022. The cost-effectiveness and scalability of small-molecule production also contribute to their popularity in preclinical studies. The U.S. Government Accountability Office (GAO) reported that the average cost of developing a small molecule drug is approximately 20-30% lower than that of a biologic drug. The cost-effectiveness of these drugs, along with the established regulatory routes for small molecule drugs, continued to include importance in the In Vivo CRO market.
By Indication
In 2023, oncology was the leading in vivo CRO segment across the globe, with a revenue share of 28% This high market share can be attributed to the high prevalence of cancer around the globe and the need for new and effective therapies. According to the World Health Organization (WHO), cancer accounted for around 10 million deaths worldwide in 2023, making it one of the leading causes of death. According to the National Cancer Institute (NCI), cancer research funding in the USA reached $6.9 billion in the year 2023, with a 5% growth compared to last year. The U.S. Food & Drug Administration (FDA) reported a 20% increase in Investigational New Drug (IND) applications for cancer therapies in 2023 versus 2022, which supports a healthy pipeline of oncology drugs advancing into in vivo testing, according to the FDA's Oncology Center of Excellence. The European Medicines Agency (EMA) has also reported that in 2023 cancer treatments accounted for 35% of all marketing authorization applications.
The increasing popularity of personalized medicine and targeted therapies in oncology has additionally driven the growth of in vivo CRO services. The NIH's Cancer Genome Atlas Program has characterized over 20,000 primary cancer and matched normal samples spanning 33 cancer types, providing valuable data for developing targeted therapies. This wealth of genomic information has led to an increased focus on patient-derived xenograft (PDX) models, with the NCI's Patient-Derived Models Repository reporting a 40% increase in PDX model requests in 2023.
By GLP type
In 2023, the GLP toxicology segment held the largest revenue share of the market. The reason is the pivotal role of toxicology studies in establishing the safety of new drugs and medical devices prior to human trial. Mandatory Good Laboratory Practice (GLP) toxicology studies for all Investigational New Drug (IND) applications (FDA). In 2023 alone, the FDA granted more than 4,000 INDs, each of which required significant GLP toxicology data. This is complemented by the regulatory needs across the world in relation to GLP toxicology. According to the supporting document of the EMA, this trend was confirmed in 2023, with 95% of all marketing authorization applications containing GLP toxicology data. Over 30 countries belonging to the Organization for Economic Co-operation and Development (OECD) adhere to the OECD's guidelines for GLP studies, so that there is consistency and reliability in toxicology testing.
This growth can be attributed to the growing sophistication of new therapeutic modalities, including gene therapies and nanomedicines, among others, and an increased need for adequate GLP toxicology. The NIH's National Toxicology Program (NTP) reported a 25% increase in requests for specialized toxicology studies for novel therapeutics in 2023 compared to the previous year. This trend underlines the increasing demand for advanced GLP toxicology services within the In Vivo CRO segment.
Regional Analysis
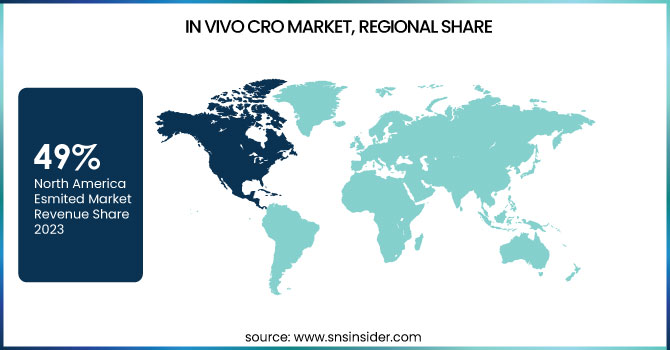
In 2023, North America led the In Vivo CRO market and held a market share of 49%. This leadership position is due to this region’s strong pharmaceutical and biotechnology industry, with large amounts of R&D being infused into it, especially in the last ten years. In 2023, the U.S. biopharmaceutical industry invested $102 billion in R&D, according to the Pharmaceutical Research and Manufacturers of America (PhRMA), up 5 percent from 2022. The national health agency of the United States NIH, is the largest public funder for biomedical research worldwide, investing $41.7 billion toward research grants in 2023 which will also help propel growth of the In Vivo CRO market in the region.
The Asia Pacific region is projected to grow with the fastest compound annual growth rate (CAGR) during the forecast period. This swift expansion is fueled by the rising outsourcing of preclinical research to countries like China and India, governmental initiatives to develop the life sciences industry, and the growing pharmaceutical market in the region. The "Pharma Vision 2023" policy of the Indian government aspires to establish India as a leading global player in drug manufacturing, resulting in a 15% upsurge in R&D investment by pharmaceutical companies in India in 2023. Similarly, China's "Healthy China 2030" plan has resulted in a 20% year-over-year increase in biomedical research funding in 2023, according to the National Natural Science Foundation of China.
Get Customized Report as per Your Business Requirement - Enquiry Now
Key Service Providers/Manufacturers
Cytel (East Horizon, Enforesys)
Syneos Health (Clinical Trial Services, Commercial Services)
ICON plc (Clinical Development Services, Commercialization Services)
Biocon (INSUGEN, BASALOG)
Medpace (Full-Service Clinical Trial Management, Central Laboratory Services)
Crown Bioscience International (PDX Models, In Vivo Pharmacology Services)
Charles River Laboratories (In Vivo Toxicology, Discovery Services)
Labcorp Drug Development (Preclinical In Vivo Studies, Clinical Trial Management)
WuXi AppTec (In Vivo Pharmacokinetics, Toxicology Services)
PRA Health Sciences (Clinical Research Services, Data Solutions)
Parexel International (Clinical Trial Management, Regulatory Consulting)
Covance (Nonclinical Safety Assessment, Clinical Development)
Envigo (In Vivo Pharmacology, Toxicology Testing)
Pharmaron (In Vivo DMPK Studies, Safety Assessment)
Frontage Laboratories (In Vivo Bioanalytical Services, Preclinical Studies)
Eurofins Scientific (In Vivo Toxicology, Pharmacokinetics)
MPI Research (In Vivo Safety Studies, Efficacy Testing)
QuintilesIMS (Clinical Trial Services, Real-World Evidence Solutions)
PPD (Pharmaceutical Product Development) (In Vivo Pharmacology, Clinical Development)
BASi (Bioanalytical Systems Inc.) (In Vivo Toxicology, Pharmacology Services)
Recent developments
In November 2024, Covance, a LabCorp company, launched a new AI-powered platform for analyzing in vivo imaging data, aimed at improving the efficiency and accuracy of preclinical studies. The platform has been reported to reduce analysis time by up to 40% in initial trials.
In March 2024, WuXi AppTec expanded its in vivo pharmacology capabilities by opening a new state-of-the-art facility in Suzhou, China. The facility is equipped with advanced technologies for conducting complex in vivo studies, particularly in the areas of immuno-oncology and neuroscience.
| Report Attributes | Details |
|---|---|
| Market Size in 2023 | USD 4.7 Billion |
| Market Size by 2032 | USD 9.2 Billion |
| CAGR | CAGR of 8.0% From 2024 to 2032 |
| Base Year | 2023 |
| Forecast Period | 2024-2032 |
| Historical Data | 2020-2022 |
| Report Scope & Coverage | Market Size, Segments Analysis, Competitive Landscape, Regional Analysis, DROC & SWOT Analysis, Forecast Outlook |
| Key Segments | • By Model Type (Rodent based, Non-Rodent base) • By Indication (Oncology, CNS Conditions, Diabetes, Obesity, Pain management, Autoimmune/inflammation conditions, Others) • By Modality (Small Molecules, Large Molecules) • By GLP Type (GLP Toxicology, Non GLP) |
| Regional Analysis/Coverage | North America (US, Canada, Mexico), Europe (Eastern Europe [Poland, Romania, Hungary, Turkey, Rest of Eastern Europe] Western Europe] Germany, France, UK, Italy, Spain, Netherlands, Switzerland, Austria, Rest of Western Europe]), Asia Pacific (China, India, Japan, South Korea, Vietnam, Singapore, Australia, Rest of Asia Pacific), Middle East & Africa (Middle East [UAE, Egypt, Saudi Arabia, Qatar, Rest of Middle East], Africa [Nigeria, South Africa, Rest of Africa], Latin America (Brazil, Argentina, Colombia, Rest of Latin America) |
| Company Profiles | Cytel, Syneos Health, ICON plc, Biocon, Medpace, Crown Bioscience International, Charles River Laboratories, Labcorp Drug Development, WuXi AppTec, PRA Health Sciences, Parexel International, Covance, Envigo, Pharmaron, Frontage Laboratories, Eurofins Scientific, MPI Research, QuintilesIMS, PPD (Pharmaceutical Product Development), BASi (Bioanalytical Systems Inc.) |
Ans. The projected market size for the In Vivo CRO Market is USD 9.2 Billion by 2032.
Ans: The North America region dominated the In Vivo CRO Market in 2023.
Ans. The CAGR of the In Vivo CRO Market is 8% During the forecast period of 2024-2032.
Ans:
Ans: The Rodent based Model Type segment dominated the In Vivo CRO Market.
Table of Contents
1. Introduction
1.1 Market Definition
1.2 Scope (Inclusion and Exclusions)
1.3 Research Assumptions
2. Executive Summary
2.1 Market Overview
2.2 Regional Synopsis
2.3 Competitive Summary
3. Research Methodology
3.1 Top-Down Approach
3.2 Bottom-up Approach
3.3. Data Validation
3.4 Primary Interviews
4. Market Dynamics Impact Analysis
4.1 Market Driving Factors Analysis
4.1.1 Drivers
4.1.2 Restraints
4.1.3 Opportunities
4.1.4 Challenges
4.2 PESTLE Analysis
4.3 Porter’s Five Forces Model
5. Statistical Insights and Trends Reporting
5.1 Incidence and Prevalence of Targeted Diseases (2023-2024)
5.2 Drug Development Timelines and In Vivo CRO Contribution (2023-2024)
5.3 Investment Trends in In Vivo CRO Market (2023-2024)
5.4 Regulatory Compliance and Standardization Trends (2023-2024)
6. Competitive Landscape
6.1 List of Major Companies, By Region
6.2 Market Share Analysis, By Region
6.3 Product Benchmarking
6.3.1 Product specifications and features
6.3.2 Pricing
6.4 Strategic Initiatives
6.4.1 Marketing and promotional activities
6.4.2 Distribution and Supply Chain Strategies
6.4.3 Expansion plans and new product launches
6.4.4 Strategic partnerships and collaborations
6.5 Technological Advancements
6.6 Market Positioning and Branding
7. In Vivo CRO Market Segmentation, By Model Type
7.1 Chapter Overview
7.2 Rodent based
7.2.1 Rodent based Market Trends Analysis (2020-2032)
7.2.2 Rodent based Market Size Estimates and Forecasts to 2032 (USD Billion)
7.2.3 Mice Models
7.2.3.1 Mice Models Market Trends Analysis (2020-2032)
7.2.3.2 Mice Models Market Size Estimates and Forecasts to 2032 (USD Billion)
7.2.4 Rat Models
7.2.4.1 Rat Models Market Trends Analysis (2020-2032)
7.2.4.2 Rat Models Market Size Estimates and Forecasts to 2032 (USD Billion)
7.2.5 Others
7.2.5.1 Others Market Trends Analysis (2020-2032)
7.2.5.2 Others Market Size Estimates and Forecasts to 2032 (USD Billion)
7.3 Non-Rodent base
7.3.1 Non-Rodent base Market Trends Analysis (2020-2032)
7.3.2 Non-Rodent base Market Size Estimates and Forecasts to 2032 (USD Billion)
8. In Vivo CRO Market Segmentation, By Indication
8.1 Chapter Overview
8.2 Oncology
8.2.1 Oncology Market Trends Analysis (2020-2032)
8.2.2 Oncology Market Size Estimates and Forecasts to 2032 (USD Billion)
8.2.3 Blood cancer
8.2.3.1 Blood cancer Market Trends Analysis (2020-2032)
8.2.3.2 Blood cancer Market Size Estimates and Forecasts to 2032 (USD Billion)
8.2.4 Solid tumor
8.2.4.1 Solid tumor Market Trends Analysis (2020-2032)
8.2.4.2 Solid tumor Market Size Estimates and Forecasts to 2032 (USD Billion)
8.2.4.3 Syngeneic model
8.2.4.3.1 Syngeneic model Market Trends Analysis (2020-2032)
8.2.4.3.2 Syngeneic model Market Size Estimates and Forecasts to 2032 (USD Billion)
8.2.4.4 Patient derived xenograft
8.2.4.4.1 Patient derived xenograft Market Trends Analysis (2020-2032)
8.2.4.4.2 Patient derived xenograft Market Size Estimates and Forecasts to 2032 (USD Billion)
8.2.4.5 Xenograft
8.2.4.5.1 Xenograft Market Trends Analysis (2020-2032)
8.2.4.5.2 Xenograft Market Size Estimates and Forecasts to 2032 (USD Billion)
8.2.5 Others
8.2.5.1 Others Market Trends Analysis (2020-2032)
8.2.5.2 Others Market Size Estimates and Forecasts to 2032 (USD Billion)
8.3 CNS Conditions
8.3.1 CNS Conditions Market Trends Analysis (2020-2032)
8.3.2 CNS Conditions Market Size Estimates and Forecasts to 2032 (USD Billion)
8.3.3 Epilepsy
8.3.3.1 Epilepsy Market Trends Analysis (2020-2032)
8.3.3.2 Epilepsy Market Size Estimates and Forecasts to 2032 (USD Billion)
8.3.4 Parkinson’s disease
8.3.4.1 Parkinson’s disease Market Trends Analysis (2020-2032)
8.3.4.2 Parkinson’s disease Market Size Estimates and Forecasts to 2032 (USD Billion)
8.3.5 Muscular Dystrophy
8.3.5.1 Muscular Dystrophy Market Trends Analysis (2020-2032)
8.3.5.2 Muscular Dystrophy Market Size Estimates and Forecasts to 2032 (USD Billion)
8.3.6 Huntington’s disease
8.3.6.1 Huntington’s disease Market Trends Analysis (2020-2032)
8.3.6.2 Huntington’s disease Market Size Estimates and Forecasts to 2032 (USD Billion)
8.3.7 Stroke
8.3.7.1 Stroke Market Trends Analysis (2020-2032)
8.3.7.2 Stroke Market Size Estimates and Forecasts to 2032 (USD Billion)
8.3.8 Alzheimer’s Disease
8.3.8.1 Alzheimer’s Disease Market Trends Analysis (2020-2032)
8.3.8.2 Alzheimer’s Disease Market Size Estimates and Forecasts to 2032 (USD Billion)
8.3.9 Muscle regeneration
8.3.9.1 Muscle regeneration Market Trends Analysis (2020-2032)
8.3.9.2 Muscle regeneration Market Size Estimates and Forecasts to 2032 (USD Billion)
8.3.10 Traumatic brain injury
8.3.10.1 Traumatic brain injury Market Trends Analysis (2020-2032)
8.3.10.2 Traumatic brain injury Market Size Estimates and Forecasts to 2032 (USD Billion)
8.3.11 Amyotrophic lateral sclerosis (ALS)
8.3.11.1 Amyotrophic lateral sclerosis (ALS) Market Trends Analysis (2020-2032)
8.3.11.2 Amyotrophic lateral sclerosis (ALS) Market Size Estimates and Forecasts to 2032 (USD Billion)
8.3.12 Spinal Muscular Atrophy
8.3.12.1 Spinal Muscular Atrophy Market Trends Analysis (2020-2032)
8.3.12.2 Spinal Muscular Atrophy Market Size Estimates and Forecasts to 2032 (USD Billion)
8.3.13 Other Neurodevelopment Disorders
8.3.13.1 Other Neurodevelopment Disorders Market Trends Analysis (2020-2032)
8.3.13.2 Other Neurodevelopment Disorders Market Size Estimates and Forecasts to 2032 (USD Billion)
8.4 Diabetes
8.4.1 Diabetes Market Trends Analysis (2020-2032)
8.4.2 Diabetes Market Size Estimates and Forecasts to 2032 (USD Billion)
8.5 Obesity
8.5.1 Obesity Market Trends Analysis (2020-2032)
8.5.2 Obesity Market Size Estimates and Forecasts to 2032 (USD Billion)
8.6 Pain management
8.6.1 Pain management Market Trends Analysis (2020-2032)
8.6.2 Pain management Market Size Estimates and Forecasts to 2032 (USD Billion)
8.6.3 Chronic pain
8.6.3.1 Chronic pain Market Trends Analysis (2020-2032)
8.6.3.2 Chronic pain Market Size Estimates and Forecasts to 2032 (USD Billion)
8.6.4 Acute pain
8.6.4.1 Acute pain Market Trends Analysis (2020-2032)
8.6.4.2 Acute pain Market Size Estimates and Forecasts to 2032 (USD Billion)
8.7 Autoimmune/inflammation conditions
8.7.1 Autoimmune/inflammation conditions Market Trends Analysis (2020-2032)
8.7.2 Autoimmune/inflammation conditions Market Size Estimates and Forecasts to 2032 (USD Billion)
8.7.3 Rheumatoid Arthritis
8.7.3.1 Rheumatoid Arthritis Market Trends Analysis (2020-2032)
8.7.3.2 Rheumatoid Arthritis Market Size Estimates and Forecasts to 2032 (USD Billion)
8.7.4 Irritable Bowel Syndrome
8.7.4.1 Irritable Bowel Syndrome Market Trends Analysis (2020-2032)
8.7.4.2 Irritable Bowel Syndrome Market Size Estimates and Forecasts to 2032 (USD Billion)
8.7.5 Multiple Sclerosis
8.7.5.1 Multiple Sclerosis Market Trends Analysis (2020-2032)
8.7.5.2 Multiple Sclerosis Market Size Estimates and Forecasts to 2032 (USD Billion)
8.7.6 Osteoarthritis
8.7.6.1 Osteoarthritis Market Trends Analysis (2020-2032)
8.7.6.2 Osteoarthritis Market Size Estimates and Forecasts to 2032 (USD Billion)
8.7.7 Others
8.7.7.1 Others Market Trends Analysis (2020-2032)
8.7.7.2 Others Market Size Estimates and Forecasts to 2032 (USD Billion)
8.8 Others
8.8.1 Others Market Trends Analysis (2020-2032)
8.8.2 Others Market Size Estimates and Forecasts to 2032 (USD Billion)
9. In Vivo CRO Market Segmentation, By Modality
9.1 Chapter Overview
9.2 Small Molecules
9.2.1 Small Molecules Market Trends Analysis (2020-2032)
9.2.2 Small Molecules Market Size Estimates and Forecasts to 2032 (USD Billion)
9.3 Large Molecules
9.3.1 Large Molecules Market Trends Analysis (2020-2032)
9.3.2 Large Molecules Market Size Estimates and Forecasts to 2032 (USD Billion)
9.3.3 Cell & Gene Therapy
9.3.3.1 Cell & Gene Therapy Market Trends Analysis (2020-2032)
9.3.3.2 Cell & Gene Therapy Market Size Estimates and Forecasts to 2032 (USD Billion)
9.2.3.3 CAR T-cell therapies
9.2.3.3.1 CAR T-cell therapies Market Trends Analysis (2020-2032)
9.2.3.3.2 CAR T-cell therapies Market Size Estimates and Forecasts to 2032 (USD Billion)
9.2.3.4 CAR-NK cell therapy
9.2.3.4.1 CAR-NK cell therapy Market Trends Analysis (2020-2032)
9.2.3.4.2 CAR-NK cell therapy Market Size Estimates and Forecasts to 2032 (USD Billion)
9.2.3.5 TCR-T cell therapy
9.2.3.5.1 TCR-T cell therapy Market Trends Analysis (2020-2032)
9.2.3.5.2 TCR-T cell therapy Market Size Estimates and Forecasts to 2032 (USD Billion)
9.2.3.6 Others
9.2.3.6.1 Others Market Trends Analysis (2020-2032)
9.2.3.6.2 Others Market Size Estimates and Forecasts to 2032 (USD Billion)
9.3.4 RNA Therapy
9.3.4.1 RNA Therapy Market Trends Analysis (2020-2032)
9.3.4.2 RNA Therapy Market Size Estimates and Forecasts to 2032 (USD Billion)
9.3.5 Others
9.3.5.1 Others Market Trends Analysis (2020-2032)
9.3.5.2 Others Market Size Estimates and Forecasts to 2032 (USD Billion)
10. In Vivo CRO Market Segmentation, By GLP Type
10.1 Chapter Overview
10.2 GLP Toxicology
10.2.1 GLP Toxicology Market Trends Analysis (2020-2032)
10.2.2 GLP Toxicology Market Size Estimates and Forecasts to 2032 (USD Billion)
10.3 Non GLP
10.3.1 Non GLP Market Trends Analysis (2020-2032)
10.3.2 Non GLP Market Size Estimates and Forecasts to 2032 (USD Billion)
11. Regional Analysis
11.1 Chapter Overview
11.2 North America
11.2.1 Trends Analysis
11.2.2 North America In Vivo CRO Market Estimates and Forecasts, by Country (2020-2032) (USD Billion)
11.2.3 North America In Vivo CRO Market Estimates and Forecasts, By Model Type (2020-2032) (USD Billion)
11.2.4 North America In Vivo CRO Market Estimates and Forecasts, By Indication (2020-2032) (USD Billion)
11.2.5 North America In Vivo CRO Market Estimates and Forecasts, By Modality (2020-2032) (USD Billion)
11.2.6 North America In Vivo CRO Market Estimates and Forecasts, By GLP Type (2020-2032) (USD Billion)
11.2.7 USA
11.2.7.1 USA In Vivo CRO Market Estimates and Forecasts, By Model Type (2020-2032) (USD Billion)
11.2.7.2 USA In Vivo CRO Market Estimates and Forecasts, By Indication (2020-2032) (USD Billion)
11.2.7.3 USA In Vivo CRO Market Estimates and Forecasts, By Modality (2020-2032) (USD Billion)
11.2.7.4 USA In Vivo CRO Market Estimates and Forecasts, By GLP Type (2020-2032) (USD Billion)
11.2.7 Canada
11.2.7.1 Canada In Vivo CRO Market Estimates and Forecasts, By Model Type (2020-2032) (USD Billion)
11.2.7.2 Canada In Vivo CRO Market Estimates and Forecasts, By Indication (2020-2032) (USD Billion)
11.2.7.3 Canada In Vivo CRO Market Estimates and Forecasts, By Modality (2020-2032) (USD Billion)
11.2.7.3 Canada In Vivo CRO Market Estimates and Forecasts, By GLP Type (2020-2032) (USD Billion)
11.2.8 Mexico
11.2.8.1 Mexico In Vivo CRO Market Estimates and Forecasts, By Model Type (2020-2032) (USD Billion)
11.2.8.2 Mexico In Vivo CRO Market Estimates and Forecasts, By Indication (2020-2032) (USD Billion)
11.2.8.3 Mexico In Vivo CRO Market Estimates and Forecasts, By Modality (2020-2032) (USD Billion)
11.2.8.3 Mexico In Vivo CRO Market Estimates and Forecasts, By GLP Type (2020-2032) (USD Billion)
11.3 Europe
11.3.1 Eastern Europe
11.3.1.1 Trends Analysis
11.3.1.2 Eastern Europe In Vivo CRO Market Estimates and Forecasts, by Country (2020-2032) (USD Billion)
11.3.1.3 Eastern Europe In Vivo CRO Market Estimates and Forecasts, By Model Type (2020-2032) (USD Billion)
11.3.1.4 Eastern Europe In Vivo CRO Market Estimates and Forecasts, By Indication (2020-2032) (USD Billion)
11.3.1.5 Eastern Europe In Vivo CRO Market Estimates and Forecasts, By Modality (2020-2032) (USD Billion)
11.3.1.5 Eastern Europe In Vivo CRO Market Estimates and Forecasts, By GLP Type (2020-2032) (USD Billion)
11.3.1.6 Poland
11.3.1.6.1 Poland In Vivo CRO Market Estimates and Forecasts, By Model Type (2020-2032) (USD Billion)
11.3.1.6.2 Poland In Vivo CRO Market Estimates and Forecasts, By Indication (2020-2032) (USD Billion)
11.3.1.6.3 Poland In Vivo CRO Market Estimates and Forecasts, By Modality (2020-2032) (USD Billion)
11.3.1.6.3 Poland In Vivo CRO Market Estimates and Forecasts, By GLP Type (2020-2032) (USD Billion)
11.3.1.7 Romania
11.3.1.7.1 Romania In Vivo CRO Market Estimates and Forecasts, By Model Type (2020-2032) (USD Billion)
11.3.1.7.2 Romania In Vivo CRO Market Estimates and Forecasts, By Indication (2020-2032) (USD Billion)
11.3.1.7.3 Romania In Vivo CRO Market Estimates and Forecasts, By Modality (2020-2032) (USD Billion)
11.3.1.7.3 Romania In Vivo CRO Market Estimates and Forecasts, By GLP Type (2020-2032) (USD Billion)
11.3.1.8 Hungary
11.3.1.8.1 Hungary In Vivo CRO Market Estimates and Forecasts, By Model Type (2020-2032) (USD Billion)
11.3.1.8.2 Hungary In Vivo CRO Market Estimates and Forecasts, By Indication (2020-2032) (USD Billion)
11.3.1.8.3 Hungary In Vivo CRO Market Estimates and Forecasts, By Modality (2020-2032) (USD Billion)
11.3.1.8.3 Hungary In Vivo CRO Market Estimates and Forecasts, By GLP Type (2020-2032) (USD Billion)
11.3.1.9 Turkey
11.3.1.9.1 Turkey In Vivo CRO Market Estimates and Forecasts, By Model Type (2020-2032) (USD Billion)
11.3.1.9.2 Turkey In Vivo CRO Market Estimates and Forecasts, By Indication (2020-2032) (USD Billion)
11.3.1.9.3 Turkey In Vivo CRO Market Estimates and Forecasts, By Modality (2020-2032) (USD Billion)
11.3.1.9.3 Turkey In Vivo CRO Market Estimates and Forecasts, By GLP Type (2020-2032) (USD Billion)
11.3.1.11 Rest of Eastern Europe
11.3.1.11.1 Rest of Eastern Europe In Vivo CRO Market Estimates and Forecasts, By Model Type (2020-2032) (USD Billion)
11.3.1.11.2 Rest of Eastern Europe In Vivo CRO Market Estimates and Forecasts, By Indication (2020-2032) (USD Billion)
11.3.1.11.3 Rest of Eastern Europe In Vivo CRO Market Estimates and Forecasts, By Modality (2020-2032) (USD Billion)
11.3.1.11.3 Rest of Eastern Europe In Vivo CRO Market Estimates and Forecasts, By GLP Type (2020-2032) (USD Billion)
11.3.2 Western Europe
11.3.2.1 Trends Analysis
11.3.2.2 Western Europe In Vivo CRO Market Estimates and Forecasts, by Country (2020-2032) (USD Billion)
11.3.2.3 Western Europe In Vivo CRO Market Estimates and Forecasts, By Model Type (2020-2032) (USD Billion)
11.3.2.4 Western Europe In Vivo CRO Market Estimates and Forecasts, By Indication (2020-2032) (USD Billion)
11.3.2.5 Western Europe In Vivo CRO Market Estimates and Forecasts, By Modality (2020-2032) (USD Billion)
11.3.2.5 Western Europe In Vivo CRO Market Estimates and Forecasts, By GLP Type (2020-2032) (USD Billion)
11.3.2.6 Germany
11.3.2.6.1 Germany In Vivo CRO Market Estimates and Forecasts, By Model Type (2020-2032) (USD Billion)
11.3.2.6.2 Germany In Vivo CRO Market Estimates and Forecasts, By Indication (2020-2032) (USD Billion)
11.3.2.6.3 Germany In Vivo CRO Market Estimates and Forecasts, By Modality (2020-2032) (USD Billion)
11.3.2.6.3 Germany In Vivo CRO Market Estimates and Forecasts, By GLP Type (2020-2032) (USD Billion)
11.3.2.7 France
11.3.2.7.1 France In Vivo CRO Market Estimates and Forecasts, By Model Type (2020-2032) (USD Billion)
11.3.2.7.2 France In Vivo CRO Market Estimates and Forecasts, By Indication (2020-2032) (USD Billion)
11.3.2.7.3 France In Vivo CRO Market Estimates and Forecasts, By Modality (2020-2032) (USD Billion)
11.3.2.7.3 France In Vivo CRO Market Estimates and Forecasts, By GLP Type (2020-2032) (USD Billion)
11.3.2.8 UK
11.3.2.8.1 UK In Vivo CRO Market Estimates and Forecasts, By Model Type (2020-2032) (USD Billion)
11.3.2.8.2 UK In Vivo CRO Market Estimates and Forecasts, By Indication (2020-2032) (USD Billion)
11.3.2.8.3 UK In Vivo CRO Market Estimates and Forecasts, By Modality (2020-2032) (USD Billion)
11.3.2.8.3 UK In Vivo CRO Market Estimates and Forecasts, By GLP Type (2020-2032) (USD Billion)
11.3.2.9 Italy
11.3.2.9.1 Italy In Vivo CRO Market Estimates and Forecasts, By Model Type (2020-2032) (USD Billion)
11.3.2.9.2 Italy In Vivo CRO Market Estimates and Forecasts, By Indication (2020-2032) (USD Billion)
11.3.2.9.3 Italy In Vivo CRO Market Estimates and Forecasts, By Modality (2020-2032) (USD Billion)
11.3.2.9.3 Italy In Vivo CRO Market Estimates and Forecasts, By GLP Type (2020-2032) (USD Billion)
11.3.2.11 Spain
11.3.2.11.1 Spain In Vivo CRO Market Estimates and Forecasts, By Model Type (2020-2032) (USD Billion)
11.3.2.11.2 Spain In Vivo CRO Market Estimates and Forecasts, By Indication (2020-2032) (USD Billion)
11.3.2.11.3 Spain In Vivo CRO Market Estimates and Forecasts, By Modality (2020-2032) (USD Billion)
11.3.2.11.3 Spain In Vivo CRO Market Estimates and Forecasts, By GLP Type (2020-2032) (USD Billion)
11.3.2.11 Netherlands
11.3.2.11.1 Netherlands In Vivo CRO Market Estimates and Forecasts, By Model Type (2020-2032) (USD Billion)
11.3.2.11.2 Netherlands In Vivo CRO Market Estimates and Forecasts, By Indication (2020-2032) (USD Billion)
11.3.2.11.3 Netherlands In Vivo CRO Market Estimates and Forecasts, By Modality (2020-2032) (USD Billion)
11.3.2.11.3 Netherlands In Vivo CRO Market Estimates and Forecasts, By GLP Type (2020-2032) (USD Billion)
11.3.2.12 Switzerland
11.3.2.12.1 Switzerland In Vivo CRO Market Estimates and Forecasts, By Model Type (2020-2032) (USD Billion)
11.3.2.12.2 Switzerland In Vivo CRO Market Estimates and Forecasts, By Indication (2020-2032) (USD Billion)
11.3.2.12.3 Switzerland In Vivo CRO Market Estimates and Forecasts, By Modality (2020-2032) (USD Billion)
11.3.2.12.3 Switzerland In Vivo CRO Market Estimates and Forecasts, By GLP Type (2020-2032) (USD Billion)
11.3.2.13 Austria
11.3.2.13.1 Austria In Vivo CRO Market Estimates and Forecasts, By Model Type (2020-2032) (USD Billion)
11.3.2.13.2 Austria In Vivo CRO Market Estimates and Forecasts, By Indication (2020-2032) (USD Billion)
11.3.2.13.3 Austria In Vivo CRO Market Estimates and Forecasts, By Modality (2020-2032) (USD Billion)
11.3.2.13.3 Austria In Vivo CRO Market Estimates and Forecasts, By GLP Type (2020-2032) (USD Billion)
11.3.2.14 Rest of Western Europe
11.3.2.14.1 Rest of Western Europe In Vivo CRO Market Estimates and Forecasts, By Model Type (2020-2032) (USD Billion)
11.3.2.14.2 Rest of Western Europe In Vivo CRO Market Estimates and Forecasts, By Indication (2020-2032) (USD Billion)
11.3.2.14.3 Rest of Western Europe In Vivo CRO Market Estimates and Forecasts, By Modality (2020-2032) (USD Billion)
11.3.2.14.3 Rest of Western Europe In Vivo CRO Market Estimates and Forecasts, By GLP Type (2020-2032) (USD Billion)
11.4 Asia Pacific
11.4.1 Trends Analysis
11.4.2 Asia Pacific In Vivo CRO Market Estimates and Forecasts, by Country (2020-2032) (USD Billion)
11.4.3 Asia Pacific In Vivo CRO Market Estimates and Forecasts, By Model Type (2020-2032) (USD Billion)
11.4.4 Asia Pacific In Vivo CRO Market Estimates and Forecasts, By Indication (2020-2032) (USD Billion)
11.4.5 Asia Pacific In Vivo CRO Market Estimates and Forecasts, By Modality (2020-2032) (USD Billion)
11.4.5 Asia Pacific In Vivo CRO Market Estimates and Forecasts, By GLP Type (2020-2032) (USD Billion)
11.4.6 China
11.4.6.1 China In Vivo CRO Market Estimates and Forecasts, By Model Type (2020-2032) (USD Billion)
11.4.6.2 China In Vivo CRO Market Estimates and Forecasts, By Indication (2020-2032) (USD Billion)
11.4.6.3 China In Vivo CRO Market Estimates and Forecasts, By Modality (2020-2032) (USD Billion)
11.4.6.3 China In Vivo CRO Market Estimates and Forecasts, By GLP Type (2020-2032) (USD Billion)
11.4.7 India
11.4.7.1 India In Vivo CRO Market Estimates and Forecasts, By Model Type (2020-2032) (USD Billion)
11.4.7.2 India In Vivo CRO Market Estimates and Forecasts, By Indication (2020-2032) (USD Billion)
11.4.7.3 India In Vivo CRO Market Estimates and Forecasts, By Modality (2020-2032) (USD Billion)
11.4.7.3 India In Vivo CRO Market Estimates and Forecasts, By GLP Type (2020-2032) (USD Billion)
11.4.8 Japan
11.4.8.1 Japan In Vivo CRO Market Estimates and Forecasts, By Model Type (2020-2032) (USD Billion)
11.4.8.2 Japan In Vivo CRO Market Estimates and Forecasts, By Indication (2020-2032) (USD Billion)
11.4.8.3 Japan In Vivo CRO Market Estimates and Forecasts, By Modality (2020-2032) (USD Billion)
11.4.8.3 Japan In Vivo CRO Market Estimates and Forecasts, By GLP Type (2020-2032) (USD Billion)
11.4.9 South Korea
11.4.9.1 South Korea In Vivo CRO Market Estimates and Forecasts, By Model Type (2020-2032) (USD Billion)
11.4.9.2 South Korea In Vivo CRO Market Estimates and Forecasts, By Indication (2020-2032) (USD Billion)
11.4.9.3 South Korea In Vivo CRO Market Estimates and Forecasts, By Modality (2020-2032) (USD Billion)
11.4.9.3 South Korea In Vivo CRO Market Estimates and Forecasts, By GLP Type (2020-2032) (USD Billion)
11.4.11 Vietnam
11.4.11.1 Vietnam In Vivo CRO Market Estimates and Forecasts, By Model Type (2020-2032) (USD Billion)
11.4.11.2 Vietnam In Vivo CRO Market Estimates and Forecasts, By Indication (2020-2032) (USD Billion)
11.4.11.3 Vietnam In Vivo CRO Market Estimates and Forecasts, By Modality (2020-2032) (USD Billion)
11.4.11.3 Vietnam In Vivo CRO Market Estimates and Forecasts, By GLP Type (2020-2032) (USD Billion)
11.4.11 Singapore
11.4.11.1 Singapore In Vivo CRO Market Estimates and Forecasts, By Model Type (2020-2032) (USD Billion)
11.4.11.2 Singapore In Vivo CRO Market Estimates and Forecasts, By Indication (2020-2032) (USD Billion)
11.4.11.3 Singapore In Vivo CRO Market Estimates and Forecasts, By Modality (2020-2032) (USD Billion)
11.4.11.3 Singapore In Vivo CRO Market Estimates and Forecasts, By GLP Type (2020-2032) (USD Billion)
11.4.12 Australia
11.4.12.1 Australia In Vivo CRO Market Estimates and Forecasts, By Model Type (2020-2032) (USD Billion)
11.4.12.2 Australia In Vivo CRO Market Estimates and Forecasts, By Indication (2020-2032) (USD Billion)
11.4.12.3 Australia In Vivo CRO Market Estimates and Forecasts, By Modality (2020-2032) (USD Billion)
11.4.12.3 Australia In Vivo CRO Market Estimates and Forecasts, By GLP Type (2020-2032) (USD Billion)
11.4.13 Rest of Asia Pacific
11.4.13.1 Rest of Asia Pacific In Vivo CRO Market Estimates and Forecasts, By Model Type (2020-2032) (USD Billion)
11.4.13.2 Rest of Asia Pacific In Vivo CRO Market Estimates and Forecasts, By Indication (2020-2032) (USD Billion)
11.4.13.3 Rest of Asia Pacific In Vivo CRO Market Estimates and Forecasts, By Modality (2020-2032) (USD Billion)
11.4.13.3 Rest of Asia Pacific In Vivo CRO Market Estimates and Forecasts, By GLP Type (2020-2032) (USD Billion)
11.5 Middle East and Africa
11.5.1 Middle East
11.5.1.1 Trends Analysis
11.5.1.2 Middle East In Vivo CRO Market Estimates and Forecasts, by Country (2020-2032) (USD Billion)
11.5.1.3 Middle East In Vivo CRO Market Estimates and Forecasts, By Model Type (2020-2032) (USD Billion)
11.5.1.4 Middle East In Vivo CRO Market Estimates and Forecasts, By Indication (2020-2032) (USD Billion)
11.5.1.5 Middle East In Vivo CRO Market Estimates and Forecasts, By Modality (2020-2032) (USD Billion)
11.5.1.5 Middle East In Vivo CRO Market Estimates and Forecasts, By GLP Type (2020-2032) (USD Billion)
11.5.1.6 UAE
11.5.1.6.1 UAE In Vivo CRO Market Estimates and Forecasts, By Model Type (2020-2032) (USD Billion)
11.5.1.6.2 UAE In Vivo CRO Market Estimates and Forecasts, By Indication (2020-2032) (USD Billion)
11.5.1.6.3 UAE In Vivo CRO Market Estimates and Forecasts, By Modality (2020-2032) (USD Billion)
11.5.1.6.3 UAE In Vivo CRO Market Estimates and Forecasts, By GLP Type (2020-2032) (USD Billion)
11.5.1.7 Egypt
11.5.1.7.1 Egypt In Vivo CRO Market Estimates and Forecasts, By Model Type (2020-2032) (USD Billion)
11.5.1.7.2 Egypt In Vivo CRO Market Estimates and Forecasts, By Indication (2020-2032) (USD Billion)
11.5.1.7.3 Egypt In Vivo CRO Market Estimates and Forecasts, By Modality (2020-2032) (USD Billion)
11.5.1.7.3 Egypt In Vivo CRO Market Estimates and Forecasts, By GLP Type (2020-2032) (USD Billion)
11.5.1.8 Saudi Arabia
11.5.1.8.1 Saudi Arabia In Vivo CRO Market Estimates and Forecasts, By Model Type (2020-2032) (USD Billion)
11.5.1.8.2 Saudi Arabia In Vivo CRO Market Estimates and Forecasts, By Indication (2020-2032) (USD Billion)
11.5.1.8.3 Saudi Arabia In Vivo CRO Market Estimates and Forecasts, By Modality (2020-2032) (USD Billion)
11.5.1.8.3 Saudi Arabia In Vivo CRO Market Estimates and Forecasts, By GLP Type (2020-2032) (USD Billion)
11.5.1.9 Qatar
11.5.1.9.1 Qatar In Vivo CRO Market Estimates and Forecasts, By Model Type (2020-2032) (USD Billion)
11.5.1.9.2 Qatar In Vivo CRO Market Estimates and Forecasts, By Indication (2020-2032) (USD Billion)
11.5.1.9.3 Qatar In Vivo CRO Market Estimates and Forecasts, By Modality (2020-2032) (USD Billion)
11.5.1.9.3 Qatar In Vivo CRO Market Estimates and Forecasts, By GLP Type (2020-2032) (USD Billion)
11.5.1.11 Rest of Middle East
11.5.1.11.1 Rest of Middle East In Vivo CRO Market Estimates and Forecasts, By Model Type (2020-2032) (USD Billion)
11.5.1.11.2 Rest of Middle East In Vivo CRO Market Estimates and Forecasts, By Indication (2020-2032) (USD Billion)
11.5.1.11.3 Rest of Middle East In Vivo CRO Market Estimates and Forecasts, By Modality (2020-2032) (USD Billion)
11.5.1.11.3 Rest of Middle East In Vivo CRO Market Estimates and Forecasts, By GLP Type (2020-2032) (USD Billion)
11.5.2 Africa
11.5.2.1 Trends Analysis
11.5.2.2 Africa In Vivo CRO Market Estimates and Forecasts, by Country (2020-2032) (USD Billion)
11.5.2.3 Africa In Vivo CRO Market Estimates and Forecasts, By Model Type (2020-2032) (USD Billion)
11.5.2.4 Africa In Vivo CRO Market Estimates and Forecasts, By Indication (2020-2032) (USD Billion)
11.5.2.5 Africa In Vivo CRO Market Estimates and Forecasts, By Modality (2020-2032) (USD Billion)
11.5.2.8.3 Africa In Vivo CRO Market Estimates and Forecasts, By GLP Type (2020-2032) (USD Billion)
11.5.2.6 South Africa
11.5.2.6.1 South Africa In Vivo CRO Market Estimates and Forecasts, By Model Type (2020-2032) (USD Billion)
11.5.2.6.2 South Africa In Vivo CRO Market Estimates and Forecasts, By Indication (2020-2032) (USD Billion)
11.5.2.6.3 South Africa In Vivo CRO Market Estimates and Forecasts, By Modality (2020-2032) (USD Billion)
11.5.2.8.3 South Africa In Vivo CRO Market Estimates and Forecasts, By GLP Type (2020-2032) (USD Billion)
11.5.2.7 Nigeria
11.5.2.7.1 Nigeria In Vivo CRO Market Estimates and Forecasts, By Model Type (2020-2032) (USD Billion)
11.5.2.7.2 Nigeria In Vivo CRO Market Estimates and Forecasts, By Indication (2020-2032) (USD Billion)
11.5.2.7.3 Nigeria In Vivo CRO Market Estimates and Forecasts, By Modality (2020-2032) (USD Billion)
11.5.2.8.3 Nigeria In Vivo CRO Market Estimates and Forecasts, By GLP Type (2020-2032) (USD Billion)
11.5.2.8 Rest of Africa
11.5.2.8.1 Rest of Africa In Vivo CRO Market Estimates and Forecasts, By Model Type (2020-2032) (USD Billion)
11.5.2.8.2 Rest of Africa In Vivo CRO Market Estimates and Forecasts, By Indication (2020-2032) (USD Billion)
11.5.2.8.3 Rest of Africa In Vivo CRO Market Estimates and Forecasts, By Modality (2020-2032) (USD Billion)
11.5.2.8.3 Rest of Africa In Vivo CRO Market Estimates and Forecasts, By GLP Type (2020-2032) (USD Billion)
11.6 Latin America
11.6.1 Trends Analysis
11.6.2 Latin America In Vivo CRO Market Estimates and Forecasts, by Country (2020-2032) (USD Billion)
11.6.3 Latin America In Vivo CRO Market Estimates and Forecasts, By Model Type (2020-2032) (USD Billion)
11.6.4 Latin America In Vivo CRO Market Estimates and Forecasts, By Indication (2020-2032) (USD Billion)
11.6.5 Latin America In Vivo CRO Market Estimates and Forecasts, By Modality (2020-2032) (USD Billion)
11.6.5 Latin America In Vivo CRO Market Estimates and Forecasts, By GLP Type (2020-2032) (USD Billion)
11.6.6 Brazil
11.6.6.1 Brazil In Vivo CRO Market Estimates and Forecasts, By Model Type (2020-2032) (USD Billion)
11.6.6.2 Brazil In Vivo CRO Market Estimates and Forecasts, By Indication (2020-2032) (USD Billion)
11.6.6.3 Brazil In Vivo CRO Market Estimates and Forecasts, By Modality (2020-2032) (USD Billion)
11.6.6.3 Brazil In Vivo CRO Market Estimates and Forecasts, By GLP Type (2020-2032) (USD Billion)
11.6.7 Argentina
11.6.7.1 Argentina In Vivo CRO Market Estimates and Forecasts, By Model Type (2020-2032) (USD Billion)
11.6.7.2 Argentina In Vivo CRO Market Estimates and Forecasts, By Indication (2020-2032) (USD Billion)
11.6.7.3 Argentina In Vivo CRO Market Estimates and Forecasts, By Modality (2020-2032) (USD Billion)
11.6.7.3 Argentina In Vivo CRO Market Estimates and Forecasts, By GLP Type (2020-2032) (USD Billion)
11.6.8 Colombia
11.6.8.1 Colombia In Vivo CRO Market Estimates and Forecasts, By Model Type (2020-2032) (USD Billion)
11.6.8.2 Colombia In Vivo CRO Market Estimates and Forecasts, By Indication (2020-2032) (USD Billion)
11.6.8.3 Colombia In Vivo CRO Market Estimates and Forecasts, By Modality (2020-2032) (USD Billion)
11.6.8.3 Colombia In Vivo CRO Market Estimates and Forecasts, By GLP Type (2020-2032) (USD Billion)
11.6.9 Rest of Latin America
11.6.9.1 Rest of Latin America In Vivo CRO Market Estimates and Forecasts, By Model Type (2020-2032) (USD Billion)
11.6.9.2 Rest of Latin America In Vivo CRO Market Estimates and Forecasts, By Indication (2020-2032) (USD Billion)
11.6.9.3 Rest of Latin America In Vivo CRO Market Estimates and Forecasts, By Modality (2020-2032) (USD Billion)
11.6.9.3 Rest of Latin America In Vivo CRO Market Estimates and Forecasts, By GLP Type (2020-2032) (USD Billion)
12. Company Profiles
12.1 Cytel
12.1.1 Company Overview
12.1.2 Financial
12.1.3 Products/ Services Offered
12.1.4 SWOT Analysis
12.2 Syneos Health
12.2.1 Company Overview
12.2.2 Financial
12.2.3 Products/ Services Offered
12.2.4 SWOT Analysis
12.3 ICON plc
12.3.1 Company Overview
12.3.2 Financial
12.3.3 Products/ Services Offered
12.3.4 SWOT Analysis
12.4 Biocon
12.4.1 Company Overview
12.4.2 Financial
12.4.3 Products/ Services Offered
12.4.4 SWOT Analysis
12.5 Medpace
12.5.1 Company Overview
12.5.2 Financial
12.5.3 Products/ Services Offered
12.5.4 SWOT Analysis
12.6 Crown Bioscience International
12.6.1 Company Overview
12.6.2 Financial
12.6.3 Products/ Services Offered
12.6.4 SWOT Analysis
12.7 Charles River Laboratories
12.7.1 Company Overview
12.7.2 Financial
12.7.3 Products/ Services Offered
12.7.4 SWOT Analysis
12.8 Labcorp Drug Development
12.8.1 Company Overview
12.8.2 Financial
12.8.3 Products/ Services Offered
12.8.4 SWOT Analysis
12.9 WuXi AppTec, PRA Health Sciences
12.9.1 Company Overview
12.9.2 Financial
12.9.3 Products/ Services Offered
12.9.4 SWOT Analysis
12.10 Parexel International
12.10.1 Company Overview
12.10.2 Financial
12.10.3 Products/ Services Offered
12.10.4 SWOT Analysis
13. Use Cases and Best Practices
14. Conclusion
An accurate research report requires proper strategizing as well as implementation. There are multiple factors involved in the completion of good and accurate research report and selecting the best methodology to compete the research is the toughest part. Since the research reports we provide play a crucial role in any company’s decision-making process, therefore we at SNS Insider always believe that we should choose the best method which gives us results closer to reality. This allows us to reach at a stage wherein we can provide our clients best and accurate investment to output ratio.
Each report that we prepare takes a timeframe of 350-400 business hours for production. Starting from the selection of titles through a couple of in-depth brain storming session to the final QC process before uploading our titles on our website we dedicate around 350 working hours. The titles are selected based on their current market cap and the foreseen CAGR and growth.
The 5 steps process:
Step 1: Secondary Research:
Secondary Research or Desk Research is as the name suggests is a research process wherein, we collect data through the readily available information. In this process we use various paid and unpaid databases which our team has access to and gather data through the same. This includes examining of listed companies’ annual reports, Journals, SEC filling etc. Apart from this our team has access to various associations across the globe across different industries. Lastly, we have exchange relationships with various university as well as individual libraries.

Step 2: Primary Research
When we talk about primary research, it is a type of study in which the researchers collect relevant data samples directly, rather than relying on previously collected data. This type of research is focused on gaining content specific facts that can be sued to solve specific problems. Since the collected data is fresh and first hand therefore it makes the study more accurate and genuine.
We at SNS Insider have divided Primary Research into 2 parts.
Part 1 wherein we interview the KOLs of major players as well as the upcoming ones across various geographic regions. This allows us to have their view over the market scenario and acts as an important tool to come closer to the accurate market numbers. As many as 45 paid and unpaid primary interviews are taken from both the demand and supply side of the industry to make sure we land at an accurate judgement and analysis of the market.
This step involves the triangulation of data wherein our team analyses the interview transcripts, online survey responses and observation of on filed participants. The below mentioned chart should give a better understanding of the part 1 of the primary interview.

Part 2: In this part of primary research the data collected via secondary research and the part 1 of the primary research is validated with the interviews from individual consultants and subject matter experts.
Consultants are those set of people who have at least 12 years of experience and expertise within the industry whereas Subject Matter Experts are those with at least 15 years of experience behind their back within the same space. The data with the help of two main processes i.e., FGDs (Focused Group Discussions) and IDs (Individual Discussions). This gives us a 3rd party nonbiased primary view of the market scenario making it a more dependable one while collation of the data pointers.
Step 3: Data Bank Validation
Once all the information is collected via primary and secondary sources, we run that information for data validation. At our intelligence centre our research heads track a lot of information related to the market which includes the quarterly reports, the daily stock prices, and other relevant information. Our data bank server gets updated every fortnight and that is how the information which we collected using our primary and secondary information is revalidated in real time.

Step 4: QA/QC Process
After all the data collection and validation our team does a final level of quality check and quality assurance to get rid of any unwanted or undesired mistakes. This might include but not limited to getting rid of the any typos, duplication of numbers or missing of any important information. The people involved in this process include technical content writers, research heads and graphics people. Once this process is completed the title gets uploader on our platform for our clients to read it.
Step 5: Final QC/QA Process:
This is the last process and comes when the client has ordered the study. In this process a final QA/QC is done before the study is emailed to the client. Since we believe in giving our clients a good experience of our research studies, therefore, to make sure that we do not lack at our end in any way humanly possible we do a final round of quality check and then dispatch the study to the client.
By Model Type
Rodent based
Mice Models
Rat Models
Others
Non-rodent base
By Modality
Small Molecules
Large Molecules
Cell & Gene Therapy
CAR T-cell therapies
CAR-NK cell therapy
TCR-T cell therapy
Other (Includes- TCR-NK, CARM, and TAC-T)
RNA Therapy
Others
By Indication
Oncology
Blood cancer
Solid tumor
Syngeneic model
Patient derived xenograft
Xenograft
Others
CNS Conditions
Epilepsy
Parkinson's disease
Muscular Dystrophy
Huntington's disease
Stroke
Alzheimer’s Disease
Muscle regeneration
Traumatic brain injury
Amyotrophic lateral sclerosis (ALS)
Spinal Muscular Atrophy
Other Neurodevelopment Disorders
Diabetes
Obesity
Pain management
Chronic pain
Acute pain
Autoimmune/inflammation conditions
Rheumatoid Arthritis
Irritable Bowel Syndrome
Multiple Sclerosis
Osteoarthritis
Others
Others
By GLP Type
GLP Toxicology
Non GLP
Request for Segment Customization as per your Business Requirement: Segment Customization Request
Regional Coverage:
North America
US
Canada
Mexico
Europe
Eastern Europe
Poland
Romania
Hungary
Turkey
Rest of Eastern Europe
Western Europe
Germany
France
UK
Italy
Spain
Netherlands
Switzerland
Austria
Rest of Western Europe
Asia Pacific
China
India
Japan
South Korea
Vietnam
Singapore
Australia
Rest of Asia Pacific
Middle East & Africa
Middle East
UAE
Egypt
Saudi Arabia
Qatar
Rest of Middle East
Africa
Nigeria
South Africa
Rest of Africa
Latin America
Brazil
Argentina
Colombia
Rest of Latin America
Request for Country Level Research Report: Country Level Customization Request
Available Customization
With the given market data, SNS Insider offers customization as per the company’s specific needs. The following customization options are available for the report:
Detailed Volume Analysis
Criss-Cross segment analysis (e.g. Product X Application)
Competitive Product Benchmarking
Geographic Analysis
Additional countries in any of the regions
Customized Data Representation
Detailed analysis and profiling of additional market players
The Wound Closure Market is projected to grow from USD 15.17 billion in 2023 to USD 26.63 billion by 2032, at a CAGR of 6.47%.
The Advance Directives Market was valued at USD 122.74 billion in 2023 and is anticipated to reach USD 588.40 billion by 2032 with a CAGR of 19.04% over the forecast period 2024-2032.
The Rapid Medical Diagnostic Kits Market was valued at USD 23.63 billion in 2023 and is expected to reach USD 51.52 billion by 2032, growing at a CAGR of 9.06% over the forecast period of 2024-2032.
The Recombinant Vaccines Market Size was valued at USD 12.53 Billion in 2023, and is expected to reach USD 32.83 Billion by 2032, and grow at a CAGR of 11.88%.
The Clinical Alarm Management Market Size was valued at USD 2.42 billion in 2023 and is expected to reach USD 9.02 billion by 2032 and grow at a CAGR of 15.75%.
The Mononucleosis Diagnostic Market size was estimated at USD 1.7 billion in 2022 and is expected to reach USD 3.2 billion by 2030 with a growing CAGR of 8.6% during the forecast period of 2023-2030.

Hi! Click one of our member below to chat on Phone
© 2025 All Rights Reserved by SNS Insider Pvt Ltd


