In-Memory Computing Market Report Scope & Overview:
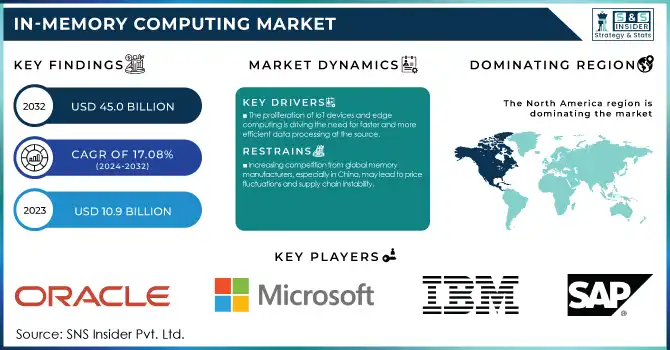
The In-Memory Computing Market was valued at USD 10.9 Billion in 2023 and is expected to reach USD 45.0 Billion by 2032, growing at a CAGR of 17.08% from 2024-2032.
Get More information on In-Memory Computing Market - Request Free Sample Report
The In-memory computing market is experiencing significant growth, owing to the rising requirement for real-time data processing, the growing popularity of AI-driven applications, and high-performance computing requirements. IMC technology allows data to flow directly into memory rather than disk-based storage, thus drastically improving data latency and computational efficiency. This feature is especially valuable for AI workloads, big data analytics, and financial services that need real-time insights. AI and machine learning adoption is one of the primary driving factors for growth, especially in the data center. In AI, the evolution of Compute-in-Memory architectures is changing AI inference efficiency. CIM works directly in memory to do calculations for which CIM is named. Hence, CIM cuts the power consumption and improves the processing speeds by directly communicating with the memory thus overcoming the traditional "memory wall" bottleneck. This trend is only going to accelerate, given that Processing-in-Memory and Processing-near-Memory, able to deliver up to 50% increase in energy efficiency and a latency reduction of nearly 30%, are starting to appear on the tech landscape.
Potential oversupply in the memory chip market could hinder the growth. Chinese memory makers, such as ChangXin Memory Technologies, are quickly grabbing percentage of the global market, which is feared to swindle prices and trigger chip shortages. This makes the IMC market ascent sustainable even with these risks, as AI's growing footprint, advancements in memory architectures, and the need for more real-time data processing-oriented solutions are persistent trends across industries driven by integration on the platform.
Market Dynamics
Drivers
-
The proliferation of IoT devices and edge computing is driving the need for faster and more efficient data processing at the source.
The IMC market is benefiting from the rapid growth of IoT devices and edge computing due to the rising need for real-time data processing. These devices produce an enormous amount of data that needs to be analyzed in real-time in order to facilitate timely decision-making, in applications like smart cities, industrialization, and autonomous vehicles. Cloud-based processes, that have been around for ages, introduce latency with transferring data through the device and centralized data centers. To overcome this challenge, edge computing emerges by bringing computation closer to the data source with decreased latency and improved response times. However traditional architectures based on storage cannot deliver the speed and efficiency levels required by edge applications.
The role of IMC technology in maximizing edge computing goes in a way that it can process data in memory from memory instead of on disk. This reduces the time taken for processing, allowing real-time analytics, anomaly detection, and AI capabilities to be performed in real-time at the edge. In industrial IoT, predictive maintenance systems use the IMC to process sensor data in real-time to avoid expensive machine breakdowns, for instance. Likewise, autonomous vehicles rely on IMC for processing large amounts of sensor data in real-time, allowing for quick and reliable decisions for safe driving. The increasing number of connected devices will result in more demand for high-performance, low-latency computing solutions that will lead to significant adoption of IMC in edge environments. Such trends will drive innovation around memory-centric architectures to improve efficiency and scalability in IoT and edge ecosystems.
-
Increasing demand for AI-driven applications, especially in data centers, is accelerating the need for high-speed memory processing.
-
Businesses require ultra-low latency solutions for big data analytics, financial transactions, and real-time decision-making.
Restraints
-
Increasing competition from global memory manufacturers, especially in China, may lead to price fluctuations and supply chain instability.
Emerging players in China are aggressively working to penetrate the global memory supply, increasing competition among global memory manufacturers and introducing price fluctuation and supply chain instability challenges for the In-Memory Computing market. Chinese firms, especially ChangXin Memory Technologies and Yangtze Memory Technologies Corp, are aggressively ramping up production and also investing in advanced memory technologies, further ramping up competition with major players including SK Hynix, Samsung, and Micron. So, a crash in memory component prices through oversupply, in particular DRAM and high-bandwidth memory, can hurt the profit margins of manufacturers and add additional uncertainty to corporate procurement strategies that are implementing IMC solutions.
Supply chain crashes have been worsened by political factors, including trade links and export restrictions. Sanctions by U.S. and allies against Chinese semiconductor companies restricting access to cutting-edge technology and equipment. Consequently, it has raised the material supply chain disruptions risk with regard to the availability and pricing of IMC devices. Moreover, spiking raw material prices and cost of production restrictions add to the market complexities. For businesses committing resources to IMC, these unknown variables hinder effective long-term planning since the price of memory has a direct correlation with the total deployment cost. Enterprises are de-risking their processes by increasing their supplier portfolio and seeking alternative memory technology, like Processing-in-Memory or Compute-in-Memory, to lower reliance on classical DRAM-based architectures. Nonetheless, ongoing innovation and timely collaborations will be needed to contribute to the stabilization of the IMC space with a higher number of players expected soon.
-
Processing sensitive data in memory raises security risks, making it vulnerable to cyber threats and breaches.
-
Many existing IT infrastructures are not designed to support IMC, requiring costly upgrades.
Segment Analysis
By Component
The hardware segment dominated the market and represented a significant revenue share of more than 45% in 2023, which owes to the presence of high bandwidth memory components such as DRAM that help deliver higher performance enabling faster data processing. The adoption of IMC will continue to grow driven by real-time analytics, AI, and IoT applications used by businesses, leading to increasing memory module consumption. This portion is supposed to observe stable development as an ever-increasing number of cutting-edge Memory innovations are created even as the interest for rapid, low-inactivity figuring arrangements builds. As per future forecasting, Memory Hardware will remain dominant in this segment due to continuous innovation concerning energy efficiency and processing speed.
The software segment is anticipated to register the fastest CAGR. With the rise of AI, machine learning, and edge computing, enterprises need dedicated software that can maximize the use of IMC hardware. The demand for software solutions, in turn, will be fueled by the growing adoption of cloud-native applications and real-time analytics. Software innovation from here onwards will be directed towards greater compatibility with changing hardware, increased scalability, and more efficient data management, all of which will enable rapid growth in this domain.
By Application
The fraud detection segment dominated the In-Memory Computing market and accounted for a revenue share of more than 41% in 2023, due to the increasing need for real-time monitoring and analysis of transactions to identify fraudulent activities. Financial institutions and e-commerce platforms rely heavily on IMC technology to detect anomalies and prevent fraud in real time, reducing losses and enhancing security. The segment benefits from the rising threat of cyberattacks and financial fraud, driving the adoption of IMC solutions. Future forecasts suggest that as digital transactions and online services continue to expand, the demand for fraud detection systems will grow, leading to sustained dominance of this segment. Ongoing advancements in AI and machine learning will further enhance fraud detection capabilities.
The real-time analytics segment is expected to register the fastest CAGR, driven by the increasing need for businesses to analyze data instantly for decision-making and operational efficiency. Industries such as retail, healthcare, and manufacturing are adopting IMC for real-time insights into customer behavior, market trends, and operational performance. The rise of IoT, edge computing, and AI-powered applications is fueling the demand for real-time analytics. Future growth will be propelled by the need for businesses to remain competitive in dynamic markets, and innovations in IMC technology will enable faster and more accurate data processing. This trend will result in accelerated adoption of real-time analytics solutions across industries.
Regional Analysis
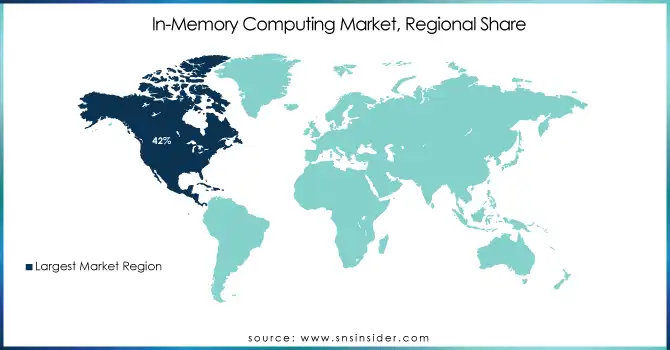
North America dominated the market and represented a significant revenue share of more than 42%, which is attributed to the presence of the largest technology players, well-established infrastructure, and high adoption rate of AI, big data analytics, and IoT applications. The U.S. is unique leading the way in developing IMC solutions and applying them because demand is driven mostly by finance, healthcare, and a variety of retail. R&D investments in memory technologies and machine learning applications remain vast across the region. Going forward, North America is estimated to continue holding the largest share with the increasing adoption of IMC in Cloud computing, edge computing, and real-time analytics due to the existing digital transformation trends and the growing AI technology.
Due to rapid technological advancements, wider AI adoption scale, and enormous infrastructure digitization investments, the Asia-Pacific region is expected to exhibit the fastest growth. IMC is still futuristic for many regions but China, Japan, and India will take the lead across sectors be it manufacturing, automotive, telecom, etc. In the region, the growing entries of IoT-related services, edge computing, and smart city models are boosting the demand for real-time data flow. Looking ahead, transport services, AI deployments, and government push for technology developments will be the major growth engagements for the APAC region and will in turn make the same as a major contributor to the global IMC market growth.
Need any customization research on In-Memory Computing Market - Enquiry Now
Key Players
The major key players along with their products are
-
SAP SE – SAP HANA
-
IBM – IBM Db2 with BLU Acceleration
-
Microsoft – Azure SQL Database In-Memory
-
Oracle Corporation – Oracle TimesTen In-Memory Database
-
Intel – Intel Optane DC Persistent Memory
-
Microsoft – SQL Server In-Memory OLTP
-
GridGain Systems – GridGain In-Memory Computing Platform
-
VMware – VMware vSphere with Virtual Volumes
-
Amazon Web Services (AWS) – Amazon ElastiCache
-
Pivotal Software – Pivotal GemFire
-
TIBCO Software Inc.– TIBCO ActiveSpaces
-
Redis Labs – Redis Enterprise
-
Hazelcast – Hazelcast IMDG (In-Memory Data Grid)
-
Cisco – Cisco In-Memory Analytics
-
Qlik – Qlik Data integration
Recent Developments
In October 2024, Kioxia showcased its advancements in Storage Class Memory (SCM) at the International Electron Devices Meeting (IEDM) 2024. SCM is designed to bridge the gap between DRAM and flash memory, offering higher speed and larger data handling capabilities.
In August 2024, the U.S. Commerce Department announced plans to grant SK Hynix up to $450 million to fund an advanced packaging plant and an R&D facility for artificial intelligence products in Indiana. This initiative aims to enhance the U.S. semiconductor supply chain and create approximately 1,000 jobs.
In October 2024, Samsung Electronics reported progress in scaling up sales of its latest specialized memory chips for AI computing. The company achieved a significant milestone by qualifying its HBM3E memory chips for a major customer, speculated to be Nvidia, and anticipates these chips to constitute 50% of its high-bandwidth memory revenue in the fourth quarter
| Report Attributes | Details |
| Market Size in 2023 | USD 10.9 Billion |
| Market Size by 2032 | USD 45.0 Billion |
| CAGR | CAGR of 17.08% From 2024 to 2032 |
| Base Year | 2023 |
| Forecast Period | 2024-2032 |
| Historical Data | 2020-2022 |
| Report Scope & Coverage | Market Size, Segments Analysis, Competitive Landscape, Regional Analysis, DROC & SWOT Analysis, Forecast Outlook |
| Key Segments | • By Components (Hardware, Software, Services • By Application (Fraud detection, Risk management, Real-time analytics, High-frequency trading) • By Vertical (BFSI, Healthcare, Retail, Telecoms) |
| Regional Analysis/Coverage | North America (US, Canada, Mexico), Europe (Eastern Europe [Poland, Romania, Hungary, Turkey, Rest of Eastern Europe] Western Europe] Germany, France, UK, Italy, Spain, Netherlands, Switzerland, Austria, Rest of Western Europe]), Asia Pacific (China, India, Japan, South Korea, Vietnam, Singapore, Australia, Rest of Asia Pacific), Middle East & Africa (Middle East [UAE, Egypt, Saudi Arabia, Qatar, Rest of Middle East], Africa [Nigeria, South Africa, Rest of Africa], Latin America (Brazil, Argentina, Colombia, Rest of Latin America) |
| Company Profiles | SAP, IBM, Microsoft, Oracle, Intel, Microsoft, GridGain Systems, VMware, Amazon Web Services (AWS), Pivotal Software, TIBCO Software, Redis Labs, Hazelcast, Cisco, Qlik |
| Key Drivers | • Increasing demand for AI-driven applications, especially in data centers, is accelerating the need for high-speed memory processing. • Businesses require ultra-low latency solutions for big data analytics, financial transactions, and real-time decision-making. |
| RESTRAINTS | • Processing sensitive data in memory raises security risks, making it vulnerable to cyber threats and breaches. • Many existing IT infrastructures are not designed to support IMC, requiring costly upgrades. |
