image

Immersive Virtual Reality Market Report Scope & Overview:
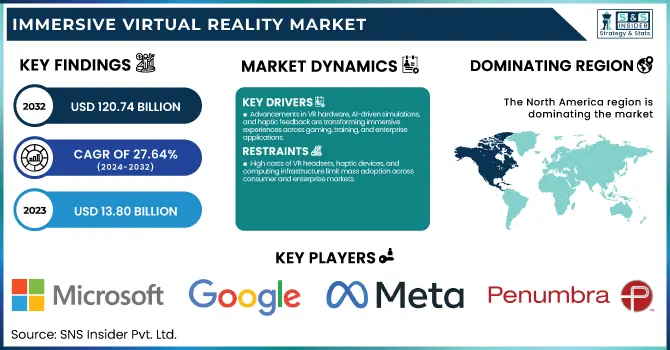
Immersive Virtual Reality Market was valued at USD 13.80 billion in 2023 and is expected to reach USD 120.74 billion by 2032, growing at a CAGR of 27.64% from 2024-2032. This report includes insights into adoption rates, user demographics, investment & funding trends, and cost trends informing the market. Growing adoption of immersive VR in gaming, healthcare, education, and enterprise use cases is driving growth. Growing consumer interest, along with rising affordability and hardware improvements, is propelling market penetration. Investment in VR startups and tech innovations, such as AI experiences and haptic feedback, is also driving further market growth. While cost trends suggest a slow decline in hardware costs, this is also making immersive VR more affordable.

Immersive Virtual Reality Market Dynamics

Drivers

  • Advancements in VR hardware, AI-driven simulations, and haptic feedback are transforming immersive experiences across gaming, training, and enterprise applications.

Advances in VR headsets, haptic feedback technology, and AI-based simulations are revolutionizing immersive experiences, making them more realistic and accessible. Advances in display resolution, motion tracking, and spatial audio are increasing user engagement across industries. The combination of machine learning and real-time rendering is powering hyper-realistic environments, while advances in wireless connectivity and processing power are removing latency issues. Advances in haptic technology allow for tactile interaction, providing more immersive gaming, training, and industrial uses. Cloud-based VR and 5G connectivity also enable seamless experiences, driving wider use across healthcare, education, and business markets. With advancements in these technologies, immersive virtual reality is poised to transform digital interactions across various industries.

Restraints

  • High costs of VR headsets, haptic devices, and computing infrastructure limit mass adoption across consumer and enterprise markets.

High-end VR headsets, haptic equipment, and high-speed computing hardware demand a heavy outlay of funds, keeping the immersive experience out of reach for most consumers and small and medium-sized enterprises. The expense of state-of-the-art displays, motion-tracking sensors, and real-time rendering hardware contributes to the cost. Organizations that wish to implement VR in training, collaboration, and manufacturing applications have heavy initial costs for infrastructure and software development. Furthermore, the maintenance and upgrading of VR systems require ongoing investment, restricting scalability. Although technological developments are reducing costs, affordability is a key limitation, hindering adoption in price-sensitive markets. Until hardware costs come down, widespread adoption of immersive virtual reality will be restricted, limiting its full potential in industries.

Opportunities

  • 5G and Cloud VR Driving Seamless, High-Quality Immersive Experiences Without Expensive Hardware

Improved 5G speeds and cloud VR technology are revolutionizing the immersive experience by doing away with the requirement for high-end hardware. Low-latency networks provide real-time interaction, making VR more pervasive across industries such as gaming, healthcare, and education. Cloud platforms enable users to stream VR content on demand, lessening reliance on costly computing power. Businesses are now able to roll out mass-market VR applications without the need for high infrastructure expenses, driving adoption in remote training, virtual collaboration, and industrial simulations. With the rollout of 5G networks around the world, the combination of edge computing and AI-based processing will further improve VR performance, opening up new possibilities for businesses and consumers to enjoy high-quality, immersive environments at a reduced cost.

Challenges

  • Motion sickness, nausea, and eye strain from prolonged VR use limit user engagement and hinder widespread adoption across industries.

Prolonged virtual reality usage may result in motion sickness, dizziness, nausea, and eye strain, which impact user comfort and restrict adoption. Disconnection between visual experience and physical movement leads to discomfort, decreasing the duration of users in immersive environments. High frame rates, enhanced motion tracking, and optimized VR experiences reduce these effects, but there are still challenges, particularly for new users. Long-term use of VR screens also tires the eyes, and there are concerns about the potential health effects. Ergonomic designs, adaptive refresh rates, and AI-based motion adjustments are being developed by developers to enhance comfort. Until such problems are completely resolved, user adoption both in consumer and enterprise markets will remain constrained.

Immersive Virtual Reality Market Segment Analysis

By Technology

Semi & Fully Immersive VR dominated the Immersive Virtual Reality Market in 2023, with a share of around 80% of overall revenue. These segments are the leaders because of their extremely immersive, realistic experiences, which are best suited for use in gaming, healthcare, education, and industrial simulations. High-end headsets, motion tracking, and haptic feedback create greater immersion, fueling demand across industries. Furthermore, business adoption for training and collaboration keeps increasing, further consolidating the reign of semi & fully immersive VR solutions in the market.

The Non-Immersive VR segment is expected to grow at the fastest CAGR of around 29.97% between 2024 and 2032. Its high growth rate is due to cost-effective accessibility since it utilizes desktop-based VR software without the costly headsets. Growing adoption across education, business partnership, and internet-based applications makes it a desirable choice for businesses. The emergence of virtual workplaces and distance learning solutions also boosts demand further, making non-immersive VR a cost-effective, scalable substitute for completely immersive systems.

By End-use

The Gaming segment dominated the Immersive Virtual Reality Market in 2023 with around 39% of total revenues. This supremacy is fueled by the strong demand for realistic, interactive content and the ongoing development of VR graphics, motion tracking, and haptic feedback. Large gaming players are heavily investing in VR-exclusive games, multiplayer games, and esports use cases, further propelling growth. Moreover, growing wireless VR headset adoption and cloud gaming improve accessibility, making gaming the most profitable segment in immersive virtual reality.

The Healthcare segment is expected to grow at the fastest CAGR of around 31.56% during 2024-2032. The high growth is driven by the increasing use of VR in medical training, therapy, rehabilitation, and pain management. Surgeons and medical professionals employ VR simulations for accurate training, while VR-based mental treatments and physical therapy programs are becoming increasingly popular. In addition, remote patient care and virtual consultations based on VR technology are fueling tremendous investments, which render healthcare the most promising area of growth in immersive virtual reality.

By Component

The Hardware segment dominated the Immersive Virtual Reality Market in 2023, accounting for about 47% of overall revenue. This is fueled by the enormous demand for VR headsets, sensors, haptic devices, and sophisticated display technologies. Ongoing innovations in high-definition display, motion tracking, and AI-powered hardware continue to drive adoption. Enterprise and consumer spending on advanced VR equipment for gaming, training, and industrial use also drives substantial market share. Growth in 5G and cloud-based VR solutions also boosts hardware sales.

The Software segment is expected to expand at the fastest CAGR of around 28.90% during the period 2024-2032. The high growth is fueled by growing demand for immersive content, AI-driven simulations, and interactive applications across sectors. Increased investments in VR gaming, corporate training, healthcare simulation, and metaverse development are driving software innovation. In addition, expansion of cloud-based VR platforms and subscription-based content models is improving accessibility, with software being a primary driver of future growth in the immersive virtual reality market.

By Device

Head Mounted Display (HMD) accounted for the highest share in Immersive Virtual Reality Market in 2023 at around 60% of the total revenue. The reason for this dominance lies in the pervasive use of VR headsets in gaming, medical applications, training, and corporate sectors. Innovation in high-definition displays, thin and light weights, and wireless technology has enhanced the user experience, leading to greater demand. Leading technology corporations are investing heavily in next-generation HMDs with AI integration and spatial computing, further positioning this segment to lead the market across industries.

The Gesture Tracking Device (GTD) segment is expected to expand at the fastest CAGR of nearly 29.20% during the forecast period 2024-2032. The growth is spurred by the growing need for natural and intuitive interaction within immersive experiences. Gesture recognition improves gaming, training, healthcare, and industrial simulations, allowing for hands-free command. Developments in AI-driven motion tracking, haptic feedback, and computer vision are propelling innovation. As businesses demand more interactive VR experiences, gesture tracking devices are becoming a necessity for frictionless user interaction.

Regional Analysis

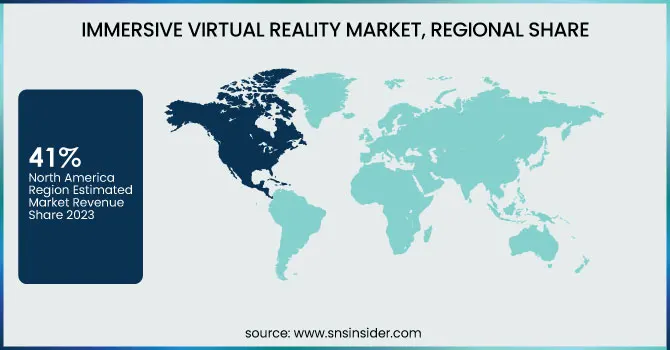
The North America region dominated the Immersive Virtual Reality Market in 2023, accounting for about 41% of overall revenue. This is fueled by high adoption of VR technology among consumers, robust presence of top VR firms, and heavy investments in gaming, healthcare, and enterprise training use cases. The area is blessed with state-of-the-art infrastructure, early embracement of new technologies, and government patronage of innovation. Moreover, the speedy growth of metaverse platforms and AI-based VR solutions further consolidates North America's dominance in the market.

The Asia Pacific region is anticipated to expand with the fastest CAGR of about 29.88% between 2024 and 2032. It is driven by growing investments in VR gaming, industrial training, and education applications in the region. Growing demand from consumers, government support, and robust manufacturing capabilities drive the market growth. China, Japan, and South Korea are leading the charge in low-cost VR hardware and immersive content creation, and Asia Pacific is the region with the fastest-growing market for immersive virtual reality solutions.

Key Players

  • Microsoft Corporation (HoloLens, Windows Mixed Reality)

  • HTC Corporation (Vive Pro, Vive Focus)

  • Google LLC (Cardboard, Daydream View)

  • Magic Leap (Magic Leap 1, Magic Leap 2)

  • Meta (Quest 3, Quest Pro)

  • Samsung Electronics Co., Ltd. (Odyssey+, Gear VR)

  • Sony Corporation (PlayStation VR2, PlayStation VR)

  • Unity Technologies (Unity Engine, Unity Mars)

  • Autodesk, Inc. (VRED, Maya VR)

  • EON Reality, Inc. (EON-XR, EON Metaverse Builder)

  • Barco (Cave, Powerwall)

  • Penumbra, Inc. (REAL i-Series, REAL Immersive System)

  • PICO Immersive Pte. Ltd. (PICO 4, PICO Neo 3)

  • DPVR (E4, P1 Ultra 4K)

  • Varjo (XR-4, Aero)

  • Apple (Vision Pro, ARKit)

  • Lenovo (ThinkReality VRX, Mirage Solo)

  • Valve (Index, Index Controllers)

  • Vrgineers (XTAL 3, XTAL 8K)

  • Xiaomi (Mi VR Standalone, Mi VR Play 2)

  • StarVR (StarVR One, StarVR One XT)

  • Kopin Corporation (Solos, Golden-i Infinity)

  • Sensics (Goggles for Public VR, OSVR HDK)

  • Ultraleap (Leap Motion Controller, Hand Tracking SDK)

Recent Developments:

  • In 2025, Anduril Industries has taken over Microsoft's USD 22 billion U.S. Army IVAS headset program, overseeing production and development while Microsoft Azure continues as the cloud provider. The agreement is awaiting U.S. Department of Defense approval.

  • In December 2024, Samsung introduced Project Moohan, an upcoming XR headset powered by Galaxy AI and developed in collaboration with Google and Qualcomm. The headset, running on the new Android XR platform, features advanced displays, Passthrough capabilities, and multimodal input, enabling immersive virtual experiences.

Immersive Virtual Reality Market Report Scope:

Report Attributes Details
Market Size in 2023 USD 13.80 Billion
Market Size by 2032 USD 120.74 Billion
CAGR CAGR of 27.30% From 2024 to 2032
Base Year 2023
Forecast Period 2024-2032
Historical Data 2020-2022
Report Scope & Coverage Market Size, Segments Analysis, Competitive  Landscape, Regional Analysis, DROC & SWOT Analysis, Forecast Outlook
Key Segments • By Component (Hardware, Software, Services)
• By Technology (Non-Immersive, Semi & Fully Immersive)
• By Device (Head Mounted Display, Gesture Tracking Device, Projectors & Display Wall)
• By End-use (Aerospace & Defence, Manufacturing, Automotive, Healthcare, Retail & E-commerce, Media & Entertainment, Gaming)
Regional Analysis/Coverage North America (US, Canada, Mexico), Europe (Eastern Europe [Poland, Romania, Hungary, Turkey, Rest of Eastern Europe] Western Europe] Germany, France, UK, Italy, Spain, Netherlands, Switzerland, Austria, Rest of Western Europe]), Asia Pacific (China, India, Japan, South Korea, Vietnam, Singapore, Australia, Rest of Asia Pacific), Middle East & Africa (Middle East [UAE, Egypt, Saudi Arabia, Qatar, Rest of Middle East], Africa [Nigeria, South Africa, Rest of Africa], Latin America (Brazil, Argentina, Colombia, Rest of Latin America)
Company Profiles Microsoft Corporation, HTC Corporation, Google LLC, Magic Leap, Meta, Samsung Electronics Co., Ltd., Sony Corporation, Unity Technologies, Autodesk, Inc., EON Reality, Inc., Barco, Penumbra, Inc., PICO Immersive Pte. Ltd., DPVR, Varjo, Apple, Lenovo, Valve, Vrgineers, Xiaomi, StarVR, Kopin Corporation, Sensics, Ultraleap

Frequently Asked Questions

ANS: Immersive Virtual Reality Market was valued at USD 13.80 billion in 2023 and is expected to reach USD 120.74 billion by 2032, growing at a CAGR of 27.64% from 2024-2032.

ANS: Semi & Fully Immersive VR led with around 80% of revenue share.

ANS: Gaming led with a 39% revenue share.

ANS: Hardware accounted for 47% of total revenue.

ANS: Asia Pacific is projected to grow at a CAGR of 29.88%.

Table of Contents

1. Introduction

1.1 Market Definition

1.2 Scope (Inclusion and Exclusions)

1.3 Research Assumptions

2. Executive Summary

2.1 Market Overview

2.2 Regional Synopsis

2.3 Competitive Summary

3. Research Methodology

3.1 Top-Down Approach

3.2 Bottom-up Approach

3.3. Data Validation

3.4 Primary Interviews

4. Market Dynamics Impact Analysis

4.1 Market Driving Factors Analysis

4.1.1 Drivers

4.1.2 Restraints

4.1.3 Opportunities

4.1.4 Challenges

4.2 PESTLE Analysis

4.3 Porter’s Five Forces Model

5. Statistical Insights and Trends Reporting

5.1 Adoption Rate

5.2 User Demographics

5.3 Investment & Funding Trends

5.4 Cost Trends

6. Competitive Landscape

6.1 List of Major Companies, By Region

6.2 Market Share Analysis, By Region

6.3 Product Benchmarking

6.3.1 Product specifications and features

6.3.2 Pricing

6.4 Strategic Initiatives

6.4.1 Marketing and promotional activities

6.4.2 Distribution and supply chain strategies

6.4.3 Expansion plans and new product launches

6.4.4 Strategic partnerships and collaborations

6.5 Technological Advancements

6.6 Market Positioning and Branding

7. Immersive Virtual Reality Market Segmentation, By Component

7.1 Chapter Overview

7.2 Hardware

7.2.1 Hardware Market Trends Analysis (2020-2032)

7.2.2 Hardware Market Size Estimates and Forecasts to 2032 (USD Billion)

7.3 Software

7.3.1 Software Market Trends Analysis (2020-2032)

7.3.2 Software Market Size Estimates and Forecasts to 2032 (USD Billion)

7.4 Services

7.4.1 Services Market Trends Analysis (2020-2032)

7.4.2 Services Market Size Estimates and Forecasts to 2032 (USD Billion)

8. Immersive Virtual Reality Market Segmentation, By Technology

8.1 Chapter Overview

8.2 Non-Immersive

8.2.1 Non-Immersive Market Trends Analysis (2020-2032)

8.2.2 Non-Immersive Market Size Estimates and Forecasts to 2032 (USD Billion)

8.3 Semi & Fully Immersive

8.3.1 Semi & Fully Immersive Market Trends Analysis (2020-2032)

8.3.2 Semi & Fully Immersive Market Size Estimates and Forecasts to 2032 (USD Billion)

9. Immersive Virtual Reality Market Segmentation, By End-use

9.1 Chapter Overview

9.2 Aerospace & Defence

9.2.1 Aerospace & Defence Market Trends Analysis (2020-2032)

9.2.2 Aerospace & Defence Market Size Estimates and Forecasts to 2032 (USD Billion)

9.3 Manufacturing

9.3.1 Manufacturing Market Trends Analysis (2020-2032)

9.3.2 Manufacturing Market Size Estimates and Forecasts to 2032 (USD Billion)

9.4 Automotive

               9.4.1 Automotive Market Trends Analysis (2020-2032)

9.4.2 Automotive Market Size Estimates and Forecasts to 2032 (USD Billion)

9.5 Healthcare

9.5.1 Healthcare Market Trends Analysis (2020-2032)

9.5.2 Healthcare Market Size Estimates and Forecasts to 2032 (USD Billion)

9.6 Retail & E-commerce

9.6.1 Retail & E-commerce Market Trends Analysis (2020-2032)

9.6.2 Retail & E-commerce Market Size Estimates and Forecasts to 2032 (USD Billion)

9.5 Media & Entertainment

9.5.1 Media & Entertainment Market Trends Analysis (2020-2032)

9.5.2 Media & Entertainment Market Size Estimates and Forecasts to 2032 (USD Billion)

9.6 Gaming

9.6.1 Gaming Market Trends Analysis (2020-2032)

9.6.2 Gaming Market Size Estimates and Forecasts to 2032 (USD Billion)

10. Immersive Virtual Reality Market Segmentation, By Device

10.1 Chapter Overview

10.2 Head Mounted Display

10.2.1 Head Mounted Display Market Trends Analysis (2020-2032)

10.2.2 Head Mounted Display Market Size Estimates and Forecasts to 2032 (USD Billion)

10.3 Gesture Tracking Device

10.3.1 Gesture Tracking Device Market Trends Analysis (2020-2032)

10.3.2 Gesture Tracking Device Market Size Estimates and Forecasts to 2032 (USD Billion)

10.4 Projectors & Display Wall

               10.4.1 Projectors & Display Wall Market Trends Analysis (2020-2032)

10.4.2 Projectors & Display Wall Market Size Estimates and Forecasts to 2032 (USD Billion)

11. Regional Analysis

11.1 Chapter Overview

11.2 North America

11.2.1 Trends Analysis

11.2.2 North America Immersive Virtual Reality Market Estimates and Forecasts, by Country (2020-2032) (USD Billion)

11.2.3 North America Immersive Virtual Reality Market Estimates and Forecasts, By Component (2020-2032) (USD Billion) 

11.2.4 North America Immersive Virtual Reality Market Estimates and Forecasts, By Technology (2020-2032) (USD Billion)

11.2.5 North America Immersive Virtual Reality Market Estimates and Forecasts, By End-use (2020-2032) (USD Billion)

11.2.6 North America Immersive Virtual Reality Market Estimates and Forecasts, By Device (2020-2032) (USD Billion)

11.2.7 USA

11.2.7.1 USA Immersive Virtual Reality Market Estimates and Forecasts, By Component (2020-2032) (USD Billion)

11.2.7.2 USA Immersive Virtual Reality Market Estimates and Forecasts, By Technology (2020-2032) (USD Billion)

11.2.7.3 USA Immersive Virtual Reality Market Estimates and Forecasts, By End-use (2020-2032) (USD Billion)

11.2.7.4 USA Immersive Virtual Reality Market Estimates and Forecasts, By Device (2020-2032) (USD Billion)

11.2.8 Canada

11.2.8.1 Canada Immersive Virtual Reality Market Estimates and Forecasts, By Component (2020-2032) (USD Billion)

11.2.8.2 Canada Immersive Virtual Reality Market Estimates and Forecasts, By Technology (2020-2032) (USD Billion)

11.2.8.3 Canada Immersive Virtual Reality Market Estimates and Forecasts, By End-use (2020-2032) (USD Billion)

11.2.8.4 Canada Immersive Virtual Reality Market Estimates and Forecasts, By Device (2020-2032) (USD Billion)

11.2.9 Mexico

11.2.9.1 Mexico Immersive Virtual Reality Market Estimates and Forecasts, By Component (2020-2032) (USD Billion)

11.2.9.2 Mexico Immersive Virtual Reality Market Estimates and Forecasts, By Technology (2020-2032) (USD Billion)

11.2.9.3 Mexico Immersive Virtual Reality Market Estimates and Forecasts, By End-use (2020-2032) (USD Billion)

11.2.9.4 Mexico Immersive Virtual Reality Market Estimates and Forecasts, By Device (2020-2032) (USD Billion)

11.3 Europe

11.3.1 Eastern Europe

11.3.1.1 Trends Analysis

11.3.1.2 Eastern Europe Immersive Virtual Reality Market Estimates and Forecasts, by Country (2020-2032) (USD Billion)

11.3.1.3 Eastern Europe Immersive Virtual Reality Market Estimates and Forecasts, By Component (2020-2032) (USD Billion) 

11.3.1.4 Eastern Europe Immersive Virtual Reality Market Estimates and Forecasts, By Technology (2020-2032) (USD Billion)

11.3.1.5 Eastern Europe Immersive Virtual Reality Market Estimates and Forecasts, By End-use (2020-2032) (USD Billion)

11.3.1.6 Eastern Europe Immersive Virtual Reality Market Estimates and Forecasts, By Device (2020-2032) (USD Billion)

11.3.1.7 Poland

11.3.1.7.1 Poland Immersive Virtual Reality Market Estimates and Forecasts, By Component (2020-2032) (USD Billion)

11.3.1.7.2 Poland Immersive Virtual Reality Market Estimates and Forecasts, By Technology (2020-2032) (USD Billion)

11.3.1.7.3 Poland Immersive Virtual Reality Market Estimates and Forecasts, By End-use (2020-2032) (USD Billion)

11.3.1.7.4 Poland Immersive Virtual Reality Market Estimates and Forecasts, By Device (2020-2032) (USD Billion)

11.3.1.8 Romania

11.3.1.8.1 Romania Immersive Virtual Reality Market Estimates and Forecasts, By Component (2020-2032) (USD Billion)

11.3.1.8.2 Romania Immersive Virtual Reality Market Estimates and Forecasts, By Technology (2020-2032) (USD Billion)

11.3.1.8.3 Romania Immersive Virtual Reality Market Estimates and Forecasts, By End-use (2020-2032) (USD Billion)

11.3.1.8.4 Romania Immersive Virtual Reality Market Estimates and Forecasts, By Device (2020-2032) (USD Billion)

11.3.1.9 Hungary

11.3.1.9.1 Hungary Immersive Virtual Reality Market Estimates and Forecasts, By Component (2020-2032) (USD Billion)

11.3.1.9.2 Hungary Immersive Virtual Reality Market Estimates and Forecasts, By Technology (2020-2032) (USD Billion)

11.3.1.9.3 Hungary Immersive Virtual Reality Market Estimates and Forecasts, By End-use (2020-2032) (USD Billion)

11.3.1.9.4 Hungary Immersive Virtual Reality Market Estimates and Forecasts, By Device (2020-2032) (USD Billion)

11.3.1.10 Turkey

11.3.1.10.1 Turkey Immersive Virtual Reality Market Estimates and Forecasts, By Component (2020-2032) (USD Billion)

11.3.1.10.2 Turkey Immersive Virtual Reality Market Estimates and Forecasts, By Technology (2020-2032) (USD Billion)

11.3.1.10.3 Turkey Immersive Virtual Reality Market Estimates and Forecasts, By End-use (2020-2032) (USD Billion)

11.3.1.10.4 Turkey Immersive Virtual Reality Market Estimates and Forecasts, By Device (2020-2032) (USD Billion)

11.3.1.11 Rest of Eastern Europe

11.3.1.11.1 Rest of Eastern Europe Immersive Virtual Reality Market Estimates and Forecasts, By Component (2020-2032) (USD Billion)

11.3.1.11.2 Rest of Eastern Europe Immersive Virtual Reality Market Estimates and Forecasts, By Technology (2020-2032) (USD Billion)

11.3.1.11.3 Rest of Eastern Europe Immersive Virtual Reality Market Estimates and Forecasts, By End-use (2020-2032) (USD Billion)

11.3.1.11.4 Rest of Eastern Europe Immersive Virtual Reality Market Estimates and Forecasts, By Device (2020-2032) (USD Billion)

11.3.2 Western Europe

11.3.2.1 Trends Analysis

11.3.2.2 Western Europe Immersive Virtual Reality Market Estimates and Forecasts, by Country (2020-2032) (USD Billion)

11.3.2.3 Western Europe Immersive Virtual Reality Market Estimates and Forecasts, By Component (2020-2032) (USD Billion) 

11.3.2.4 Western Europe Immersive Virtual Reality Market Estimates and Forecasts, By Technology (2020-2032) (USD Billion)

11.3.2.5 Western Europe Immersive Virtual Reality Market Estimates and Forecasts, By End-use (2020-2032) (USD Billion)

11.3.2.6 Western Europe Immersive Virtual Reality Market Estimates and Forecasts, By Device (2020-2032) (USD Billion)

11.3.2.7 Germany

11.3.2.7.1 Germany Immersive Virtual Reality Market Estimates and Forecasts, By Component (2020-2032) (USD Billion)

11.3.2.7.2 Germany Immersive Virtual Reality Market Estimates and Forecasts, By Technology (2020-2032) (USD Billion)

11.3.2.7.3 Germany Immersive Virtual Reality Market Estimates and Forecasts, By End-use (2020-2032) (USD Billion)

11.3.2.7.4 Germany Immersive Virtual Reality Market Estimates and Forecasts, By Device (2020-2032) (USD Billion)

11.3.2.8 France

11.3.2.8.1 France Immersive Virtual Reality Market Estimates and Forecasts, By Component (2020-2032) (USD Billion)

11.3.2.8.2 France Immersive Virtual Reality Market Estimates and Forecasts, By Technology (2020-2032) (USD Billion)

11.3.2.8.3 France Immersive Virtual Reality Market Estimates and Forecasts, By End-use (2020-2032) (USD Billion)

11.3.2.8.4 France Immersive Virtual Reality Market Estimates and Forecasts, By Device (2020-2032) (USD Billion)

11.3.2.9 UK

11.3.2.9.1 UK Immersive Virtual Reality Market Estimates and Forecasts, By Component (2020-2032) (USD Billion)

11.3.2.9.2 UK Immersive Virtual Reality Market Estimates and Forecasts, By Technology (2020-2032) (USD Billion)

11.3.2.9.3 UK Immersive Virtual Reality Market Estimates and Forecasts, By End-use (2020-2032) (USD Billion)

11.3.2.9.4 UK Immersive Virtual Reality Market Estimates and Forecasts, By Device (2020-2032) (USD Billion)

11.3.2.10 Italy

11.3.2.10.1 Italy Immersive Virtual Reality Market Estimates and Forecasts, By Component (2020-2032) (USD Billion)

11.3.2.10.2 Italy Immersive Virtual Reality Market Estimates and Forecasts, By Technology (2020-2032) (USD Billion)

11.3.2.10.3 Italy Immersive Virtual Reality Market Estimates and Forecasts, By End-use (2020-2032) (USD Billion)

11.3.2.10.4 Italy Immersive Virtual Reality Market Estimates and Forecasts, By Device (2020-2032) (USD Billion)

11.3.2.11 Spain

11.3.2.11.1 Spain Immersive Virtual Reality Market Estimates and Forecasts, By Component (2020-2032) (USD Billion)

11.3.2.11.2 Spain Immersive Virtual Reality Market Estimates and Forecasts, By Technology (2020-2032) (USD Billion)

11.3.2.11.3 Spain Immersive Virtual Reality Market Estimates and Forecasts, By End-use (2020-2032) (USD Billion)

11.3.2.11.4 Spain Immersive Virtual Reality Market Estimates and Forecasts, By Device (2020-2032) (USD Billion)

11.3.2.12 Netherlands

11.3.2.12.1 Netherlands Immersive Virtual Reality Market Estimates and Forecasts, By Component (2020-2032) (USD Billion)

11.3.2.12.2 Netherlands Immersive Virtual Reality Market Estimates and Forecasts, By Technology (2020-2032) (USD Billion)

11.3.2.12.3 Netherlands Immersive Virtual Reality Market Estimates and Forecasts, By End-use (2020-2032) (USD Billion)

11.3.2.12.4 Netherlands Immersive Virtual Reality Market Estimates and Forecasts, By Device (2020-2032) (USD Billion)

11.3.2.13 Switzerland

11.3.2.13.1 Switzerland Immersive Virtual Reality Market Estimates and Forecasts, By Component (2020-2032) (USD Billion)

11.3.2.13.2 Switzerland Immersive Virtual Reality Market Estimates and Forecasts, By Technology (2020-2032) (USD Billion)

11.3.2.13.3 Switzerland Immersive Virtual Reality Market Estimates and Forecasts, By End-use (2020-2032) (USD Billion)

11.3.2.13.4 Switzerland Immersive Virtual Reality Market Estimates and Forecasts, By Device (2020-2032) (USD Billion)

11.3.2.14 Austria

11.3.2.14.1 Austria Immersive Virtual Reality Market Estimates and Forecasts, By Component (2020-2032) (USD Billion)

11.3.2.14.2 Austria Immersive Virtual Reality Market Estimates and Forecasts, By Technology (2020-2032) (USD Billion)

11.3.2.14.3 Austria Immersive Virtual Reality Market Estimates and Forecasts, By End-use (2020-2032) (USD Billion)

11.3.2.14.4 Austria Immersive Virtual Reality Market Estimates and Forecasts, By Device (2020-2032) (USD Billion)

11.3.2.15 Rest of Western Europe

11.3.2.15.1 Rest of Western Europe Immersive Virtual Reality Market Estimates and Forecasts, By Component (2020-2032) (USD Billion)

11.3.2.15.2 Rest of Western Europe Immersive Virtual Reality Market Estimates and Forecasts, By Technology (2020-2032) (USD Billion)

11.3.2.15.3 Rest of Western Europe Immersive Virtual Reality Market Estimates and Forecasts, By End-use (2020-2032) (USD Billion)

11.3.2.15.4 Rest of Western Europe Immersive Virtual Reality Market Estimates and Forecasts, By Device (2020-2032) (USD Billion)

11.4 Asia Pacific

11.4.1 Trends Analysis

11.4.2 Asia Pacific Immersive Virtual Reality Market Estimates and Forecasts, by Country (2020-2032) (USD Billion)

11.4.3 Asia Pacific Immersive Virtual Reality Market Estimates and Forecasts, By Component (2020-2032) (USD Billion) 

11.4.4 Asia Pacific Immersive Virtual Reality Market Estimates and Forecasts, By Technology (2020-2032) (USD Billion)

11.4.5 Asia Pacific Immersive Virtual Reality Market Estimates and Forecasts, By End-use (2020-2032) (USD Billion)

11.4.6 Asia Pacific Immersive Virtual Reality Market Estimates and Forecasts, By Device (2020-2032) (USD Billion)

11.4.7 China

11.4.7.1 China Immersive Virtual Reality Market Estimates and Forecasts, By Component (2020-2032) (USD Billion)

11.4.7.2 China Immersive Virtual Reality Market Estimates and Forecasts, By Technology (2020-2032) (USD Billion)

11.4.7.3 China Immersive Virtual Reality Market Estimates and Forecasts, By End-use (2020-2032) (USD Billion)

11.4.7.4 China Immersive Virtual Reality Market Estimates and Forecasts, By Device (2020-2032) (USD Billion)

11.4.8 India

11.4.8.1 India Immersive Virtual Reality Market Estimates and Forecasts, By Component (2020-2032) (USD Billion)

11.4.8.2 India Immersive Virtual Reality Market Estimates and Forecasts, By Technology (2020-2032) (USD Billion)

11.4.8.3 India Immersive Virtual Reality Market Estimates and Forecasts, By End-use (2020-2032) (USD Billion)

11.4.8.4 India Immersive Virtual Reality Market Estimates and Forecasts, By Device (2020-2032) (USD Billion)

11.4.9 Japan

11.4.9.1 Japan Immersive Virtual Reality Market Estimates and Forecasts, By Component (2020-2032) (USD Billion)

11.4.9.2 Japan Immersive Virtual Reality Market Estimates and Forecasts, By Technology (2020-2032) (USD Billion)

11.4.9.3 Japan Immersive Virtual Reality Market Estimates and Forecasts, By End-use (2020-2032) (USD Billion)

11.4.9.4 Japan Immersive Virtual Reality Market Estimates and Forecasts, By Device (2020-2032) (USD Billion)

11.4.10 South Korea

11.4.10.1 South Korea Immersive Virtual Reality Market Estimates and Forecasts, By Component (2020-2032) (USD Billion)

11.4.10.2 South Korea Immersive Virtual Reality Market Estimates and Forecasts, By Technology (2020-2032) (USD Billion)

11.4.10.3 South Korea Immersive Virtual Reality Market Estimates and Forecasts, By End-use (2020-2032) (USD Billion)

11.4.10.4 South Korea Immersive Virtual Reality Market Estimates and Forecasts, By Device (2020-2032) (USD Billion)

11.4.11 Vietnam

11.4.11.1 Vietnam Immersive Virtual Reality Market Estimates and Forecasts, By Component (2020-2032) (USD Billion)

11.4.11.2 Vietnam Immersive Virtual Reality Market Estimates and Forecasts, By Technology (2020-2032) (USD Billion)

11.4.11.3 Vietnam Immersive Virtual Reality Market Estimates and Forecasts, By End-use (2020-2032) (USD Billion)

11.4.11.4 Vietnam Immersive Virtual Reality Market Estimates and Forecasts, By Device (2020-2032) (USD Billion)

11.4.12 Singapore

11.4.12.1 Singapore Immersive Virtual Reality Market Estimates and Forecasts, By Component (2020-2032) (USD Billion)

11.4.12.2 Singapore Immersive Virtual Reality Market Estimates and Forecasts, By Technology (2020-2032) (USD Billion)

11.4.12.3 Singapore Immersive Virtual Reality Market Estimates and Forecasts, By End-use (2020-2032) (USD Billion)

11.4.12.4 Singapore Immersive Virtual Reality Market Estimates and Forecasts, By Device (2020-2032) (USD Billion)

11.4.13 Australia

11.4.13.1 Australia Immersive Virtual Reality Market Estimates and Forecasts, By Component (2020-2032) (USD Billion)

11.4.13.2 Australia Immersive Virtual Reality Market Estimates and Forecasts, By Technology (2020-2032) (USD Billion)

11.4.13.3 Australia Immersive Virtual Reality Market Estimates and Forecasts, By End-use (2020-2032) (USD Billion)

11.4.13.4 Australia Immersive Virtual Reality Market Estimates and Forecasts, By Device (2020-2032) (USD Billion)

11.4.14 Rest of Asia Pacific

11.4.14.1 Rest of Asia Pacific Immersive Virtual Reality Market Estimates and Forecasts, By Component (2020-2032) (USD Billion)

11.4.14.2 Rest of Asia Pacific Immersive Virtual Reality Market Estimates and Forecasts, By Technology (2020-2032) (USD Billion)

11.4.14.3 Rest of Asia Pacific Immersive Virtual Reality Market Estimates and Forecasts, By End-use (2020-2032) (USD Billion)

11.4.14.4 Rest of Asia Pacific Immersive Virtual Reality Market Estimates and Forecasts, By Device (2020-2032) (USD Billion)

11.5 Middle East and Africa

11.5.1 Middle East

11.5.1.1 Trends Analysis

11.5.1.2 Middle East Immersive Virtual Reality Market Estimates and Forecasts, by Country (2020-2032) (USD Billion)

11.5.1.3 Middle East Immersive Virtual Reality Market Estimates and Forecasts, By Component (2020-2032) (USD Billion) 

11.5.1.4 Middle East Immersive Virtual Reality Market Estimates and Forecasts, By Technology (2020-2032) (USD Billion)

11.5.1.5 Middle East Immersive Virtual Reality Market Estimates and Forecasts, By End-use (2020-2032) (USD Billion)

11.5.1.6 Middle East Immersive Virtual Reality Market Estimates and Forecasts, By Device (2020-2032) (USD Billion)

11.5.1.7 UAE

11.5.1.7.1 UAE Immersive Virtual Reality Market Estimates and Forecasts, By Component (2020-2032) (USD Billion)

11.5.1.7.2 UAE Immersive Virtual Reality Market Estimates and Forecasts, By Technology (2020-2032) (USD Billion)

11.5.1.7.3 UAE Immersive Virtual Reality Market Estimates and Forecasts, By End-use (2020-2032) (USD Billion)

11.5.1.7.4 UAE Immersive Virtual Reality Market Estimates and Forecasts, By Device  (2020-2032) (USD Billion)

11.5.1.8 Egypt

11.5.1.8.1 Egypt Immersive Virtual Reality Market Estimates and Forecasts, By Component (2020-2032) (USD Billion)

11.5.1.8.2 Egypt Immersive Virtual Reality Market Estimates and Forecasts, By Technology (2020-2032) (USD Billion)

11.5.1.8.3 Egypt Immersive Virtual Reality Market Estimates and Forecasts, By End-use (2020-2032) (USD Billion)

11.5.1.8.4 Egypt Immersive Virtual Reality Market Estimates and Forecasts, By Device (2020-2032) (USD Billion)

11.5.1.9 Saudi Arabia

11.5.1.9.1 Saudi Arabia Immersive Virtual Reality Market Estimates and Forecasts, By Component (2020-2032) (USD Billion)

11.5.1.9.2 Saudi Arabia Immersive Virtual Reality Market Estimates and Forecasts, By Technology (2020-2032) (USD Billion)

11.5.1.9.3 Saudi Arabia Immersive Virtual Reality Market Estimates and Forecasts, By End-use (2020-2032) (USD Billion)

11.5.1.9.4 Saudi Arabia Immersive Virtual Reality Market Estimates and Forecasts, By Device (2020-2032) (USD Billion)

11.5.1.10 Qatar

11.5.1.10.1 Qatar Immersive Virtual Reality Market Estimates and Forecasts, By Component (2020-2032) (USD Billion)

11.5.1.10.2 Qatar Immersive Virtual Reality Market Estimates and Forecasts, By Technology (2020-2032) (USD Billion)

11.5.1.10.3 Qatar Immersive Virtual Reality Market Estimates and Forecasts, By End-use (2020-2032) (USD Billion)

11.5.1.10.4 Qatar Immersive Virtual Reality Market Estimates and Forecasts, By Device (2020-2032) (USD Billion)

11.5.1.11 Rest of Middle East

11.5.1.11.1 Rest of Middle East Immersive Virtual Reality Market Estimates and Forecasts, By Component (2020-2032) (USD Billion)

11.5.1.11.2 Rest of Middle East Immersive Virtual Reality Market Estimates and Forecasts, By Technology (2020-2032) (USD Billion)

11.5.1.11.3 Rest of Middle East Immersive Virtual Reality Market Estimates and Forecasts, By End-use (2020-2032) (USD Billion)

11.5.1.11.4 Rest of Middle East Immersive Virtual Reality Market Estimates and Forecasts, By Device (2020-2032) (USD Billion)

11.5.2 Africa

11.5.2.1 Trends Analysis

11.5.2.2 Africa Immersive Virtual Reality Market Estimates and Forecasts, by Country (2020-2032) (USD Billion)

11.5.2.3 Africa Immersive Virtual Reality Market Estimates and Forecasts, By Component (2020-2032) (USD Billion) 

11.5.2.4 Africa Immersive Virtual Reality Market Estimates and Forecasts, By Technology (2020-2032) (USD Billion)

11.5.2.5 Africa Immersive Virtual Reality Market Estimates and Forecasts, By End-use (2020-2032) (USD Billion)

11.5.2.6 Africa Immersive Virtual Reality Market Estimates and Forecasts, By Device (2020-2032) (USD Billion)

11.5.2.7 South Africa

11.5.2.7.1 South Africa Immersive Virtual Reality Market Estimates and Forecasts, By Component (2020-2032) (USD Billion)

11.5.2.7.2 South Africa Immersive Virtual Reality Market Estimates and Forecasts, By Technology (2020-2032) (USD Billion)

11.5.2.7.3 South Africa Immersive Virtual Reality Market Estimates and Forecasts, By End-use (2020-2032) (USD Billion)

11.5.2.7.4 South Africa Immersive Virtual Reality Market Estimates and Forecasts, By Device (2020-2032) (USD Billion)

11.5.2.8 Nigeria

11.5.2.8.1 Nigeria Immersive Virtual Reality Market Estimates and Forecasts, By Component (2020-2032) (USD Billion)

11.5.2.8.2 Nigeria Immersive Virtual Reality Market Estimates and Forecasts, By Technology (2020-2032) (USD Billion)

11.5.2.8.3 Nigeria Immersive Virtual Reality Market Estimates and Forecasts, By End-use (2020-2032) (USD Billion)

11.5.2.8.4 Nigeria Immersive Virtual Reality Market Estimates and Forecasts, By Device (2020-2032) (USD Billion)

11.5.2.9 Rest of Africa

11.5.2.9.1 Rest of Africa Immersive Virtual Reality Market Estimates and Forecasts, By Component (2020-2032) (USD Billion)

11.5.2.9.2 Rest of Africa Immersive Virtual Reality Market Estimates and Forecasts, By Technology (2020-2032) (USD Billion)

11.5.2.9.3 Rest of Africa Immersive Virtual Reality Market Estimates and Forecasts, By End-use (2020-2032) (USD Billion)

11.5.2.9.4 Rest of Africa Immersive Virtual Reality Market Estimates and Forecasts, By Device (2020-2032) (USD Billion)

11.6 Latin America

11.6.1 Trends Analysis

11.6.2 Latin America Immersive Virtual Reality Market Estimates and Forecasts, by Country (2020-2032) (USD Billion)

11.6.3 Latin America Immersive Virtual Reality Market Estimates and Forecasts, By Component (2020-2032) (USD Billion) 

11.6.4 Latin America Immersive Virtual Reality Market Estimates and Forecasts, By Technology (2020-2032) (USD Billion)

11.6.5 Latin America Immersive Virtual Reality Market Estimates and Forecasts, By End-use (2020-2032) (USD Billion)

11.6.6 Latin America Immersive Virtual Reality Market Estimates and Forecasts, By Device (2020-2032) (USD Billion)

11.6.7 Brazil

11.6.7.1 Brazil Immersive Virtual Reality Market Estimates and Forecasts, By Component (2020-2032) (USD Billion)

11.6.7.2 Brazil Immersive Virtual Reality Market Estimates and Forecasts, By Technology (2020-2032) (USD Billion)

11.6.7.3 Brazil Immersive Virtual Reality Market Estimates and Forecasts, By End-use (2020-2032) (USD Billion)

11.6.7.4 Brazil Immersive Virtual Reality Market Estimates and Forecasts, By Device (2020-2032) (USD Billion)

11.6.8 Argentina

11.6.8.1 Argentina Immersive Virtual Reality Market Estimates and Forecasts, By Component (2020-2032) (USD Billion)

11.6.8.2 Argentina Immersive Virtual Reality Market Estimates and Forecasts, By Technology (2020-2032) (USD Billion)

11.6.8.3 Argentina Immersive Virtual Reality Market Estimates and Forecasts, By End-use (2020-2032) (USD Billion)

11.6.8.4 Argentina Immersive Virtual Reality Market Estimates and Forecasts, By Device (2020-2032) (USD Billion)

11.6.9 Colombia

11.6.9.1 Colombia Immersive Virtual Reality Market Estimates and Forecasts, By Component (2020-2032) (USD Billion)

11.6.9.2 Colombia Immersive Virtual Reality Market Estimates and Forecasts, By Technology (2020-2032) (USD Billion)

11.6.9.3 Colombia Immersive Virtual Reality Market Estimates and Forecasts, By End-use (2020-2032) (USD Billion)

11.6.9.4 Colombia Immersive Virtual Reality Market Estimates and Forecasts, By Device (2020-2032) (USD Billion)

11.6.10 Rest of Latin America

11.6.10.1 Rest of Latin America Immersive Virtual Reality Market Estimates and Forecasts, By Component (2020-2032) (USD Billion)

11.6.10.2 Rest of Latin America Immersive Virtual Reality Market Estimates and Forecasts, By Technology (2020-2032) (USD Billion)

11.6.10.3 Rest of Latin America Immersive Virtual Reality Market Estimates and Forecasts, By End-use (2020-2032) (USD Billion)

11.6.10.4 Rest of Latin America Immersive Virtual Reality Market Estimates and Forecasts, By Device (2020-2032) (USD Billion)

12. Company Profiles

12.1 Microsoft Corporation

12.1.1 Company Overview

12.1.2 Financial

12.1.3 Products/ Services Offered

12.1.4 SWOT Analysis

12.2 HTC Corporation

12.2.1 Company Overview

12.2.2 Financial

12.2.3 Products/ Services Offered

12.2.4 SWOT Analysis

12.3 Google LLC

12.3.1 Company Overview

12.3.2 Financial

12.3.3 Products/ Services Offered

12.3.4 SWOT Analysis

12.4 Magic Leap

12.4.1 Company Overview

12.4.2 Financial

12.4.3 Products/ Services Offered

12.4.4 SWOT Analysis

12.5 Meta

12.5.1 Company Overview

12.5.2 Financial

12.5.3 Products/ Services Offered

12.5.4 SWOT Analysis

12.6 Samsung Electronics Co., Ltd.

12.6.1 Company Overview

12.6.2 Financial

12.6.3 Products/ Services Offered

12.6.4 SWOT Analysis

12.7 Sony Corporation

12.7.1 Company Overview

12.7.2 Financial

12.7.3 Products/ Services Offered

12.7.4 SWOT Analysis

12.8 Unity Technologies

12.8.1 Company Overview

12.8.2 Financial

12.8.3 Products/ Services Offered

12.8.4 SWOT Analysis

12.9 Autodesk, Inc.

12.9.1 Company Overview

12.9.2 Financial

12.9.3 Products/ Services Offered

12.9.4 SWOT Analysis

12.10 EON Reality, Inc.

12.10.1 Company Overview

12.10.2 Financial

12.10.3 Products/ Services Offered

12.10.4 SWOT Analysis

13. Use Cases and Best Practices

14. Conclusion

An accurate research report requires proper strategizing as well as implementation. There are multiple factors involved in the completion of good and accurate research report and selecting the best methodology to compete the research is the toughest part. Since the research reports we provide play a crucial role in any company’s decision-making process, therefore we at SNS Insider always believe that we should choose the best method which gives us results closer to reality. This allows us to reach at a stage wherein we can provide our clients best and accurate investment to output ratio.

Each report that we prepare takes a timeframe of 350-400 business hours for production. Starting from the selection of titles through a couple of in-depth brain storming session to the final QC process before uploading our titles on our website we dedicate around 350 working hours. The titles are selected based on their current market cap and the foreseen CAGR and growth.


The 5 steps process:

Step 1: Secondary Research:

Secondary Research or Desk Research is as the name suggests is a research process wherein, we collect data through the readily available information. In this process we use various paid and unpaid databases which our team has access to and gather data through the same. This includes examining of listed companies’ annual reports, Journals, SEC filling etc. Apart from this our team has access to various associations across the globe across different industries. Lastly, we have exchange relationships with various university as well as individual libraries.

Secondary Research

Step 2: Primary Research

When we talk about primary research, it is a type of study in which the researchers collect relevant data samples directly, rather than relying on previously collected data.  This type of research is focused on gaining content specific facts that can be sued to solve specific problems. Since the collected data is fresh and first hand therefore it makes the study more accurate and genuine.

We at SNS Insider have divided Primary Research into 2 parts.

Part 1 wherein we interview the KOLs of major players as well as the upcoming ones across various geographic regions. This allows us to have their view over the market scenario and acts as an important tool to come closer to the accurate market numbers. As many as 45 paid and unpaid primary interviews are taken from both the demand and supply side of the industry to make sure we land at an accurate judgement and analysis of the market.

This step involves the triangulation of data wherein our team analyses the interview transcripts, online survey responses and observation of on filed participants. The below mentioned chart should give a better understanding of the part 1 of the primary interview.

Primary Research

Part 2: In this part of primary research the data collected via secondary research and the part 1 of the primary research is validated with the interviews from individual consultants and subject matter experts.

Consultants are those set of people who have at least 12 years of experience and expertise within the industry whereas Subject Matter Experts are those with at least 15 years of experience behind their back within the same space. The data with the help of two main processes i.e., FGDs (Focused Group Discussions) and IDs (Individual Discussions). This gives us a 3rd party nonbiased primary view of the market scenario making it a more dependable one while collation of the data pointers.

Step 3: Data Bank Validation

Once all the information is collected via primary and secondary sources, we run that information for data validation. At our intelligence centre our research heads track a lot of information related to the market which includes the quarterly reports, the daily stock prices, and other relevant information. Our data bank server gets updated every fortnight and that is how the information which we collected using our primary and secondary information is revalidated in real time.

Data Bank Validation

Step 4: QA/QC Process

After all the data collection and validation our team does a final level of quality check and quality assurance to get rid of any unwanted or undesired mistakes. This might include but not limited to getting rid of the any typos, duplication of numbers or missing of any important information. The people involved in this process include technical content writers, research heads and graphics people. Once this process is completed the title gets uploader on our platform for our clients to read it.

Step 5: Final QC/QA Process:

This is the last process and comes when the client has ordered the study. In this process a final QA/QC is done before the study is emailed to the client. Since we believe in giving our clients a good experience of our research studies, therefore, to make sure that we do not lack at our end in any way humanly possible we do a final round of quality check and then dispatch the study to the client.

Key Segments:

By Component

  • Hardware

  • Software

  • Services

By Technology

  • Non-Immersive

  • Semi & Fully Immersive

By Device

  • Head Mounted Display

  • Gesture Tracking Device

  • Projectors & Display Wall

By End-use

  • Aerospace & Defence

  • Manufacturing

  • Automotive

  • Healthcare

  • Retail & E-commerce

  • Media & Entertainment

  • Gaming

Request for Segment Customization as per your Business Requirement: Segment Customization Request

Regional Coverage:

North America

  • US

  • Canada

  • Mexico

Europe

  • Eastern Europe

    • Poland

    • Romania

    • Hungary

    • Turkey

    • Rest of Eastern Europe

  • Western Europe

    • Germany

    • France

    • UK

    • Italy

    • Spain

    • Netherlands

    • Switzerland

    • Austria

    • Rest of Western Europe

Asia Pacific

  • China

  • India

  • Japan

  • South Korea

  • Vietnam

  • Singapore

  • Australia

  • Rest of Asia Pacific

Middle East & Africa

  • Middle East

    • UAE

    • Egypt

    • Saudi Arabia

    • Qatar

    • Rest of Middle East

  • Africa

    • Nigeria

    • South Africa

    • Rest of Africa

Latin America

  • Brazil

  • Argentina

  • Colombia

  • Rest of Latin America

Request for Country Level Research Report: Country Level Customization Request

Available Customization

With the given market data, SNS Insider offers customization as per the company’s specific needs. The following customization options are available for the report:

  • Detailed Volume Analysis

  • Criss-Cross segment analysis (e.g. Product X Application)

  • Competitive Product Benchmarking

  • Geographic Analysis

  • Additional countries in any of the regions

  • Customized Data Representation

  • Detailed analysis and profiling of additional market players


  •            5000 (33% Discount)


  •            8950 (40% Discount)


  •            3050 (23% Discount)

Start a Conversation

Hi! Click one of our member below to chat on Phone