image

Immersive Display in Entertainment Market Report Scope & Overview:

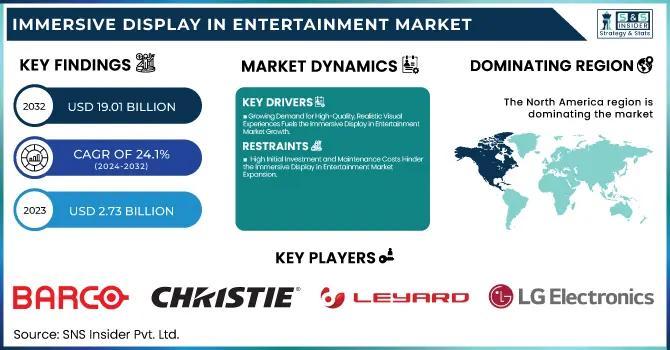
The Immersive Display in Entertainment Market Size was valued at USD 2.73 Billion in 2023 and is expected to reach USD 19.01 Billion by 2032 and grow at a CAGR of 24.1% over the forecast period 2024-2032.

The Market is expanding rapidly due to the rising demand for high-quality visual experiences in cinemas, theme parks, and live events. Technologies like LED walls, OLED panels, projection mapping, and holographic displays are transforming audience engagement. Key players such as Barco, Christie Digital, Samsung, and Sony are innovating with 4K & 8K displays, AI-driven content, and interactive projections. The growing adoption of XR, AR, and VR in theme parks, exhibitions, and gaming is further driving growth. Advancements in microLED, OLED, and laser projection are making immersive experiences more accessible and cost-effective, fueling continued market expansion.

Market Dynamics

Key Drivers:

  • Growing Demand for High-Quality, Realistic Visual Experiences Fuels the Immersive Display in Entertainment Market Growth

The increasing demand for high-quality, engaging visual experiences in cinemas, theme parks, live events, and exhibitions is a key driver of the immersive display in the entertainment market. Consumers seek realistic, multi-sensory experiences, pushing entertainment venues to adopt advanced LED walls, OLED panels, projection mapping, and holographic displays. The integration of 4K & 8K resolution, AI-driven content rendering, and interactive projection technologies has significantly enhanced audience engagement. Companies like Barco, Christie Digital, and Sony are investing in high-resolution, AI-powered immersive display solutions to cater to this growing demand.

Additionally, extended reality (XR), augmented reality (AR), and virtual reality (VR) are revolutionizing the industry, allowing entertainment providers to create highly interactive and lifelike experiences. As entertainment venues continue upgrading their display technologies to offer cinematic and immersive environments, the market is experiencing significant expansion, further driven by increasing consumer expectations for hyper-realistic visual content.

Restraint

  • High Initial Investment and Maintenance Costs Hinder the Immersive Display in Entertainment Market Expansion

The adoption of immersive display technologies in the entertainment industry is often hindered by the high initial investment and maintenance costs associated with advanced LED, OLED, and projection systems. Large-scale immersive setups require specialized hardware, software, and calibration, making them expensive for small and mid-sized entertainment businesses. Additionally, regular maintenance, content upgrades, and energy consumption further increase operational costs. Companies investing in microLED displays, laser projection, and AI-driven visual rendering must also allocate significant funds for customized installations, a skilled workforce, and continuous software updates.

While major players like Samsung, Panasonic, and LG Electronics are developing cost-efficient display solutions, the price barrier remains a challenge for widespread adoption. Moreover, upgrading older entertainment venues with state-of-the-art immersive displays requires substantial retrofitting, further adding to expenses. The high capital requirement often limits adoption to large cinema chains, theme parks, and major event organizers, slowing down market penetration.

Opportunity:

  • Rising Adoption of Extended Reality (XR) and AI-Driven Content Enhances Growth in the Immersive Display Market

The increasing adoption of Extended Reality (XR), Augmented Reality (AR), Virtual Reality (VR), and AI-driven content presents a major opportunity for the immersive display in the entertainment market. Entertainment providers are integrating XR-powered immersive displays to create highly interactive, lifelike experiences in theme parks, exhibitions, concerts, and gaming arenas. AI-driven real-time rendering and automated content enhancement are improving the efficiency of immersive displays, making them more engaging and cost-effective. Disguise Technologies and ROE Visual have launched AI-powered real-time rendering systems, enabling seamless virtual production in film studios and live events.

Additionally, the growing demand for immersive experiences in gaming, virtual concerts, and live sports broadcasts is accelerating the adoption of immersive display technologies. The expansion of cloud-based content delivery, 5G integration, and AI-enhanced display processing further enhances the market potential, enabling entertainment providers to offer next-generation immersive experiences to global audiences.

Challenge:

  • Content Creation and Compatibility Issues Limit the Widespread Adoption of Immersive Display Technologies

A major challenge in the immersive display in the entertainment market is the complexity of content creation and compatibility issues. Unlike traditional display solutions, immersive technologies require high-resolution, AI-optimized, and interactive content that must be specifically designed for LED walls, holographic displays, and projection mapping systems. The development of 4K, 8K, and real-time rendered content is resource-intensive and requires specialized software, hardware, and skilled professionals.

Additionally, ensuring compatibility between different immersive display systems remains a significant hurdle. Streaming platforms, virtual production studios, and content creators must adapt their workflows to support multiple display formats, refresh rates, and resolutions. Companies like Prysm Systems and Shenzhen INFiLED Electronics are working on standardized display solutions, but challenges in content optimization, latency, and seamless integration with AR/VR platforms persist. Without efficient content standardization, the adoption of immersive displays in widespread entertainment applications remains restricted.

Segments Analysis

By Technology

The LED segment led the immersive display in entertainment market with a 46% revenue share in 2023, driven by its superior brightness, energy efficiency, and scalability. LED walls, fine-pitch displays, and direct-view LED panels have become the preferred choice for theaters, concerts, theme parks, and live events, offering seamless, high-resolution visuals. Leyard’s fine-pitch LED displays have enhanced museum and exhibition setups, providing ultra-clear immersive experiences. The increasing adoption of XR, AI-enhanced content processing, and HDR-enabled LED panels is further accelerating market growth. With continued investments in microLED technology, the LED segment remains a dominant force in delivering high-quality, large-scale immersive entertainment experiences.

The OLED segment is projected to grow at the highest CAGR of 24.9% during the forecast period, driven by its superior contrast, flexibility, and true-to-life color accuracy. OLED displays are widely adopted in cinema halls, theme parks, and content creation studios due to their deep blacks, high dynamic range (HDR), and ultra-thin designs. LG's Transparent OLED Signage has revolutionized museum exhibitions and retail entertainment, offering interactive, see-through displays. Sony’s Crystal LED display system, based on OLED technology, has been widely used in virtual film production and high-end theaters. Panasonic’s OLED projection solutions have enhanced immersive experiences in exhibitions and entertainment venues. With the growing integration of OLED in XR applications, AI-powered content rendering, and foldable display technology.

By Resolution

The 4K resolution segment led the immersive display in the entertainment market in 2023, driven by its high visual clarity, superior color accuracy, and cost-effectiveness compared to higher resolutions. 4K displays have become the industry standard for cinemas, live concerts, theme parks, and virtual production studios, offering ultra-HD visuals that enhance audience engagement. Sony’s VPL-GTZ380 4K SXRD projector has gained popularity in theaters and large-scale entertainment venues due to its high brightness and immersive image quality. Barco introduced its 4K laser projectors for cinemas and museum exhibits, delivering sharper visuals with improved energy efficiency. Christie Digital expanded its 4K RGB pure laser projection lineup, providing high contrast and HDR support for theme parks and planetariums. As content creators and entertainment venues continue upgrading to 4K immersive displays, the segment remains dominant in shaping the future of high-definition, large-scale visual entertainment.

The 8K resolution segment is projected to grow at the highest CAGR during the forecast period, driven by its unmatched image sharpness, greater pixel density, and increasing adoption in next-generation immersive experiences. While 8K technology is still emerging, its demand is rising in premium cinemas, virtual reality (VR) applications, and high-end theme park attractions, where ultra-detailed visuals are essential for maximum engagement. Sharp launched its 120-inch 8K display panels, catering to exhibitions, esports arenas, and digital signage in entertainment venues. LG’s 8K OLED displays are being utilized in XR-based entertainment, live sports broadcasting, and virtual concert experiences. As content production in 8K increases, along with advancements in AI upscaling and high-speed data processing, the 8K segment is set to redefine ultra-immersive entertainment experiences.

By Application

The Theater & Cinema segment held the largest revenue share in 2023, driven by the widespread adoption of high-resolution projection systems, LED cinema screens, and laser-based immersive displays. As audiences demand ultra-realistic and engaging viewing experiences, 4K and 8K laser projection, HDR-enhanced visuals, and immersive sound integration have become industry standards. Leading companies such as Barco, Christie Digital, and Samsung have played a pivotal role in advancing immersive cinema technology. The rise of 3D, 5D, and interactive cinematic experiences further reinforces the segment’s dominance, as theaters invest in cutting-edge immersive display solutions to attract and retain audiences in the digital age.

The Content Creation Studios segment is projected to grow at the highest CAGR during the forecast period, driven by the rising demand for virtual production, extended reality (XR) environments, and high-resolution digital content creation. Film studios, gaming companies, and digital content producers are increasingly leveraging LED virtual production stages, AI-enhanced rendering, and volumetric capture technologies to create realistic and immersive visuals. ROE Visual’s high-pixel-density LED panels have powered major virtual production studios for creating lifelike environments in films, TV shows, and advertisements. As demand for virtual sets, real-time rendering, and immersive content production accelerates, the Content Creation Studios segment is set to redefine the entertainment landscape.

Regional Analysis

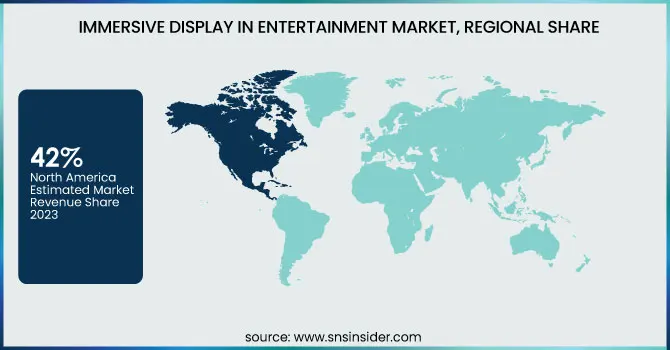
In 2023, North America dominated the immersive display in entertainment market, holding an estimated market share of over 42%. The region’s leadership is attributed to strong technological advancements, high consumer demand for premium entertainment experiences, and significant investments in immersive display technologies. The widespread adoption of 4K and 8K projection systems, LED cinema screens, and AR/VR-based entertainment solutions has fueled market expansion.

Additionally, the growth of virtual production techniques in Hollywood, combined with the increasing deployment of immersive dome theaters, interactive museum exhibits, and high-resolution LED displays in live concerts, has strengthened the region’s dominance. As consumer preferences shift toward highly engaging, real-time content, North America continues to lead in the adoption of cutting-edge immersive display technologies across various entertainment sectors.

The Asia-Pacific region is the fastest-growing market for immersive displays in entertainment, with an estimated CAGR of 25.8% during the forecast period. The region’s rapid growth is fueled by expanding entertainment infrastructure, increasing investments in high-tech amusement parks, and the rising popularity of digital entertainment experiences. The surge in e-sports tournaments, interactive museums, and AR/VR-based gaming arenas has further accelerated demand for high-resolution, large-format display solutions.

Additionally, government initiatives promoting smart city projects and digital entertainment hubs have boosted investments in advanced display technologies, including OLED, MicroLED, and holographic projection. As consumer preferences in Asia-Pacific shift toward personalized and interactive entertainment experiences, the region is poised to experience significant market expansion in immersive display applications.

Key Players

Some of the major players in the Immersive Display in Entertainment Market are:

  • Barco N.V. (XDM-4K30 Projector, LED XT Series Video Walls)

  • Christie Digital Systems USA, Inc. (Christie MicroTiles LED, Christie Griffyn 4K50-RGB Projector)

  • Disguise Technologies Limited (Disguise vx 4+ Media Server, Disguise rx II Real-Time Render Engine)

  • Leyard (Leyard DirectLight Pro Series, Leyard CarbonLight LED Displays)

  • LG Electronics (LG MAGNIT MicroLED Display, LG UltraFine OLED Pro Monitor)

  • Panasonic Holdings Corporation (Panasonic PT-RQ50K 4K Laser Projector, Panasonic TH-55VF1H Video Wall)

  • Prysm Systems, Inc. (Prysm LPD 6K Display, Prysm Cloud Collaboration Platform)

  • ROE Visual (ROE Black Pearl BP2V2 LED Panels, ROE Vanish V8 Transparent LED)

  • Samsung Electronics Co., Ltd. (Samsung The Wall MicroLED, Samsung ONYX Cinema LED Screen)

  • Sharp Corporation (Sharp 8M-B120C 8K Display, Sharp PN-V701 Video Wall)

  • Shenzhen INFiLED Electronics Co., Ltd. (INFiLED DB Series LED Display, INFiLED AM Series for XR Studios)

  • Sony Corporation (Sony Crystal LED C-Series, Sony VPL-GTZ380 4K SXRD Projector)

Recent Trends

  • September 2024: Miraj Cinemas, a prominent Indian cinema chain, selected Barco as its preferred projection provider in collaboration with Qube, aiming to enhance the cinematic experience across its theaters.

  • November 2024: Christie Digital Systems' 4K10-HS laser projectors powered immersive visuals at a new 5D flying theatre in Hebei Province, China, delivering captivating experiences to audiences.

Immersive Display in Entertainment Market Report Scope:

Report Attributes Details
Market Size in 2023 US$ 2.73 Billion
Market Size by 2032 US$ 19.01 Billion
CAGR CAGR of 24.1 % From 2024 to 2032
Base Year 2023
Forecast Period 2024-2032
Historical Data 2020-2022
Report Scope & Coverage Market Size, Segments Analysis, Competitive  Landscape, Regional Analysis, DROC & SWOT Analysis, Forecast Outlook
Key Segments • By Technology (LED, OLED, Others)
• By Resolution (4K, 8K, Hybrid)
• By Application (Theater & Cinema, Entertainment Venues, Museum & Exhibitions, Content Creation Studios, Theme Parks & Amusement Parks, Others)
Regional Analysis/Coverage North America (US, Canada, Mexico), Europe (Eastern Europe [Poland, Romania, Hungary, Turkey, Rest of Eastern Europe] Western Europe] Germany, France, UK, Italy, Spain, Netherlands, Switzerland, Austria, Rest of Western Europe]), Asia Pacific (China, India, Japan, South Korea, Vietnam, Singapore, Australia, Rest of Asia Pacific), Middle East & Africa (Middle East [UAE, Egypt, Saudi Arabia, Qatar, Rest of Middle East], Africa [Nigeria, South Africa, Rest of Africa], Latin America (Brazil, Argentina, Colombia, Rest of Latin America)
Company Profiles Barco N.V., Christie Digital Systems USA, Inc., Disguise Technologies Limited, Leyard, LG Electronics, Panasonic Holdings Corporation, Prysm Systems, Inc., ROE Visual, Samsung Electronics Co., Ltd., Sharp Corporation, Shenzhen INFiLED Electronics Co., Ltd., Sony Corporation.

Frequently Asked Questions

Ans: The Immersive Display in Entertainment Market is expected to grow at a CAGR of 24.1% during 2024-2032.

Ans: The Immersive Display in Entertainment Market size was USD 2.73 billion in 2023 and is expected to Reach USD 19.01 billion by 2032.

Ans: The major growth factor of the Immersive Display in Entertainment Market is the increasing demand for high-quality, interactive, and immersive visual experiences in cinemas, theme parks, and live events.

Ans: The LED segment dominated the Immersive Display in Entertainment Market.

Ans: North America dominated the Immersive Display in Entertainment Market in 2023.

Table of Contents

1. Introduction

1.1 Market Definition

1.2 Scope (Inclusion and Exclusions)

1.3 Research Assumptions

2. Executive Summary

2.1 Market Overview

2.2 Regional Synopsis

2.3 Competitive Summary

3. Research Methodology

3.1 Top-Down Approach

3.2 Bottom-up Approach

3.3. Data Validation

3.4 Primary Interviews

4. Market Dynamics Impact Analysis

4.1 Market Driving Factors Analysis

4.1.1 Drivers

4.1.2 Restraints

4.1.3 Opportunities

4.1.4 Challenges

4.2 PESTLE Analysis

4.3 Porter’s Five Forces Model

5. Statistical Insights and Trends Reporting

5.1 Consumer Engagement Metrics (2023)

5.2 Cost Trends (2023)

5.3 Industry-Specific Demand (2023)

6. Competitive Landscape

6.1 List of Major Companies, By Region

6.2 Market Share Analysis, By Region

6.3 Product Benchmarking

6.3.1 Product specifications and features

6.3.2 Pricing

6.4 Strategic Initiatives

6.4.1 Marketing and promotional activities

6.4.2 Distribution and Supply Chain Strategies

6.4.3 Expansion plans and new product launches

6.4.4 Strategic partnerships and collaborations

6.5 Technological Advancements

6.6 Market Positioning and Branding

7. Immersive Display in Entertainment Market Segmentation, By Technology

7.1 Chapter Overview

7.2 LED

7.2.1 LED Market Trends Analysis (2020-2032)

7.2.2 LED Market Size Estimates and Forecasts to 2032 (USD Billion)

7.3 OLED

7.3.1 OLED Market Trends Analysis (2020-2032)

7.3.2 OLED Market Size Estimates and Forecasts to 2032 (USD Billion)

7.4 Others

7.4.1 Others Market Trends Analysis (2020-2032)

7.4.2 Others Market Size Estimates and Forecasts to 2032 (USD Billion)

8. Immersive Display in Entertainment Market Segmentation, By Application

8.1 Chapter Overview

8.2 Theater & Cinema

8.2.1 Theater & Cinema Market Trends Analysis (2020-2032)

8.2.2 Theater & Cinema Market Size Estimates and Forecasts to 2032 (USD Billion)

8.3 Entertainment Venues

8.3.1 Entertainment VenuesMarket Trends Analysis (2020-2032)

8.3.2 Entertainment Venues Market Size Estimates and Forecasts to 2032 (USD Billion)

8.4 Museum & Exhibitions

8.4.1 Museum & Exhibitions Market Trends Analysis (2020-2032)

8.4.2 Museum & Exhibitions Market Size Estimates and Forecasts to 2032 (USD Billion)

8.5 Content Creation Studios

8.5.1 Content Creation Studios Market Trends Analysis (2020-2032)

8.5.2 Content Creation Studios Market Size Estimates and Forecasts to 2032 (USD Billion)

8.6 Theme Parks & Amusement Parks

8.6.1 Theme Parks & Amusement Parks Market Trends Analysis (2020-2032)

8.6.2 Theme Parks & Amusement Parks Market Size Estimates and Forecasts to 2032 (USD Billion)

8.7 Others

8.7.1 Others Market Trends Analysis (2020-2032)

8.7.2 Others Market Size Estimates and Forecasts to 2032 (USD Billion)

9. Immersive Display in Entertainment Market Segmentation, By Resolution

9.1 Chapter Overview

9.2 4K

9.2.1 4K Market Trends Analysis (2020-2032)

9.2.2 4K Market Size Estimates and Forecasts to 2032 (USD Billion)

9.3 8K

9.3.1 8K Market Trends Analysis (2020-2032)

9.3.2 8K Market Size Estimates and Forecasts to 2032 (USD Billion)

9.4 Hybrid

9.4.1 Hybrid Market Trends Analysis (2020-2032)

9.4.2 Hybrid Market Size Estimates and Forecasts to 2032 (USD Billion)

10. Regional Analysis

10.1 Chapter Overview

10.2 North America

10.2.1 Trends Analysis

10.2.2 North America Immersive Display in Entertainment Market Estimates and Forecasts, by Country (2020-2032) (USD Billion)

10.2.3 North America Immersive Display in Entertainment Market Estimates and Forecasts, By Technology (2020-2032) (USD Billion) 

10.2.4 North America Immersive Display in Entertainment Market Estimates and Forecasts, By Application (2020-2032) (USD Billion)

10.2.5 North America Immersive Display in Entertainment Market Estimates and Forecasts, By Resolution (2020-2032) (USD Billion)

10.2.6 USA

10.2.6.1 USA Immersive Display in Entertainment Market Estimates and Forecasts, By Technology (2020-2032) (USD Billion)

10.2.6.2 USA Immersive Display in Entertainment Market Estimates and Forecasts, By Application (2020-2032) (USD Billion)

10.2.6.3 USA Immersive Display in Entertainment Market Estimates and Forecasts, By Resolution (2020-2032) (USD Billion)

10.2.7 Canada

10.2.7.1 Canada Immersive Display in Entertainment Market Estimates and Forecasts, By Technology (2020-2032) (USD Billion)

10.2.7.2 Canada Immersive Display in Entertainment Market Estimates and Forecasts, By Application (2020-2032) (USD Billion)

10.2.7.3 Canada Immersive Display in Entertainment Market Estimates and Forecasts, By Resolution (2020-2032) (USD Billion)

10.2.8 Mexico

10.2.8.1 Mexico Immersive Display in Entertainment Market Estimates and Forecasts, By Technology (2020-2032) (USD Billion)

10.2.8.2 Mexico Immersive Display in Entertainment Market Estimates and Forecasts, By Application (2020-2032) (USD Billion)

10.2.8.3 Mexico Immersive Display in Entertainment Market Estimates and Forecasts, By Resolution (2020-2032) (USD Billion)

10.3 Europe

10.3.1 Eastern Europe

10.3.1.1 Trends Analysis

10.3.1.2 Eastern Europe Immersive Display in Entertainment Market Estimates and Forecasts, by Country (2020-2032) (USD Billion)

10.3.1.3 Eastern Europe Immersive Display in Entertainment Market Estimates and Forecasts, By Technology (2020-2032) (USD Billion) 

10.3.1.4 Eastern Europe Immersive Display in Entertainment Market Estimates and Forecasts, By Application (2020-2032) (USD Billion)

10.3.1.5 Eastern Europe Immersive Display in Entertainment Market Estimates and Forecasts, By Resolution (2020-2032) (USD Billion)

10.3.1.6 Poland

10.3.1.6.1 Poland Immersive Display in Entertainment Market Estimates and Forecasts, By Technology (2020-2032) (USD Billion)

10.3.1.6.2 Poland Immersive Display in Entertainment Market Estimates and Forecasts, By Application (2020-2032) (USD Billion)

10.3.1.6.3 Poland Immersive Display in Entertainment Market Estimates and Forecasts, By Resolution (2020-2032) (USD Billion)

10.3.1.7 Romania

10.3.1.7.1 Romania Immersive Display in Entertainment Market Estimates and Forecasts, By Technology (2020-2032) (USD Billion)

10.3.1.7.2 Romania Immersive Display in Entertainment Market Estimates and Forecasts, By Application (2020-2032) (USD Billion)

10.3.1.7.3 Romania Immersive Display in Entertainment Market Estimates and Forecasts, By Resolution (2020-2032) (USD Billion)

10.3.1.8 Hungary

10.3.1.8.1 Hungary Immersive Display in Entertainment Market Estimates and Forecasts, By Technology (2020-2032) (USD Billion)

10.3.1.8.2 Hungary Immersive Display in Entertainment Market Estimates and Forecasts, By Application (2020-2032) (USD Billion)

10.3.1.8.3 Hungary Immersive Display in Entertainment Market Estimates and Forecasts, By Resolution (2020-2032) (USD Billion)

10.3.1.9 Turkey

10.3.1.9.1 Turkey Immersive Display in Entertainment Market Estimates and Forecasts, By Technology (2020-2032) (USD Billion)

10.3.1.9.2 Turkey Immersive Display in Entertainment Market Estimates and Forecasts, By Application (2020-2032) (USD Billion)

10.3.1.9.3 Turkey Immersive Display in Entertainment Market Estimates and Forecasts, By Resolution (2020-2032) (USD Billion)

10.3.1.10 Rest of Eastern Europe

10.3.1.10.1 Rest of Eastern Europe Immersive Display in Entertainment Market Estimates and Forecasts, By Technology (2020-2032) (USD Billion)

10.3.1.10.2 Rest of Eastern Europe Immersive Display in Entertainment Market Estimates and Forecasts, By Application (2020-2032) (USD Billion)

10.3.1.10.3 Rest of Eastern Europe Immersive Display in Entertainment Market Estimates and Forecasts, By Resolution (2020-2032) (USD Billion)

10.3.2 Western Europe

10.3.2.1 Trends Analysis

10.3.2.2 Western Europe Immersive Display in Entertainment Market Estimates and Forecasts, by Country (2020-2032) (USD Billion)

10.3.2.3 Western Europe Immersive Display in Entertainment Market Estimates and Forecasts, By Technology (2020-2032) (USD Billion) 

10.3.2.4 Western Europe Immersive Display in Entertainment Market Estimates and Forecasts, By Application (2020-2032) (USD Billion)

10.3.2.5 Western Europe Immersive Display in Entertainment Market Estimates and Forecasts, By Resolution (2020-2032) (USD Billion)

10.3.2.6 Germany

10.3.2.6.1 Germany Immersive Display in Entertainment Market Estimates and Forecasts, By Technology (2020-2032) (USD Billion)

10.3.2.6.2 Germany Immersive Display in Entertainment Market Estimates and Forecasts, By Application (2020-2032) (USD Billion)

10.3.2.6.3 Germany Immersive Display in Entertainment Market Estimates and Forecasts, By Resolution (2020-2032) (USD Billion)

10.3.2.7 France

10.3.2.7.1 France Immersive Display in Entertainment Market Estimates and Forecasts, By Technology (2020-2032) (USD Billion)

10.3.2.7.2 France Immersive Display in Entertainment Market Estimates and Forecasts, By Application (2020-2032) (USD Billion)

10.3.2.7.3 France Immersive Display in Entertainment Market Estimates and Forecasts, By Resolution (2020-2032) (USD Billion)

10.3.2.8 UK

10.3.2.8.1 UK Immersive Display in Entertainment Market Estimates and Forecasts, By Technology (2020-2032) (USD Billion)

10.3.2.8.2 UK Immersive Display in Entertainment Market Estimates and Forecasts, By Application (2020-2032) (USD Billion)

10.3.2.8.3 UK Immersive Display in Entertainment Market Estimates and Forecasts, By Resolution (2020-2032) (USD Billion)

10.3.2.9 Italy

10.3.2.9.1 Italy Immersive Display in Entertainment Market Estimates and Forecasts, By Technology (2020-2032) (USD Billion)

10.3.2.9.2 Italy Immersive Display in Entertainment Market Estimates and Forecasts, By Application (2020-2032) (USD Billion)

10.3.2.9.3 Italy Immersive Display in Entertainment Market Estimates and Forecasts, By Resolution (2020-2032) (USD Billion)

10.3.2.10 Spain

10.3.2.10.1 Spain Immersive Display in Entertainment Market Estimates and Forecasts, By Technology (2020-2032) (USD Billion)

10.3.2.10.2 Spain Immersive Display in Entertainment Market Estimates and Forecasts, By Application (2020-2032) (USD Billion)

10.3.2.10.3 Spain Immersive Display in Entertainment Market Estimates and Forecasts, By Resolution (2020-2032) (USD Billion)

10.3.2.11 Netherlands

10.3.2.11.1 Netherlands Immersive Display in Entertainment Market Estimates and Forecasts, By Technology (2020-2032) (USD Billion)

10.3.2.11.2 Netherlands Immersive Display in Entertainment Market Estimates and Forecasts, By Application (2020-2032) (USD Billion)

10.3.2.11.3 Netherlands Immersive Display in Entertainment Market Estimates and Forecasts, By Resolution (2020-2032) (USD Billion)

10.3.2.12 Switzerland

10.3.2.12.1 Switzerland Immersive Display in Entertainment Market Estimates and Forecasts, By Technology (2020-2032) (USD Billion)

10.3.2.12.2 Switzerland Immersive Display in Entertainment Market Estimates and Forecasts, By Application (2020-2032) (USD Billion)

10.3.2.12.3 Switzerland Immersive Display in Entertainment Market Estimates and Forecasts, By Resolution (2020-2032) (USD Billion)

10.3.2.13 Austria

10.3.2.13.1 Austria Immersive Display in Entertainment Market Estimates and Forecasts, By Technology (2020-2032) (USD Billion)

10.3.2.13.2 Austria Immersive Display in Entertainment Market Estimates and Forecasts, By Application (2020-2032) (USD Billion)

10.3.2.13.3 Austria Immersive Display in Entertainment Market Estimates and Forecasts, By Resolution (2020-2032) (USD Billion)

10.3.2.14 Rest of Western Europe

10.3.2.14.1 Rest of Western Europe Immersive Display in Entertainment Market Estimates and Forecasts, By Technology (2020-2032) (USD Billion)

10.3.2.14.2 Rest of Western Europe Immersive Display in Entertainment Market Estimates and Forecasts, By Application (2020-2032) (USD Billion)

10.3.2.14.3 Rest of Western Europe Immersive Display in Entertainment Market Estimates and Forecasts, By Resolution (2020-2032) (USD Billion)

10.4 Asia Pacific

10.4.1 Trends Analysis

10.4.2 Asia Pacific Immersive Display in Entertainment Market Estimates and Forecasts, by Country (2020-2032) (USD Billion)

10.4.3 Asia Pacific Immersive Display in Entertainment Market Estimates and Forecasts, By Technology (2020-2032) (USD Billion) 

10.4.4 Asia Pacific Immersive Display in Entertainment Market Estimates and Forecasts, By Application (2020-2032) (USD Billion)

10.4.5 Asia Pacific Immersive Display in Entertainment Market Estimates and Forecasts, By Resolution (2020-2032) (USD Billion)

10.4.6 China

10.4.6.1 China Immersive Display in Entertainment Market Estimates and Forecasts, By Technology (2020-2032) (USD Billion)

10.4.6.2 China Immersive Display in Entertainment Market Estimates and Forecasts, By Application (2020-2032) (USD Billion)

10.4.6.3 China Immersive Display in Entertainment Market Estimates and Forecasts, By Resolution (2020-2032) (USD Billion)

10.4.7 India

10.4.7.1 India Immersive Display in Entertainment Market Estimates and Forecasts, By Technology (2020-2032) (USD Billion)

10.4.7.2 India Immersive Display in Entertainment Market Estimates and Forecasts, By Application (2020-2032) (USD Billion)

10.4.7.3 India Immersive Display in Entertainment Market Estimates and Forecasts, By Resolution (2020-2032) (USD Billion)

10.4.8 Japan

10.4.8.1 Japan Immersive Display in Entertainment Market Estimates and Forecasts, By Technology (2020-2032) (USD Billion)

10.4.8.2 Japan Immersive Display in Entertainment Market Estimates and Forecasts, By Application (2020-2032) (USD Billion)

10.4.8.3 Japan Immersive Display in Entertainment Market Estimates and Forecasts, By Resolution (2020-2032) (USD Billion)

10.4.9 South Korea

10.4.9.1 South Korea Immersive Display in Entertainment Market Estimates and Forecasts, By Technology (2020-2032) (USD Billion)

10.4.9.2 South Korea Immersive Display in Entertainment Market Estimates and Forecasts, By Application (2020-2032) (USD Billion)

10.4.9.3 South Korea Immersive Display in Entertainment Market Estimates and Forecasts, By Resolution (2020-2032) (USD Billion)

10.4.10 Vietnam

10.4.10.1 Vietnam Immersive Display in Entertainment Market Estimates and Forecasts, By Technology (2020-2032) (USD Billion)

10.4.10.2 Vietnam Immersive Display in Entertainment Market Estimates and Forecasts, By Application (2020-2032) (USD Billion)

10.4.10.3 Vietnam Immersive Display in Entertainment Market Estimates and Forecasts, By Resolution (2020-2032) (USD Billion)

10.4.11 Singapore

10.4.11.1 Singapore Immersive Display in Entertainment Market Estimates and Forecasts, By Technology (2020-2032) (USD Billion)

10.4.11.2 Singapore Immersive Display in Entertainment Market Estimates and Forecasts, By Application (2020-2032) (USD Billion)

10.4.11.3 Singapore Immersive Display in Entertainment Market Estimates and Forecasts, By Resolution (2020-2032) (USD Billion)

10.4.12 Australia

10.4.12.1 Australia Immersive Display in Entertainment Market Estimates and Forecasts, By Technology (2020-2032) (USD Billion)

10.4.12.2 Australia Immersive Display in Entertainment Market Estimates and Forecasts, By Application (2020-2032) (USD Billion)

10.4.12.3 Australia Immersive Display in Entertainment Market Estimates and Forecasts, By Resolution (2020-2032) (USD Billion)

10.4.13 Rest of Asia Pacific

10.4.13.1 Rest of Asia Pacific Immersive Display in Entertainment Market Estimates and Forecasts, By Technology (2020-2032) (USD Billion)

10.4.13.2 Rest of Asia Pacific Immersive Display in Entertainment Market Estimates and Forecasts, By Application (2020-2032) (USD Billion)

10.4.13.3 Rest of Asia Pacific Immersive Display in Entertainment Market Estimates and Forecasts, By Resolution (2020-2032) (USD Billion)

10.5 Middle East and Africa

10.5.1 Middle East

10.5.1.1 Trends Analysis

10.5.1.2 Middle East Immersive Display in Entertainment Market Estimates and Forecasts, by Country (2020-2032) (USD Billion)

10.5.1.3 Middle East Immersive Display in Entertainment Market Estimates and Forecasts, By Technology (2020-2032) (USD Billion) 

10.5.1.4 Middle East Immersive Display in Entertainment Market Estimates and Forecasts, By Application (2020-2032) (USD Billion)

10.5.1.5 Middle East Immersive Display in Entertainment Market Estimates and Forecasts, By Resolution (2020-2032) (USD Billion)

10.5.1.6 UAE

10.5.1.6.1 UAE Immersive Display in Entertainment Market Estimates and Forecasts, By Technology (2020-2032) (USD Billion)

10.5.1.6.2 UAE Immersive Display in Entertainment Market Estimates and Forecasts, By Application (2020-2032) (USD Billion)

10.5.1.6.3 UAE Immersive Display in Entertainment Market Estimates and Forecasts, By Resolution (2020-2032) (USD Billion)

10.5.1.7 Egypt

10.5.1.7.1 Egypt Immersive Display in Entertainment Market Estimates and Forecasts, By Technology (2020-2032) (USD Billion)

10.5.1.7.2 Egypt Immersive Display in Entertainment Market Estimates and Forecasts, By Application (2020-2032) (USD Billion)

10.5.1.7.3 Egypt Immersive Display in Entertainment Market Estimates and Forecasts, By Resolution (2020-2032) (USD Billion)

10.5.1.8 Saudi Arabia

10.5.1.8.1 Saudi Arabia Immersive Display in Entertainment Market Estimates and Forecasts, By Technology (2020-2032) (USD Billion)

10.5.1.8.2 Saudi Arabia Immersive Display in Entertainment Market Estimates and Forecasts, By Application (2020-2032) (USD Billion)

10.5.1.8.3 Saudi Arabia Immersive Display in Entertainment Market Estimates and Forecasts, By Resolution (2020-2032) (USD Billion)

10.5.1.9 Qatar

10.5.1.9.1 Qatar Immersive Display in Entertainment Market Estimates and Forecasts, By Technology (2020-2032) (USD Billion)

10.5.1.9.2 Qatar Immersive Display in Entertainment Market Estimates and Forecasts, By Application (2020-2032) (USD Billion)

10.5.1.9.3 Qatar Immersive Display in Entertainment Market Estimates and Forecasts, By Resolution (2020-2032) (USD Billion)

10.5.1.10 Rest of Middle East

10.5.1.10.1 Rest of Middle East Immersive Display in Entertainment Market Estimates and Forecasts, By Technology (2020-2032) (USD Billion)

10.5.1.10.2 Rest of Middle East Immersive Display in Entertainment Market Estimates and Forecasts, By Application (2020-2032) (USD Billion)

10.5.1.10.3 Rest of Middle East Immersive Display in Entertainment Market Estimates and Forecasts, By Resolution (2020-2032) (USD Billion)

10.5.2 Africa

10.5.2.1 Trends Analysis

10.5.2.2 Africa Immersive Display in Entertainment Market Estimates and Forecasts, by Country (2020-2032) (USD Billion)

10.5.2.3 Africa Immersive Display in Entertainment Market Estimates and Forecasts, By Technology (2020-2032) (USD Billion) 

10.5.2.4 Africa Immersive Display in Entertainment Market Estimates and Forecasts, By Application (2020-2032) (USD Billion)

10.5.2.5 Africa Immersive Display in Entertainment Market Estimates and Forecasts, By Resolution (2020-2032) (USD Billion)

10.5.2.6 South Africa

10.5.2.6.1 South Africa Immersive Display in Entertainment Market Estimates and Forecasts, By Technology (2020-2032) (USD Billion)

10.5.2.6.2 South Africa Immersive Display in Entertainment Market Estimates and Forecasts, By Application (2020-2032) (USD Billion)

10.5.2.6.3 South Africa Immersive Display in Entertainment Market Estimates and Forecasts, By Resolution (2020-2032) (USD Billion)

10.5.2.7 Nigeria

10.5.2.7.1 Nigeria Immersive Display in Entertainment Market Estimates and Forecasts, By Technology (2020-2032) (USD Billion)

10.5.2.7.2 Nigeria Immersive Display in Entertainment Market Estimates and Forecasts, By Application (2020-2032) (USD Billion)

10.5.2.7.3 Nigeria Immersive Display in Entertainment Market Estimates and Forecasts, By Resolution (2020-2032) (USD Billion)

10.5.2.8 Rest of Africa

10.5.2.8.1 Rest of Africa Immersive Display in Entertainment Market Estimates and Forecasts, By Technology (2020-2032) (USD Billion)

10.5.2.8.2 Rest of Africa Immersive Display in Entertainment Market Estimates and Forecasts, By Application (2020-2032) (USD Billion)

10.5.2.8.3 Rest of Africa Immersive Display in Entertainment Market Estimates and Forecasts, By Resolution (2020-2032) (USD Billion)

10.6 Latin America

10.6.1 Trends Analysis

10.6.2 Latin America Immersive Display in Entertainment Market Estimates and Forecasts, by Country (2020-2032) (USD Billion)

10.6.3 Latin America Immersive Display in Entertainment Market Estimates and Forecasts, By Technology (2020-2032) (USD Billion) 

10.6.4 Latin America Immersive Display in Entertainment Market Estimates and Forecasts, By Application (2020-2032) (USD Billion)

10.6.5 Latin America Immersive Display in Entertainment Market Estimates and Forecasts, By Resolution (2020-2032) (USD Billion)

10.6.6 Brazil

10.6.6.1 Brazil Immersive Display in Entertainment Market Estimates and Forecasts, By Technology (2020-2032) (USD Billion)

10.6.6.2 Brazil Immersive Display in Entertainment Market Estimates and Forecasts, By Application (2020-2032) (USD Billion)

10.6.6.3 Brazil Immersive Display in Entertainment Market Estimates and Forecasts, By Resolution (2020-2032) (USD Billion)

10.6.7 Argentina

10.6.7.1 Argentina Immersive Display in Entertainment Market Estimates and Forecasts, By Technology (2020-2032) (USD Billion)

10.6.7.2 Argentina Immersive Display in Entertainment Market Estimates and Forecasts, By Application (2020-2032) (USD Billion)

10.6.7.3 Argentina Immersive Display in Entertainment Market Estimates and Forecasts, By Resolution (2020-2032) (USD Billion)

10.6.8 Colombia

10.6.8.1 Colombia Immersive Display in Entertainment Market Estimates and Forecasts, By Technology (2020-2032) (USD Billion)

10.6.8.2 Colombia Immersive Display in Entertainment Market Estimates and Forecasts, By Application (2020-2032) (USD Billion)

10.6.8.3 Colombia Immersive Display in Entertainment Market Estimates and Forecasts, By Resolution (2020-2032) (USD Billion)

10.6.9 Rest of Latin America

10.6.9.1 Rest of Latin America Immersive Display in Entertainment Market Estimates and Forecasts, By Technology (2020-2032) (USD Billion)

10.6.9.2 Rest of Latin America Immersive Display in Entertainment Market Estimates and Forecasts, By Application (2020-2032) (USD Billion)

10.6.9.3 Rest of Latin America Immersive Display in Entertainment Market Estimates and Forecasts, By Resolution (2020-2032) (USD Billion)

11. Company Profiles

11.1 Barco N.V.

11.1.1 Company Overview

11.1.2 Financial

11.1.3 Products/ Services Offered

11.1.4 SWOT Analysis

11.2 Christie Digital Systems USA, Inc.

11.2.1 Company Overview

11.2.2 Financial

11.2.3 Products/ Services Offered

11.2.4 SWOT Analysis

11.3 Disguise Technologies Limited

11.3.1 Company Overview

11.3.2 Financial

11.3.3 Products/ Services Offered

11.3.4 SWOT Analysis

11.4 Leyard

11.4.1 Company Overview

11.4.2 Financial

11.4.3 Products/ Services Offered

11.4.4 SWOT Analysis

11.5 LG Electronics

11.5.1 Company Overview

11.5.2 Financial

11.5.3 Products/ Services Offered

11.5.4 SWOT Analysis

11.6 Panasonic Holdings Corporation

11.6.1 Company Overview

11.6.2 Financial

11.6.3 Products/ Services Offered

11.6.4 SWOT Analysis

11.7 Prysm Systems, Inc.

11.7.1 Company Overview

11.7.2 Financial

11.7.3 Products/ Services Offered

11.7.4 SWOT Analysis

11.8 ROE Visual

11.8.1 Company Overview

11.8.2 Financial

11.8.3 Products/ Services Offered

11.8.4 SWOT Analysis

11.9 Samsung Electronics Co., Ltd.

11.9.1 Company Overview

11.9.2 Financial

11.9.3 Products/ Services Offered

11.9.4 SWOT Analysis

11.10 Sharp Corporation

11.10.1 Company Overview

11.10.2 Financial

11.10.3 Products/ Services Offered

11.10.4 SWOT Analysis

12. Use Cases and Best Practices

13. Conclusion

An accurate research report requires proper strategizing as well as implementation. There are multiple factors involved in the completion of good and accurate research report and selecting the best methodology to compete the research is the toughest part. Since the research reports we provide play a crucial role in any company’s decision-making process, therefore we at SNS Insider always believe that we should choose the best method which gives us results closer to reality. This allows us to reach at a stage wherein we can provide our clients best and accurate investment to output ratio.

Each report that we prepare takes a timeframe of 350-400 business hours for production. Starting from the selection of titles through a couple of in-depth brain storming session to the final QC process before uploading our titles on our website we dedicate around 350 working hours. The titles are selected based on their current market cap and the foreseen CAGR and growth.


The 5 steps process:

Step 1: Secondary Research:

Secondary Research or Desk Research is as the name suggests is a research process wherein, we collect data through the readily available information. In this process we use various paid and unpaid databases which our team has access to and gather data through the same. This includes examining of listed companies’ annual reports, Journals, SEC filling etc. Apart from this our team has access to various associations across the globe across different industries. Lastly, we have exchange relationships with various university as well as individual libraries.

Secondary Research

Step 2: Primary Research

When we talk about primary research, it is a type of study in which the researchers collect relevant data samples directly, rather than relying on previously collected data.  This type of research is focused on gaining content specific facts that can be sued to solve specific problems. Since the collected data is fresh and first hand therefore it makes the study more accurate and genuine.

We at SNS Insider have divided Primary Research into 2 parts.

Part 1 wherein we interview the KOLs of major players as well as the upcoming ones across various geographic regions. This allows us to have their view over the market scenario and acts as an important tool to come closer to the accurate market numbers. As many as 45 paid and unpaid primary interviews are taken from both the demand and supply side of the industry to make sure we land at an accurate judgement and analysis of the market.

This step involves the triangulation of data wherein our team analyses the interview transcripts, online survey responses and observation of on filed participants. The below mentioned chart should give a better understanding of the part 1 of the primary interview.

Primary Research

Part 2: In this part of primary research the data collected via secondary research and the part 1 of the primary research is validated with the interviews from individual consultants and subject matter experts.

Consultants are those set of people who have at least 12 years of experience and expertise within the industry whereas Subject Matter Experts are those with at least 15 years of experience behind their back within the same space. The data with the help of two main processes i.e., FGDs (Focused Group Discussions) and IDs (Individual Discussions). This gives us a 3rd party nonbiased primary view of the market scenario making it a more dependable one while collation of the data pointers.

Step 3: Data Bank Validation

Once all the information is collected via primary and secondary sources, we run that information for data validation. At our intelligence centre our research heads track a lot of information related to the market which includes the quarterly reports, the daily stock prices, and other relevant information. Our data bank server gets updated every fortnight and that is how the information which we collected using our primary and secondary information is revalidated in real time.

Data Bank Validation

Step 4: QA/QC Process

After all the data collection and validation our team does a final level of quality check and quality assurance to get rid of any unwanted or undesired mistakes. This might include but not limited to getting rid of the any typos, duplication of numbers or missing of any important information. The people involved in this process include technical content writers, research heads and graphics people. Once this process is completed the title gets uploader on our platform for our clients to read it.

Step 5: Final QC/QA Process:

This is the last process and comes when the client has ordered the study. In this process a final QA/QC is done before the study is emailed to the client. Since we believe in giving our clients a good experience of our research studies, therefore, to make sure that we do not lack at our end in any way humanly possible we do a final round of quality check and then dispatch the study to the client.

Key Segments:

By Technology

  • LED

  • OLED

  • Others

By Resolution

  • 4K

  • 8K

  • Hybrid

By Application

  • Theater & Cinema

  • Entertainment Venues

  • Museum & Exhibitions

  • Content Creation Studios

  • Theme Parks & Amusement Parks

  • Others

Request for Segment Customization as per your Business Requirement: Segment Customization Request

Regional Coverage:

North America

  • US

  • Canada

  • Mexico

Europe

  • Eastern Europe

    • Poland

    • Romania

    • Hungary

    • Turkey

    • Rest of Eastern Europe

  • Western Europe

    • Germany

    • France

    • UK

    • Italy

    • Spain

    • Netherlands

    • Switzerland

    • Austria

    • Rest of Western Europe

Asia Pacific

  • China

  • India

  • Japan

  • South Korea

  • Vietnam

  • Singapore

  • Australia

  • Rest of Asia Pacific

Middle East & Africa

  • Middle East

    • UAE

    • Egypt

    • Saudi Arabia

    • Qatar

    • Rest of Middle East

  • Africa

    • Nigeria

    • South Africa

    • Rest of Africa

Latin America

  • Brazil

  • Argentina

  • Colombia

  • Rest of Latin America

Request for Country Level Research Report: Country Level Customization Request

Available Customization

With the given market data, SNS Insider offers customization as per the company’s specific needs. The following customization options are available for the report:

  • Detailed Volume Analysis

  • Criss-Cross segment analysis (e.g. Product X Application)

  • Competitive Product Benchmarking

  • Geographic Analysis

  • Additional countries in any of the regions

  • Customized Data Representation

  • Detailed analysis and profiling of additional market players


  •            5000 (33% Discount)


  •            8950 (40% Discount)


  •            3050 (23% Discount)

Start a Conversation

Hi! Click one of our member below to chat on Phone