Hyperscale Computing Market Report Scope & Overview:
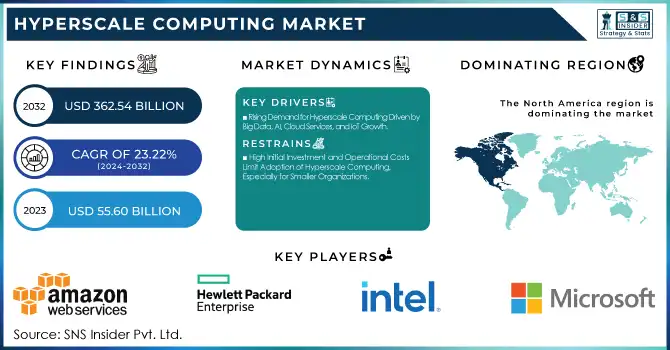
The Hyperscale Computing Market was valued at USD 55.60 billion in 2023 and is expected to reach USD 362.54 billion by 2032, growing at a CAGR of 23.22% from 2024-2032. This report includes insights into adoption rates, investment trends, automation and AI integration, infrastructure costs, and security incident trends. As businesses rapidly adopt hyperscale solutions to meet growing data demands, investments in data centers and technologies surge. Additionally, the integration of AI and automation optimizes operations, while security challenges continue to shape the market’s evolution. This comprehensive analysis provides key trends driving market growth and technological advancements.
To get more information on Hyperscale Computing Market - Request Free Sample Report
Hyperscale Computing Market Dynamics
Drivers
-
Rising Demand for Hyperscale Computing Driven by Big Data, AI, Cloud Services, and IoT Growth
As businesses increasingly leverage big data and artificial intelligence, the demand for high-performance computing infrastructure to process complex workloads continues to grow. Cloud services and edge computing also contribute to the demand as organizations require scalable, efficient solutions to store large amounts of data and process it in real-time. Hyperscale computing offers the perfect platform to contain and optimize such operations in a cost-effective and flexible manner. Also, the explosive growth of the Internet of Things and increased security and compliance requirements are propelling the spending on sophisticated, large-scale computing systems. These factors, in combination, build a compelling need for hyperscale solutions, and hence there is consistent market growth and technology evolution.
Restraints
-
High Initial Investment and Operational Costs Limit Adoption of Hyperscale Computing, Especially for Smaller Organizations
The large initial investment in constructing and sustaining hyperscale data centers is the biggest challenge, particularly for smaller organizations that do not have the financial means to do so. The large initial investments are necessary for the procurement of high-end hardware, scaling, and high-level security provisions. The difficulty of managing extensive infrastructure also requires specialized skill, adding further costs to operation. As businesses prioritize cost reduction, the cost of establishing and running hyperscale systems discourages smaller competitors from joining the market. In addition, the high energy consumption and environmental footprint of these data centers contribute to the total cost, raising long-term financial issues for organizations in pursuit of sustainable solutions. These aspects hinder the wider use of hyperscale computing.
Opportunities
-
Expansion of Cloud Services Creates Increased Demand for Scalable Hyperscale Computing Solutions to Support Growing Business Needs
The rapid shift to cloud platforms is significantly increasing the need for scalable and efficient hyperscale computing solutions. As businesses move their infrastructure to the cloud, they require more powerful and flexible data centers to support vast amounts of data and ensure high availability. This growing demand for cloud services directly drives the need for hyperscale data centers, which can handle large-scale operations, reduce operational costs, and improve performance. Additionally, the cloud offers businesses the flexibility to scale resources on demand, further reinforcing the adoption of hyperscale solutions. With cloud adoption continuing to rise globally, hyperscale computing becomes
Challenges
-
Managing Large Volumes of Sensitive Data Creates Security Risks and Requires Advanced Protection in Hyperscale Computing Systems
As hyperscale computing systems manage increasingly large volumes of sensitive data, the risk of security breaches becomes a critical concern. The scale and complexity of these systems make them attractive targets for cyberattacks, requiring robust and continuous monitoring to prevent unauthorized access. Additionally, the diverse nature of data across different industries creates unique vulnerabilities that demand tailored protection measures. Companies operating hyperscale data centers must implement advanced security protocols, encryption techniques, and regular updates to safeguard against evolving threats. Furthermore, the pressure to maintain data privacy and comply with stringent regulations adds another layer of complexity. The constant need to address these security risks represents a major challenge for the hyperscale computing market as it grows.
Hyperscale Computing Market Segment Analysis
By Component
The Solution segment led the Hyperscale Computing Market with a 76% revenue share in 2023 because of the growing use of end-to-end infrastructure solutions that provide scalability, high performance, and efficiency. With organizations still moving to the cloud, they depend on end-to-end solutions, including storage, processing, and networking, to maximize data center operations, thereby propelling the higher revenue share in this segment.
The Service segment is expected to grow at the fastest CAGR of 24.98% during the period 2024-2032, triggered by increasing requirements for maintenance, support, and advisory services on hyperscale systems. With adoption and scaling up of hyperscale computing by businesses, the requirement for professional services for handling high-end systems, ensuring performance tuning, and safeguarding security intensifies at an enormous pace. Also, cloud-native solutions and managed services are contributing to accelerating growth in the segment.
By Enterprise Size
The Large Enterprises segment dominated the Hyperscale Computing Market with a 71% revenue share in 2023 due to their vast IT infrastructure needs, which require scalable, efficient computing solutions. These enterprises are adopting hyperscale computing to handle massive amounts of data, ensure high availability, and enhance performance across multiple locations. The need for robust and integrated systems to support business operations and digital transformation has led to their market dominance.
The Small and Medium Enterprises segment is expected to grow at the fastest CAGR of 24.86% from 2024-2032 due to increasing digitalization and cloud adoption among smaller businesses. As SMEs look for cost-effective, scalable solutions to manage data and enhance business operations, hyperscale computing services offer flexibility, reduced costs, and improved performance, driving rapid growth in this segment.
By End-Use
The IT & Telecom segment dominated the Hyperscale Computing Market with a 30% revenue share in 2023 due to the increasing demand for data processing, storage, and network infrastructure in this sector. Telecom companies are leveraging hyperscale computing to support growing data traffic, enhance network services, and enable 5G capabilities. The scalability, flexibility, and efficiency offered by hyperscale systems make them ideal for the complex needs of the IT and telecom industry.
The Media & Entertainment segment is expected to grow at the fastest CAGR of 26.53% from 2024-2032 due to the rising demand for high-quality content streaming, video on demand, and real-time media processing. As content production and distribution become more data-intensive, hyperscale computing enables faster processing, storage, and seamless delivery of digital media, driving the rapid growth in this sector.
By Application
The Cloud Computing segment dominated the Hyperscale Computing Market with a 44% revenue share in 2023 due to the widespread adoption of cloud platforms by businesses across industries. Hyperscale computing enables cloud service providers to offer scalable, cost-effective, and high-performance solutions for data storage, processing, and management. The growing reliance on cloud-based applications and services, along with the need for efficient resource management, drives the dominance of this segment.
The Big Data segment is expected to grow at the fastest CAGR of 24.91% from 2024-2032 as organizations continue to embrace data-driven decision-making. Hyperscale computing is essential for processing vast volumes of data at high speed, providing organizations with the ability to analyze, store, and manage big data efficiently. The increasing need for real-time insights and predictive analytics fuels rapid growth in this segment.
Regional Analysis
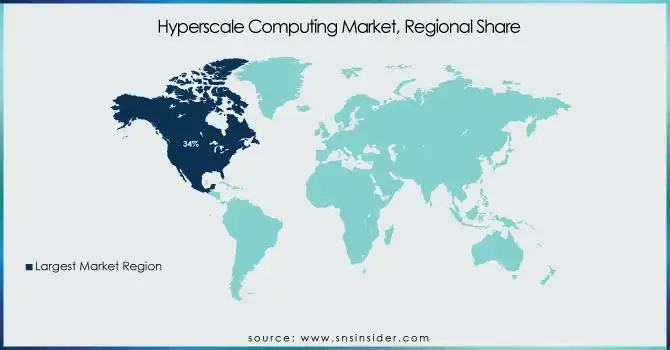
North America dominated the Hyperscale Computing Market with a 34% revenue share in 2023 due to the region's advanced technological infrastructure and early adoption of cloud computing and data center solutions. The presence of major hyperscale computing providers, along with a strong demand for scalable, high-performance systems across industries such as IT, telecom, and healthcare, contributes to the region’s dominance. Additionally, ongoing digital transformation initiatives and the increasing need for data processing power drive significant market share in North America.
Asia Pacific is expected to grow at the fastest CAGR of 25.93% from 2024-2032 due to rapid digitalization and the increasing adoption of cloud services across countries like China, India, and Japan. The region’s growing reliance on big data, IoT, and AI applications fuels the demand for hyperscale computing. Furthermore, the expansion of data centers, telecom infrastructure, and the shift to 5G networks contribute to the region’s strong growth potential in this market.
Get Customized Report as per Your Business Requirement - Enquiry Now
Key Players
-
Amazon Web Services, Inc. (Amazon EC2, Amazon S3)
-
Hewlett Packard Enterprise Development LP (HPE GreenLake, HPE Synergy)
-
Intel Corporation (Intel Xeon Scalable processors, Intel Optane DC Persistent Memory)
-
Microsoft (Azure Virtual Machines, Azure Blob Storage)
-
Google Cloud (Google Compute Engine, Google Cloud Storage)
-
Oracle (Oracle Cloud Infrastructure, Oracle Autonomous Database)
-
Dell Inc. (Dell PowerEdge Servers, Dell VxRail)
-
Alibaba Cloud (Elastic Compute Service, Alibaba Cloud Object Storage Service)
-
Server Technology, Inc. (Rack Power Distribution Units, Switched PDUs)
-
VIAVI Solutions Inc. (T-BERD/MTS, SmartOTU)
-
NVIDIA (NVIDIA A100 Tensor Core GPU, NVIDIA DGX Systems)
-
Cisco Systems (Cisco Nexus 9000 Series Switches, Cisco UCS Servers)
-
ARM Holdings (ARM Cortex-A processors, ARM Neoverse Platform)
-
Huawei Technologies (FusionSphere Cloud OS, Huawei Atlas AI Platform)
-
Tencent Cloud (Tencent Cloud CVM, Tencent Cloud Object Storage)
-
Supermicro (SuperServer Systems, Supermicro GPU Servers)
-
Lenovo (Lenovo ThinkSystem Servers, Lenovo Cloud Services)
-
AMD (AMD EPYC processors, AMD Radeon Instinct accelerators)
-
Broadcom (Broadcom StrataXGS Ethernet Switches, Broadcom Thunderbolt Controllers)
-
Micron Technology (Micron DRAM, Micron SSDs)
Recent Developments:
-
In December 2024, AWS introduced new data center components designed to enhance AI innovation and energy efficiency. These upgrades include liquid cooling, improved rack designs, and advanced power systems, boosting compute power by 12% while reducing mechanical energy consumption by 46%. The changes support AI workloads and further AWS's sustainability goals.
-
In November 2024, Broadcom unveiled expanded VMware Cloud Foundation services at VMware Explore 2024 in Barcelona, focusing on accelerating AI applications, cybersecurity, and digital sovereignty. The platform supports private cloud innovation, offering enhanced infrastructure, data services, and improved AI-driven security capabilities, benefiting enterprises in modernizing their infrastructure with scalable, secure solutions.
| Report Attributes | Details |
|---|---|
| Market Size in 2023 | USD 55.60 Billion |
| Market Size by 2032 | USD 362.54 Billion |
| CAGR | CAGR of 23.22% From 2024 to 2032 |
| Base Year | 2023 |
| Forecast Period | 2024-2032 |
| Historical Data | 2020-2022 |
| Report Scope & Coverage | Market Size, Segments Analysis, Competitive Landscape, Regional Analysis, DROC & SWOT Analysis, Forecast Outlook |
| Key Segments | • By Component (Solution, Service) • By Enterprise Size (Large Enterprises, Small and Medium Enterprises) • By Application (Cloud Computing, Big Data, IoT, Others) • By End-Use (BFSI, IT & Telecom, Media & Entertainment, Retail & E-commerce, Healthcare, Others) |
| Regional Analysis/Coverage | North America (US, Canada, Mexico), Europe (Eastern Europe [Poland, Romania, Hungary, Turkey, Rest of Eastern Europe] Western Europe] Germany, France, UK, Italy, Spain, Netherlands, Switzerland, Austria, Rest of Western Europe]), Asia Pacific (China, India, Japan, South Korea, Vietnam, Singapore, Australia, Rest of Asia Pacific), Middle East & Africa (Middle East [UAE, Egypt, Saudi Arabia, Qatar, Rest of Middle East], Africa [Nigeria, South Africa, Rest of Africa], Latin America (Brazil, Argentina, Colombia, Rest of Latin America) |
| Company Profiles | Amazon Web Services, Inc., Hewlett Packard Enterprise Development LP, Intel Corporation, Microsoft, Google Cloud, Oracle, Dell Inc., Alibaba Cloud, Server Technology, Inc., VIAVI Solutions Inc., NVIDIA, Cisco Systems, ARM Holdings, Huawei Technologies, Tencent Cloud, Supermicro, Lenovo, AMD, Broadcom, Micron Technology |
