image

Hyper Car Market Report Scope & Overview
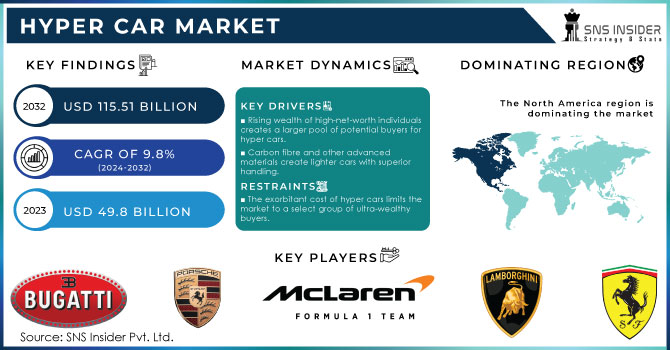
Hyper Car Market, Revenue Analysis

Get More Information on Hyper Car Market - Request Sample Report

The Hyper Car Market Size was valued at USD 49.8 billion in 2023 and is expected to reach USD 115.51 billion by 2032 and grow at a CAGR of 9.8% over the forecast period 2024-2032.

The increasing number of high-net-worth individuals (HNWIs) globally translates to a growing customer base with the financial resources to acquire these exclusive cars. Thus, the passion for collecting and owning a piece of automotive history is a strong driver. Hyper cars often push boundaries in design, speed, and performance, making them highly sought-after collectibles.

The advancements in technology are constantly propelling the market forward. Hybrid and electric hyper car concepts are emerging, offering both the thrill of extreme performance and a nod towards environmental responsibility. For instance, the Ferrari SF90 Stradale is a plug-in hybrid that delivers mind-bending acceleration while boasting significant fuel efficiency compared to traditional hyper cars. The lighter and stronger materials like carbon fibre are being increasingly utilized, resulting in lighter cars with superior handling.

Demand for hyper cars in the United States is supported by combined factors of technological innovation, superior consumer tastes for luxury and performance, and greater trends toward sustainability. Actually, one of the paramount factors driving demand is the general interest in electric and hybrid hyper cars. About 30% of the hyper cars sold in the United States in 2023 were electrified, either fully electric or hybrid models. This is a trend characterized by environmental consciousness among consumers as well as the need to own the latest technology that can balance performance with being environmentally friendly. To this end, near 40% of hyper car buyers in the U.S. perceive superior personalization as key, not only making these vehicles exclusive but also personalized.

Another very important influence is the rising disposable income of ultra-high-net-worth individuals. Ultra-high-net-worth individuals account for around 20% of hyper car buyers in the U.S., and this segment has been increasing steadily in recent years. Members of this segment view a hyper car primarily as a status symbol and investment rather than as a mode of transportation. In addition, the integration of advanced driver assistance systems in hyper cars is gradually influencing the tech-orientated customer. About 25% of the U.S. buyers claim to prefer vehicles with advanced safety and performance technologies, thereby increasing the demand for this niche market.

Hyper Car Market Dynamics:

KEY DRIVERS:

  • Rising wealth of high-net-worth individuals creates a larger pool of potential buyers for hyper cars.

  • Limited production numbers heighten desirability and create a sense of owning a unique automotive masterpiece.

  • Carbon fibre and other advanced materials create lighter cars with superior handling.

Compared to traditional materials like steel, carbon fibre boasts exceptional strength-to-weight ratio. This translates to significant weight reduction in hyper cars, leading to a multitude of benefits. The lighter cars require less power to achieve the same level of acceleration, improving fuel efficiency. The lighter weight allows for superior handling and agility, as the car can move more precisely and respond more quickly to driver inputs. This leads to more exhilarating and confidence-inspiring driving experience. by incorporating carbon fiber and other advanced materials, engineers can design hyper cars with improved aerodynamics. This enhances downforce, which is the force pushing the car downwards against the track, leading to increased grip and stability, particularly at high speeds. The adoption of lightweight materials is creating a hyper car that performs exceptionally well while offering a truly unique driving experience.

RESTRAINTS:

  • The exorbitant cost of hyper cars limits the market to a select group of ultra-wealthy buyers.

  • Manufacturers prioritize exclusivity by producing limited numbers, leading to long waitlists and frustrated potential buyers.

Manufacturers deliberately cap production numbers to create a sense of rarity and desirability. This strategy plays on the psychology of human collectors, who crave items that are not readily available. This approach undoubtedly fuels brand image and prestige and also creates a significant roadblock for potential buyers. This limited availability can leave potential customers feeling excluded and dampen their enthusiasm. The restricted production numbers can cause an impact on the overall market. With fewer hyper cars available, there's less opportunity for innovation and competition. This can stifle technological advancements and potentially hinder the long-term growth of the hyper car market.

OPPORTUNITIES:

  • Immersive experiences can allow potential buyers to virtually experience the thrill of a hyper car.

  • Offering extensive customization to cater to individual tastes and preferences.

CHALLENGES:

  • The advanced technology in hyper cars makes them expensive and complex to maintain.

Hyper Car Market Segment Overview:

By Propulsion:

Internal Combustion Engine (ICE) is the dominating sub-segment in the Hyper Car Market by propulsion holding around 70-75% of market share. Despite the rising popularity of electric vehicles, ICE vehicles still hold a dominant position in the hyper car market. This dominance is primarily driven by the established performance capabilities of ICE engines. Hyper car manufacturers can leverage extensive experience in fine-tuning these engines to deliver exceptional power, acceleration, and top speeds. Additionally, the emotional appeal of a roaring engine and the familiar driving experience associated with ICE vehicles continue to resonate with a significant portion of hyper car enthusiasts.
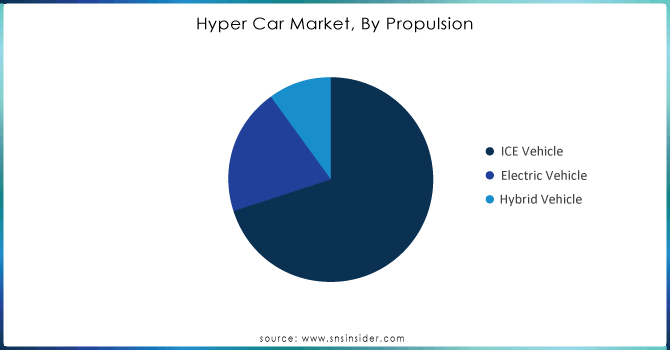
Hyper-Car-Market-By-Propulsion.

Get Customized Report as per your Business Requirement - Request For Customized Report

By Application

Racing Competition is the dominating sub-segment in the Hyper Car Market by application. Purpose-built hyper cars designed specifically for racing competitions are a dominant segment within the application category. These vehicles prioritize factors like downforce generation, aerodynamic efficiency, and lightweight construction to achieve peak performance on the racetrack. Manufacturers heavily invest in research and development to create these racing machines, pushing the boundaries of automotive technology and engineering. The prestige associated with winning prestigious races and the multi-million dollar sponsorships involved further solidify the dominance of racing-focused hyper cars.

By Car Type
Full-size (Above 2500cc) is the dominating sub-segment in the Hyper Car Market by car type holding around 80-90% of market share. When it comes to car type, full-size hyper cars reign supreme. These behemoths boast powerful engines with large displacements, typically exceeding 2500cc. This allows for unmatched power output, enabling them to achieve staggering acceleration figures and reach phenomenal top speeds. Additionally, the larger size provides ample space for incorporating advanced aerodynamic elements and sophisticated cooling systems, crucial for managing the immense heat generated by these powerful engines. While movability might be slightly compromised compared to smaller cars, the sheer dominance in terms of power and performance makes full-size hyper cars the preferred choice for many enthusiasts.

Hyper Car Market Regional Analysis

The North America is the dominating region in the hyper car market, capturing an estimated 40-45% of market share. This dominance stems from a deeply ingrained car culture with passionate collectors, a wealth concentration allowing for hefty price tags, and extensive infrastructure like road networks and racetracks to unleash these beasts.

Europe is the second highest region in this market. European manufacturers are known for their advanced engineering and technological advancements, reflected in their hyper car offerings. Thus, Europe's long history of prestigious racing events like Formula 1 fuels the demand for high-performance vehicles.

The Asia Pacific is the fastest growing region in this market. This surge is driven by the rising economy creating new hyper car buyers, the aspirational value associated with ownership, and even government support for high-performance vehicle development.
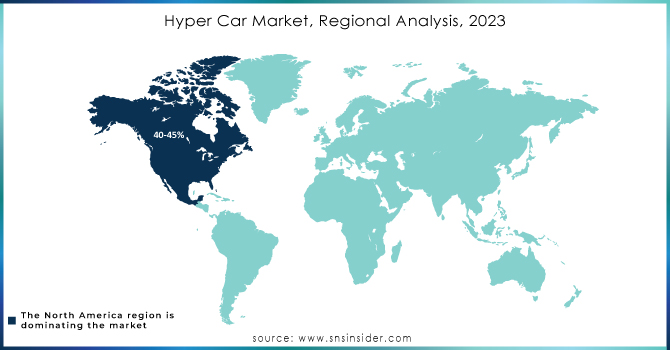
Hyper-Car-Market-Regional-Analysis-2023

KEY PLAYERS

The major hyper car market players are as follows:

  • Ferrari: (Ferrari LaFerrari, Ferrari SF90 Stradale)

  • Lamborghini:(Lamborghini Aventador SVJ, Lamborghini Sián FKP 37)

  • McLaren:(McLaren P1, McLaren Speedtail)

  • Lotus Cars: (Lotus Evija, Lotus 3-Eleven)

  • Bugatti:(Bugatti Chiron, Bugatti Divo)

  • Porsche: (Porsche 918 Spyder, Porsche 911 GT2 RS)

  • Koenigsegg Automotive AB: (Koenigsegg Jesko, Koenigsegg Regera)

  • Aston Martin: (Aston Martin Valkyrie. Aston Martin Vulcan)

  • Pagani: Pagani Huayra, Pagani Zonda HP Barchetta)

  • Pagani Huayra: (Pagani Zonda HP Barchetta, Mineko)

  • Mercedes (AMG): (Mercedes-AMG Project One, Mercedes-AMG GT Black Series)

  • Zenvo Automotive: (Zenvo TSR-S, Zenvo ST1)

  • Alfa Romeo: (Alfa Romeo 8C Competizione, Alfa Romeo TZ3 Stradale)

  • W Motors: (W Motors Lykan HyperSport, W Motors Fenyr SuperSport)

  • Jaguar Land Rover (JLR): (Jaguar C-X75, Range Rover)

  • Dendrobium: (Dendrobium D-1, )Xing Mobility)

  • Pininfarina: (Pininfarina Battista, Pininfarina H2 Speed)

  • Aspark: (Aspark Owl, Ariel)

  • Ariel Atom V8: (Ariel HIPERCAR (upcoming electric hypercar), Tesla)

  • Tesla Roadster (next-gen): (Tesla Model S Plaid)

  • Hispano Suiza: (Hispano Suiza Carmen, Hispano Suiza Carmen Boulogne)

RECENT DEVELOPMENT

  • In March 2023: Danish automaker Zenvo unveiled the Aurora, their latest hypercar. This V12 powerhouse boasts a modular design, featuring a lightweight carbon fiber monocoque core and complementary subframes for ultimate performance.

  • In June 2022: Mercedes unleashes the production-ready AMG One, a hypercar featuring a hybrid 1.6-liter V6 engine with F1 inspiration. This 1000-horsepower beast boasts four electric motors, bringing advanced racetrack tech to the road.

Hyper Car Market Report Scope:

Report Attributes Details
Market Size in 2023 US$ 49.8 Billion
Market Size by 2032 US$ 115.51 Billion
CAGR CAGR of 9.8% From 2024 to 2032
Base Year 2023
Forecast Period 2024-2032
Historical Data 2020-2022
Report Scope & Coverage Market Size, Segments Analysis, Competitive  Landscape, Regional Analysis, DROC & SWOT Analysis, Forecast Outlook
Key Segments • by Propulsion (Electric vehicles, ICE vehicles, Hybrid vehicles)
• by Car Type (Compact, Mid-Size, Full-Size)
Regional Analysis/Coverage North America (US, Canada, Mexico), Europe (Eastern Europe [Poland, Romania, Hungary, Turkey, Rest of Eastern Europe] Western Europe] Germany, France, UK, Italy, Spain, Netherlands, Switzerland, Austria, Rest of Western Europe]), Asia Pacific (China, India, Japan, South Korea, Vietnam, Singapore, Australia, Rest of Asia Pacific), Middle East & Africa (Middle East [UAE, Egypt, Saudi Arabia, Qatar, Rest of Middle East], Africa [Nigeria, South Africa, Rest of Africa], Latin America (Brazil, Argentina, Colombia, Rest of Latin America)
Company Profiles Ferrari, Lamborghini, McLaren, Lotus Cars, Bugatti, Porsche, Koenigsegg Automotive AB, Aston Martin, Pagani, Mineko, Mercedes, Zenvo Automotive, Alfa Romeo, W Motors, JLR, Dendrobium, Xing Mobility, Pininfarina, Aspark, Ariel, Tesla, Hispano Suiza
Key Drivers • An increase in sports car manufacturers' competition.
• The shift in taste from ordinary to luxurious sports automobiles is a result of advances in technology.
RESTRAINTS • Hyper-car sales are hampered by their high price.
• The cost of the final product rises due to the inclusion of more advanced technologies in the vehicle.

Frequently Asked Questions

The covid-19 is having negative impact on market the detailed study we provide in final report.

USD 49.8 billion is the market value in 2023.

The Europe region high share of the Hyper Car Market

•    Demand for the product will rise as a result of an increase in the production of efficient hyper-cars.
•    Governments throughout the world are increasing the severity of their automobile pollution restrictions.

The forecast period of the Hyper Car Market is 2024-2031.

Table of Contents:
1. Introduction         

1.1 Market Definition

1.2 Scope (Inclusion and Exclusions)

1.3 Research Assumptions

2. Executive Summary

2.1 Market Overview

2.2 Regional Synopsis

2.3 Competitive Summary

3. Research Methodology

3.1 Top-Down Approach

3.2 Bottom-up Approach

3.3. Data Validation

3.4 PTypeary Interviews

4. Market Dynamics Impact Analysis

4.1 Market Driving Factors Analysis

4.1.1 Drivers

4.1.2 Restraints

4.1.3 Opportunities

4.1.4 Challenges

4.2 PESTLE Analysis

4.3 Porter’s Five Forces Model

5. Statistical Insights and Trends Reporting

5.1 Vehicle Production and Sales Volumes, 2020-2032, by Region

5.2 Emission Standards Compliance, by Region

5.3 Vehicle Technology Adoption, by Region

5.4 Consumer Preferences, by Region

5.5 Aftermarket Trends (Data on vehicle maintenance, parts, and services)

6. Competitive Landscape

6.1 List of Major Companies, By Region

6.2 Market Share Analysis, By Region

6.3 Product Benchmarking

6.3.1 Product specifications and features

6.3.2 Pricing

6.4 Strategic Initiatives               

6.4.1 Marketing and promotional activities

6.4.2 Distribution and supply chain strategies

6.4.3 Expansion plans and new product launches

6.4.4 Strategic partnerships and collaborations

6.5 Technological Advancements

6.6 Market Positioning and Branding

7. Hyper Car Market Segmentation, by Propulsion

7.1 Chapter Overview

7.2 ICE Vehicle

7.2.1 ICE Vehicle Market Trends Analysis (2020-2032)

7.2.2 ICE Vehicle Market Size Estimates and Forecasts to 2032 (USD Billion)

7.2.3 Electric Vehicle  

7.2.3.1 Electric Vehicle Market Trends Analysis (2020-2032)

7.2.3.2 Electric Vehicle Market Size Estimates and Forecasts to 2032 (USD Billion)

7.2.4 Hybrid Vehicle

7.2.4.1 Hybrid Vehicle Market Trends Analysis (2020-2032)

7.2.4.2 Hybrid Vehicle Market Size Estimates and Forecasts to 2032 (USD Billion)

8. Hyper Car Market Segmentation, by Application

8.1 Chapter Overview

8.2 Racing Competition

8.2.1 Racing Competition Market Trends Analysis (2020-2032)

8.2.2 Racing Competition Market Size Estimates and Forecasts to 2032 (USD Billion)

8.3 Entertainment

8.3.1 Entertainment Market Trends Analysis (2020-2032)

8.3.2 Entertainment Market Size Estimates and Forecasts to 2032 (USD Billion)

8.4 Others

8.4.1 Others Market Trends Analysis (2020-2032)

            8.4.2 Others Market Size Estimates and Forecasts to 2032 (USD Billion)
 
9. Hyper Car Market Segmentation, by Car Type

9.1 Chapter Overview

9.2 Compact (Below 1500cc)

9.2.1 Compact (Below 1500cc) Market Trends Analysis (2020-2032)

9.2.2 Compact (Below 1500cc) Market Size Estimates and Forecasts to 2032 (USD Billion)

9.3 Mid-size (1500-2500cc)  

9.3.1 Mid-size (1500-2500cc) Market Trends Analysis (2020-2032)

9.3.2 Mid-size (1500-2500cc) Market Size Estimates and Forecasts to 2032 (USD Billion)

9.4 Full-size (Above 2500cc)

               9.4.1 Full-size (Above 2500cc) Market Trends Analysis (2020-2032)

             9.4.2 Full-size (Above 2500cc) Market Size Estimates and Forecasts to 2032 (USD Billion)

10. Regional Analysis

10.1 Chapter Overview

10.2 North America

10.2.1 Trends Analysis

10.2.2 North America Hyper Car Market Estimates and Forecasts, by Country (2020-2032) (USD Billion)

10.2.3 North America Hyper Car Market Estimates and Forecasts, by Propulsion (2020-2032) (USD Billion) 

10.2.4 North America Hyper Car Market Estimates and Forecasts, by Application (2020-2032) (USD Billion)

10.2.5 North America Hyper Car Market Estimates and Forecasts, by Car Type (2020-2032) (USD Billion)

10.2.6 USA

10.2.6.1 USA Hyper Car Market Estimates and Forecasts, by Propulsion (2020-2032) (USD Billion)

10.2.6.2 USA Hyper Car Market Estimates and Forecasts, by Application (2020-2032) (USD Billion)

10.2.6.3 USA Hyper Car Market Estimates and Forecasts, by Car Type (2020-2032) (USD Billion)

10.2.7 Canada

10.2.7.1 Canada Hyper Car Market Estimates and Forecasts, by Propulsion (2020-2032) (USD Billion)

10.2.7.2 Canada Hyper Car Market Estimates and Forecasts, by Application (2020-2032) (USD Billion)

10.2.7.3 Canada Hyper Car Market Estimates and Forecasts, by Car Type (2020-2032) (USD Billion)

10.2.8 Mexico

10.2.8.1 Mexico Hyper Car Market Estimates and Forecasts, by Propulsion (2020-2032) (USD Billion)

10.2.8.2 Mexico Hyper Car Market Estimates and Forecasts, by Application (2020-2032) (USD Billion)

10.2.8.3 Mexico Hyper Car Market Estimates and Forecasts, by Car Type (2020-2032) (USD Billion)

10.3 Europe

10.3.1 Eastern Europe

10.3.1.1 Trends Analysis

10.3.1.2 Eastern Europe Hyper Car Market Estimates and Forecasts, by Country (2020-2032) (USD Billion)

10.3.1.3 Eastern Europe Hyper Car Market Estimates and Forecasts, by Propulsion (2020-2032) (USD Billion) 

10.3.1.4 Eastern Europe Hyper Car Market Estimates and Forecasts, by Application (2020-2032) (USD Billion)

10.3.1.5 Eastern Europe Hyper Car Market Estimates and Forecasts, by Car Type (2020-2032) (USD Billion)

10.3.1.6 Poland

10.3.1.6.1 Poland Hyper Car Market Estimates and Forecasts, by Propulsion (2020-2032) (USD Billion)

10.3.1.6.2 Poland Hyper Car Market Estimates and Forecasts, by Application (2020-2032) (USD Billion)

10.3.1.6.3 Poland Hyper Car Market Estimates and Forecasts, by Car Type (2020-2032) (USD Billion)

10.3.1.7 Romania

10.3.1.7.1 Romania Hyper Car Market Estimates and Forecasts, by Propulsion (2020-2032) (USD Billion)

10.3.1.7.2 Romania Hyper Car Market Estimates and Forecasts, by Application (2020-2032) (USD Billion)

10.3.1.7.3 Romania Hyper Car Market Estimates and Forecasts, by Car Type (2020-2032) (USD Billion)

10.3.1.8 Hungary

10.3.1.8.1 Hungary Hyper Car Market Estimates and Forecasts, by Propulsion (2020-2032) (USD Billion)

10.3.1.8.2 Hungary Hyper Car Market Estimates and Forecasts, by Application (2020-2032) (USD Billion)

10.3.1.8.3 Hungary Hyper Car Market Estimates and Forecasts, by Car Type (2020-2032) (USD Billion)

10.3.1.9 Turkey

10.3.1.9.1 Turkey Hyper Car Market Estimates and Forecasts, by Propulsion (2020-2032) (USD Billion)

10.3.1.9.2 Turkey Hyper Car Market Estimates and Forecasts, by Application (2020-2032) (USD Billion)

10.3.1.9.3 Turkey Hyper Car Market Estimates and Forecasts, by Car Type (2020-2032) (USD Billion)

10.3.1.10 Rest of Eastern Europe

10.3.1.10.1 Rest of Eastern Europe Hyper Car Market Estimates and Forecasts, by Propulsion (2020-2032) (USD Billion)

10.3.1.10.2 Rest of Eastern Europe Hyper Car Market Estimates and Forecasts, by Application (2020-2032) (USD Billion)

10.3.1.10.3 Rest of Eastern Europe Hyper Car Market Estimates and Forecasts, by Car Type (2020-2032) (USD Billion)

10.3.2 Western Europe

10.3.2.1 Trends Analysis

10.3.2.2 Western Europe Hyper Car Market Estimates and Forecasts, by Country (2020-2032) (USD Billion)

10.3.2.3 Western Europe Hyper Car Market Estimates and Forecasts, by Propulsion (2020-2032) (USD Billion) 

10.3.2.4 Western Europe Hyper Car Market Estimates and Forecasts, by Application (2020-2032) (USD Billion)

10.3.2.5 Western Europe Hyper Car Market Estimates and Forecasts, by Car Type (2020-2032) (USD Billion)

10.3.2.6 Germany

10.3.2.6.1 Germany Hyper Car Market Estimates and Forecasts, by Propulsion (2020-2032) (USD Billion)

10.3.2.6.2 Germany Hyper Car Market Estimates and Forecasts, by Application (2020-2032) (USD Billion)

10.3.2.6.3 Germany Hyper Car Market Estimates and Forecasts, by Car Type (2020-2032) (USD Billion)

10.3.2.7 France

10.3.2.7.1 France Hyper Car Market Estimates and Forecasts, by Propulsion (2020-2032) (USD Billion)

10.3.2.7.2 France Hyper Car Market Estimates and Forecasts, by Application (2020-2032) (USD Billion)

10.3.2.7.3 France Hyper Car Market Estimates and Forecasts, by Car Type (2020-2032) (USD Billion)

10.3.2.8 UK

10.3.2.8.1 UK Hyper Car Market Estimates and Forecasts, by Propulsion (2020-2032) (USD Billion)

10.3.2.8.2 UK Hyper Car Market Estimates and Forecasts, by Application (2020-2032) (USD Billion)

10.3.2.8.3 UK Hyper Car Market Estimates and Forecasts, by Car Type (2020-2032) (USD Billion)

10.3.2.9 Italy

10.3.2.9.1 Italy Hyper Car Market Estimates and Forecasts, by Propulsion (2020-2032) (USD Billion)

10.3.2.9.2 Italy Hyper Car Market Estimates and Forecasts, by Application (2020-2032) (USD Billion)

10.3.2.9.3 Italy Hyper Car Market Estimates and Forecasts, by Car Type (2020-2032) (USD Billion)

10.3.2.10 Spain

10.3.2.10.1 Spain Hyper Car Market Estimates and Forecasts, by Propulsion (2020-2032) (USD Billion)

10.3.2.10.2 Spain Hyper Car Market Estimates and Forecasts, by Application (2020-2032) (USD Billion)

10.3.2.10.3 Spain Hyper Car Market Estimates and Forecasts, by Car Type (2020-2032) (USD Billion)

10.3.2.11 Netherlands

10.3.2.11.1 Netherlands Hyper Car Market Estimates and Forecasts, by Propulsion (2020-2032) (USD Billion)

10.3.2.11.2 Netherlands Hyper Car Market Estimates and Forecasts, by Application (2020-2032) (USD Billion)

10.3.2.11.3 Netherlands Hyper Car Market Estimates and Forecasts, by Car Type (2020-2032) (USD Billion)

10.3.2.12 Switzerland

10.3.2.12.1 Switzerland Hyper Car Market Estimates and Forecasts, by Propulsion (2020-2032) (USD Billion)

10.3.2.12.2 Switzerland Hyper Car Market Estimates and Forecasts, by Application (2020-2032) (USD Billion)

10.3.2.12.3 Switzerland Hyper Car Market Estimates and Forecasts, by Car Type (2020-2032) (USD Billion)

10.3.2.13 Austria

10.3.2.13.1 Austria Hyper Car Market Estimates and Forecasts, by Propulsion (2020-2032) (USD Billion)

10.3.2.13.2 Austria Hyper Car Market Estimates and Forecasts, by Application (2020-2032) (USD Billion)

10.3.2.13.3 Austria Hyper Car Market Estimates and Forecasts, by Car Type (2020-2032) (USD Billion)

10.3.2.14 Rest of Western Europe

10.3.2.14.1 Rest of Western Europe Hyper Car Market Estimates and Forecasts, by Propulsion (2020-2032) (USD Billion)

10.3.2.14.2 Rest of Western Europe Hyper Car Market Estimates and Forecasts, by Application (2020-2032) (USD Billion)

10.3.2.14.3 Rest of Western Europe Hyper Car Market Estimates and Forecasts, by Car Type (2020-2032) (USD Billion)

10.4 Asia Pacific

10.4.1 Trends Analysis

10.4.2 Asia Pacific Hyper Car Market Estimates and Forecasts, by Country (2020-2032) (USD Billion)

10.4.3 Asia Pacific Hyper Car Market Estimates and Forecasts, by Propulsion (2020-2032) (USD Billion) 

10.4.4 Asia Pacific Hyper Car Market Estimates and Forecasts, by Application (2020-2032) (USD Billion)

10.4.5 Asia Pacific Hyper Car Market Estimates and Forecasts, by Car Type (2020-2032) (USD Billion)

10.4.6 China

10.4.6.1 China Hyper Car Market Estimates and Forecasts, by Propulsion (2020-2032) (USD Billion)

10.4.6.2 China Hyper Car Market Estimates and Forecasts, by Application (2020-2032) (USD Billion)

10.4.6.3 China Hyper Car Market Estimates and Forecasts, by Car Type (2020-2032) (USD Billion)

10.4.7 India

10.4.7.1 India Hyper Car Market Estimates and Forecasts, by Propulsion (2020-2032) (USD Billion)

10.4.7.2 India Hyper Car Market Estimates and Forecasts, by Application (2020-2032) (USD Billion)

10.4.7.3 India Hyper Car Market Estimates and Forecasts, by Car Type (2020-2032) (USD Billion)

10.4.8 Japan

10.4.8.1 Japan Hyper Car Market Estimates and Forecasts, by Propulsion (2020-2032) (USD Billion)

10.4.8.2 Japan Hyper Car Market Estimates and Forecasts, by Application (2020-2032) (USD Billion)

10.4.8.3 Japan Hyper Car Market Estimates and Forecasts, by Car Type (2020-2032) (USD Billion)

10.4.9 South Korea

10.4.9.1 South Korea Hyper Car Market Estimates and Forecasts, by Propulsion (2020-2032) (USD Billion)

10.4.9.2 South Korea Hyper Car Market Estimates and Forecasts, by Application (2020-2032) (USD Billion)

10.4.9.3 South Korea Hyper Car Market Estimates and Forecasts, by Car Type (2020-2032) (USD Billion)

10.4.10 Vietnam

10.4.10.1 Vietnam Hyper Car Market Estimates and Forecasts, by Propulsion (2020-2032) (USD Billion)

10.4.10.2 Vietnam Hyper Car Market Estimates and Forecasts, by Application (2020-2032) (USD Billion)

10.4.10.3 Vietnam Hyper Car Market Estimates and Forecasts, by Car Type (2020-2032) (USD Billion)

10.4.11 Singapore

10.4.11.1 Singapore Hyper Car Market Estimates and Forecasts, by Propulsion (2020-2032) (USD Billion)

10.4.11.2 Singapore Hyper Car Market Estimates and Forecasts, by Application (2020-2032) (USD Billion)

10.4.11.3 Singapore Hyper Car Market Estimates and Forecasts, by Car Type (2020-2032) (USD Billion)

10.4.12 Australia

10.4.12.1 Australia Hyper Car Market Estimates and Forecasts, by Propulsion (2020-2032) (USD Billion)

10.4.12.2 Australia Hyper Car Market Estimates and Forecasts, by Application (2020-2032) (USD Billion)

10.4.12.3 Australia Hyper Car Market Estimates and Forecasts, by Car Type (2020-2032) (USD Billion)

10.4.13 Rest of Asia Pacific

10.4.13.1 Rest of Asia Pacific Hyper Car Market Estimates and Forecasts, by Propulsion (2020-2032) (USD Billion)

10.4.13.2 Rest of Asia Pacific Hyper Car Market Estimates and Forecasts, by Application (2020-2032) (USD Billion)

10.4.13.3 Rest of Asia Pacific Hyper Car Market Estimates and Forecasts, by Car Type (2020-2032) (USD Billion)

10.5 Middle East and Africa

10.5.1 Middle East

10.5.1.1 Trends Analysis

10.5.1.2 Middle East Hyper Car Market Estimates and Forecasts, by Country (2020-2032) (USD Billion)

10.5.1.3 Middle East Hyper Car Market Estimates and Forecasts, by Propulsion (2020-2032) (USD Billion) 

10.5.1.4 Middle East Hyper Car Market Estimates and Forecasts, by Application (2020-2032) (USD Billion)

10.5.1.5 Middle East Hyper Car Market Estimates and Forecasts, by Car Type (2020-2032) (USD Billion)

10.5.1.6 UAE

10.5.1.6.1 UAE Hyper Car Market Estimates and Forecasts, by Propulsion (2020-2032) (USD Billion)

10.5.1.6.2 UAE Hyper Car Market Estimates and Forecasts, by Application (2020-2032) (USD Billion)

10.5.1.6.3 UAE Hyper Car Market Estimates and Forecasts, by Car Type (2020-2032) (USD Billion)

10.5.1.7 Egypt

10.5.1.7.1 Egypt Hyper Car Market Estimates and Forecasts, by Propulsion (2020-2032) (USD Billion)

10.5.1.7.2 Egypt Hyper Car Market Estimates and Forecasts, by Application (2020-2032) (USD Billion)

10.5.1.7.3 Egypt Hyper Car Market Estimates and Forecasts, by Car Type (2020-2032) (USD Billion)

10.5.1.8 Saudi Arabia

10.5.1.8.1 Saudi Arabia Hyper Car Market Estimates and Forecasts, by Propulsion (2020-2032) (USD Billion)

10.5.1.8.2 Saudi Arabia Hyper Car Market Estimates and Forecasts, by Application (2020-2032) (USD Billion)

10.5.1.8.3 Saudi Arabia Hyper Car Market Estimates and Forecasts, by Car Type (2020-2032) (USD Billion)

10.5.1.9 Qatar

10.5.1.9.1 Qatar Hyper Car Market Estimates and Forecasts, by Propulsion (2020-2032) (USD Billion)

10.5.1.9.2 Qatar Hyper Car Market Estimates and Forecasts, by Application (2020-2032) (USD Billion)

10.5.1.9.3 Qatar Hyper Car Market Estimates and Forecasts, by Car Type (2020-2032) (USD Billion)

10.5.1.10 Rest of Middle East

10.5.1.10.1 Rest of Middle East Hyper Car Market Estimates and Forecasts, by Propulsion (2020-2032) (USD Billion)

10.5.1.10.2 Rest of Middle East Hyper Car Market Estimates and Forecasts, by Application (2020-2032) (USD Billion)

10.5.1.10.3 Rest of Middle East Hyper Car Market Estimates and Forecasts, by Car Type (2020-2032) (USD Billion)

10.5.2 Africa

10.5.2.1 Trends Analysis

10.5.2.2 Africa Hyper Car Market Estimates and Forecasts, by Country (2020-2032) (USD Billion)

10.5.2.3 Africa Hyper Car Market Estimates and Forecasts, by Propulsion (2020-2032) (USD Billion) 

10.5.2.4 Africa Hyper Car Market Estimates and Forecasts, by Application (2020-2032) (USD Billion)

10.5.2.5 Africa Hyper Car Market Estimates and Forecasts, by Car Type (2020-2032) (USD Billion)

10.5.2.6 South Africa

10.5.2.6.1 South Africa Hyper Car Market Estimates and Forecasts, by Propulsion (2020-2032) (USD Billion)

10.5.2.6.2 South Africa Hyper Car Market Estimates and Forecasts, by Application (2020-2032) (USD Billion)

10.5.2.6.3 South Africa Hyper Car Market Estimates and Forecasts, by Car Type (2020-2032) (USD Billion)

10.5.2.7 Nigeria

10.5.2.7.1 Nigeria Hyper Car Market Estimates and Forecasts, by Propulsion (2020-2032) (USD Billion)

10.5.2.7.2 Nigeria Hyper Car Market Estimates and Forecasts, by Application (2020-2032) (USD Billion)

10.5.2.7.3 Nigeria Hyper Car Market Estimates and Forecasts, by Car Type (2020-2032) (USD Billion)

10.5.2.8 Rest of Africa

10.5.2.8.1 Rest of Africa Hyper Car Market Estimates and Forecasts, by Propulsion (2020-2032) (USD Billion)

10.5.2.8.2 Rest of Africa Hyper Car Market Estimates and Forecasts, by Application (2020-2032) (USD Billion)

10.5.2.8.3 Rest of Africa Hyper Car Market Estimates and Forecasts, by Car Type (2020-2032) (USD Billion)

10.6 Latin America

10.6.1 Trends Analysis

10.6.2 Latin America Hyper Car Market Estimates and Forecasts, by Country (2020-2032) (USD Billion)

10.6.3 Latin America Hyper Car Market Estimates and Forecasts, by Propulsion (2020-2032) (USD Billion) 

10.6.4 Latin America Hyper Car Market Estimates and Forecasts, by Application (2020-2032) (USD Billion)

10.6.5 Latin America Hyper Car Market Estimates and Forecasts, by Car Type (2020-2032) (USD Billion)

10.6.6 Brazil

10.6.6.1 Brazil Hyper Car Market Estimates and Forecasts, by Propulsion (2020-2032) (USD Billion)

10.6.6.2 Brazil Hyper Car Market Estimates and Forecasts, by Application (2020-2032) (USD Billion)

10.6.6.3 Brazil Hyper Car Market Estimates and Forecasts, by Car Type (2020-2032) (USD Billion)

10.6.7 Argentina

10.6.7.1 Argentina Hyper Car Market Estimates and Forecasts, by Propulsion (2020-2032) (USD Billion)

10.6.7.2 Argentina Hyper Car Market Estimates and Forecasts, by Application (2020-2032) (USD Billion)

10.6.7.3 Argentina Hyper Car Market Estimates and Forecasts, by Car Type (2020-2032) (USD Billion)

10.6.8 Colombia

10.6.8.1 Colombia Hyper Car Market Estimates and Forecasts, by Propulsion (2020-2032) (USD Billion)

10.6.8.2 Colombia Hyper Car Market Estimates and Forecasts, by Application (2020-2032) (USD Billion)

10.6.8.3 Colombia Hyper Car Market Estimates and Forecasts, by Car Type (2020-2032) (USD Billion)

10.6.9 Rest of Latin America

10.6.9.1 Rest of Latin America Hyper Car Market Estimates and Forecasts, by Propulsion (2020-2032) (USD Billion)

10.6.9.2 Rest of Latin America Hyper Car Market Estimates and Forecasts, by Application (2020-2032) (USD Billion)

10.6.9.3 Rest of Latin America Hyper Car Market Estimates and Forecasts, by Car Type (2020-2032) (USD Billion)

11. Company Profiles

11.1 Ferrari

11.1.1 Company Overview

11.1.2 Financial

11.1.3 Products/ Services Offered

111.1.4 SWOT Analysis

11.2 Lamborghini

11.2.1 Company Overview

11.2.2 Financial

11.2.3 Products/ Services Offered

11.2.4 SWOT Analysis

11.3 McLaren

11.3.1 Company Overview

11.3.2 Financial

11.3.3 Products/ Services Offered

11.3.4 SWOT Analysis

11.4 Lotus Cars

11.4.1 Company Overview

11.4.2 Financial

11.4.3 Products/ Services Offered

11.4.4 SWOT Analysis

11.5 Bugatti

11.5.1 Company Overview

11.5.2 Financial

11.5.3 Products/ Services Offered

11.5.4 SWOT Analysis

11.6 Porche

11.6.1 Company Overview

11.6.2 Financial

11.6.3 Products/ Services Offered

11.6.4 SWOT Analysis

11.7 Koenigsegg Automotive AB

11.7.1 Company Overview

11.7.2 Financial

11.7.3 Products/ Services Offered

11.7.4 SWOT Analysis

11.8 Aston Martin

11.8.1 Company Overview

11.8.2 Financial

11.8.3 Products/ Services Offered

11.8.4 SWOT Analysis

11.9 Pagani

11.9.1 Company Overview

11.9.2 Financial

11.9.3 Products/ Services Offered

11.9.4 SWOT Analysis

11.10 Others

11.9.1 Company Overview

11.9.2 Financial

11.9.3 Products/ Services Offered

11.9.4 SWOT Analysis

12. Competitive Landscape

12.1 Competitive Benchmarking

12.2 Market Share Analysis

12.3 Recent Developments

12.3.1 Industry News

12.3.2 Company News

12.3.3 Mergers & Acquisitions

13. Use Case and Best Practices

14. Conclusion

An accurate research report requires proper strategizing as well as implementation. There are multiple factors involved in the completion of good and accurate research report and selecting the best methodology to compete the research is the toughest part. Since the research reports we provide play a crucial role in any company’s decision-making process, therefore we at SNS Insider always believe that we should choose the best method which gives us results closer to reality. This allows us to reach at a stage wherein we can provide our clients best and accurate investment to output ratio.

Each report that we prepare takes a timeframe of 350-400 business hours for production. Starting from the selection of titles through a couple of in-depth brain storming session to the final QC process before uploading our titles on our website we dedicate around 350 working hours. The titles are selected based on their current market cap and the foreseen CAGR and growth.


The 5 steps process:

Step 1: Secondary Research:

Secondary Research or Desk Research is as the name suggests is a research process wherein, we collect data through the readily available information. In this process we use various paid and unpaid databases which our team has access to and gather data through the same. This includes examining of listed companies’ annual reports, Journals, SEC filling etc. Apart from this our team has access to various associations across the globe across different industries. Lastly, we have exchange relationships with various university as well as individual libraries.

Secondary Research

Step 2: Primary Research

When we talk about primary research, it is a type of study in which the researchers collect relevant data samples directly, rather than relying on previously collected data.  This type of research is focused on gaining content specific facts that can be sued to solve specific problems. Since the collected data is fresh and first hand therefore it makes the study more accurate and genuine.

We at SNS Insider have divided Primary Research into 2 parts.

Part 1 wherein we interview the KOLs of major players as well as the upcoming ones across various geographic regions. This allows us to have their view over the market scenario and acts as an important tool to come closer to the accurate market numbers. As many as 45 paid and unpaid primary interviews are taken from both the demand and supply side of the industry to make sure we land at an accurate judgement and analysis of the market.

This step involves the triangulation of data wherein our team analyses the interview transcripts, online survey responses and observation of on filed participants. The below mentioned chart should give a better understanding of the part 1 of the primary interview.

Primary Research

Part 2: In this part of primary research the data collected via secondary research and the part 1 of the primary research is validated with the interviews from individual consultants and subject matter experts.

Consultants are those set of people who have at least 12 years of experience and expertise within the industry whereas Subject Matter Experts are those with at least 15 years of experience behind their back within the same space. The data with the help of two main processes i.e., FGDs (Focused Group Discussions) and IDs (Individual Discussions). This gives us a 3rd party nonbiased primary view of the market scenario making it a more dependable one while collation of the data pointers.

Step 3: Data Bank Validation

Once all the information is collected via primary and secondary sources, we run that information for data validation. At our intelligence centre our research heads track a lot of information related to the market which includes the quarterly reports, the daily stock prices, and other relevant information. Our data bank server gets updated every fortnight and that is how the information which we collected using our primary and secondary information is revalidated in real time.

Data Bank Validation

Step 4: QA/QC Process

After all the data collection and validation our team does a final level of quality check and quality assurance to get rid of any unwanted or undesired mistakes. This might include but not limited to getting rid of the any typos, duplication of numbers or missing of any important information. The people involved in this process include technical content writers, research heads and graphics people. Once this process is completed the title gets uploader on our platform for our clients to read it.

Step 5: Final QC/QA Process:

This is the last process and comes when the client has ordered the study. In this process a final QA/QC is done before the study is emailed to the client. Since we believe in giving our clients a good experience of our research studies, therefore, to make sure that we do not lack at our end in any way humanly possible we do a final round of quality check and then dispatch the study to the client.

Key Segments:

By Propulsion

By Application

  • Racing Competition

  • Entertainment

  • Others

By Car Type

  • Compact (Below 1500cc)

  • Mid-size (1500-2500cc)

  • Full-size (Above 2500cc)

Request for Segment Customization as per your Business Requirement: Segment Customization Request

REGIONAL COVERAGE:

North America

  • US

  • Canada

  • Mexico

Europe

  • Eastern Europe

    • Poland

    • Romania

    • Hungary

    • Turkey

    • Rest of Eastern Europe

  • Western Europe

    • Germany

    • France

    • UK

    • Italy

    • Spain

    • Netherlands

    • Switzerland

    • Austria

    • Rest of Western Europe

Asia Pacific

  • China

  • India

  • Japan

  • South Korea

  • Vietnam

  • Singapore

  • Australia

  • Rest of Asia Pacific

Middle East & Africa

  • Middle East

    • UAE

    • Egypt

    • Saudi Arabia

    • Qatar

    • Rest of the Middle East

  • Africa

    • Nigeria

    • South Africa

    • Rest of Africa

Latin America

  • Brazil

  • Argentina

  • Colombia

Request for Country Level Research Report: Country Level Customization Request

Available Customization

With the given market data, SNS Insider offers customization as per the company’s specific needs. The following customization options are available for the report:

  • Product Analysis

  • Criss-Cross segment analysis (e.g. Product X Application)

  • Product Matrix which gives a detailed comparison of the product portfolio of each company

  • Geographic Analysis

  • Additional countries in any of the regions

  • Company Information

  • Detailed analysis and profiling of additional market players (Up to five)


  •            5000 (33% Discount)


  •            8950 (40% Discount)


  •            3050 (23% Discount)

Start a Conversation

Hi! Click one of our member below to chat on Phone