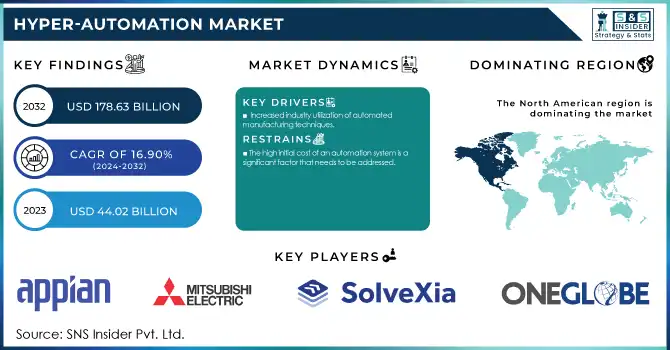
Hyper-Automation Market was valued at USD 44.38 billion in 2023 and is expected to reach USD 179.96 billion by 2032, growing at a CAGR of 16.89% from 2024-2032. This report contains an analysis of adoption rates of emerging technologies, investment trends, regulatory impact and compliance trends, and customer experience & engagement metrics. This market is growing with the need for operational efficiency, cost reduction, and innovation across industries in Finance & Accounting and IT & Telecommunication. Adoption of AI, machine learning, and robotic process automation are further driving growth in the market.
To Get More Information on Hyper-Automation Market - Request Sample Report
Increased Demand for Operational Efficiency Drives Adoption of Hyper-Automation Solutions to Streamline Processes and Reduce Costs
Organizations in all industries are looking to automate repetitive tasks to optimize operations. With automation technologies, businesses look to simplify complex processes, minimize human error, and significantly reduce operational costs. This growing focus on efficiency frees up resources to be used in higher-value activities and innovation. Automation tools not only speed up operations but also allow for better accuracy and consistency. As pressures grow on businesses to stay competitive but control costs, the need for hyper-automation solutions that combine AI, machine learning, and more is increasing. The demand goes up as the solution proffers greater scalability and flexibility: it enables companies to adjust fast and efficiently to changes in business environments and market conditions.
High Initial Implementation Costs Limit Widespread Adoption of Hyper-Automation Technologies, Especially for Small and Medium-Sized Businesses
There will also be large upfront costs as many solutions deploy hyper-automated systems such as AI, machine learning, and robotic process automation. Most of these advanced technologies can have expensive integrations, particularly with small and medium-sized enterprises operating under leaner budgets. An individual bot would cost in a range between USD 5,000 to USD 15,000 dollars, making them quite a fiscal burden. This does not even account for the maintenance cost, training, and support, which would further add to the costs. In some cases, it may require a specialized kind of infrastructure and expertise for the implementation and management of such solutions in their operations, creating further headaches in businesses that want to use automation on a bigger scale. It thus turns out to be a significant barrier which might hinder or delay businesses from utilizing hyper-automation's full potential.
Rising Digital Transformation Drives Increased Adoption of Hyper-Automation Technologies to Accelerate Modernization and Boost Efficiency
As businesses put more emphasis on digital transformation, hyper-automation is a prime solution to drive the streamlining of operations and productivity through the integration of AI, machine learning, and RPA. The organizations can now reduce manual efforts, enhance accuracy, and improve efficiency, hence accelerating their journey to digitalization. In 2024, UiPath reported that 40% of automation professionals had already integrated AI functionalities into their projects, and another 50% were planning to do so, thus showing the growing influence of AI in automation. Honeywell also partnered with Qualcomm to create an AI-enabled Multi-Modal Intelligent Agent to make interactions in distribution centers and retail more efficient, thus driving hyper-automation adoption. As industries modernize, the demand for hyper-automation technologies will rise, helping businesses stay competitive in a digital world.
Integration of Hyper-Automation Tools with Legacy Systems Presents Complex Challenges, Increasing Effort and Cost for Businesses
Most hyper-automation tools are difficult to integrate with legacy systems. Most organizations operate on legacy infrastructures that were not designed to work with modern automation technologies, like AI, machine learning, and robotic process automation. This often causes compatibility problems and demands much customization and technical knowledge to make things work. Other integration challenges that may be experienced by organizations include data synchronization. The older systems may store data in formats that are incompatible with the modern automation platforms. The integration process may disrupt ongoing operations and requires significant downtime, which complicates implementation. Such integration complexities increase the costs and effort involved in adopting hyper-automation, slowing down its widespread use. For businesses, this means overcoming such hurdles requires careful planning, skilled resources, and sometimes a complete overhaul of their technological infrastructure, which can be a major barrier to efficient implementation.
By Technology
In 2023, the Robotic Process Automation segment led the Hyper-Automation Market, capturing about 37% of the revenue share, driven by its ability to automate repetitive tasks, cut costs, and improve efficiency. In contrast, the Computer Vision segment is expected to grow at the fastest CAGR of 20.07% from 2024 to 2032, fueled by advancements in AI and machine learning. This growth is particularly prominent in industries like healthcare, automotive, and manufacturing, where automation enhances decision-making and quality control.
By Component
In 2023, the Hardware segment led the Hyper-Automation Market with a 45% revenue share, driven by the increasing demand for advanced components like sensors, robots, and IoT devices essential for automation. Meanwhile, the Software segment is expected to grow at the fastest CAGR of 18.20% from 2024 to 2032, fueled by advancements in AI, machine learning, and analytics platforms. As organizations seek to optimize processes and integrate intelligent systems, the demand for scalable software solutions is set to rise significantly.
By Function
In 2023, the Finance & Accounting segment dominated the Hyper-Automation Market with a 34% revenue share, driven by the growing need to automate financial processes, reduce errors, and lower operational costs. Meanwhile, the Marketing & Sales segment is projected to grow at the fastest CAGR of 19.17% from 2024 to 2032, fueled by the increasing demand for data-driven strategies and personalized customer experiences. Automation technologies are becoming vital for optimizing campaigns, managing leads, and enhancing customer engagement.
By End Use
In 2023, the IT & Telecommunication segment led the Hyper-Automation Market with a 27% revenue share, driven by the growing need for automation in network management, data processing, and system monitoring to improve efficiency and scalability. Meanwhile, the Manufacturing segment is expected to grow at the fastest CAGR of 18.65% from 2024 to 2032, fueled by the demand for smart manufacturing solutions that optimize production, reduce downtime, and ensure quality in a rapidly evolving market.
By Deployment
In 2023, the Cloud segment dominated the Hyper-Automation Market with a 51% revenue share, driven by its scalability, flexibility, and cost-effectiveness in supporting automation. Cloud solutions enable businesses to manage data, integrate tools, and scale operations efficiently. Conversely, the On-premise segment is expected to grow at the fastest CAGR of 17.89% from 2024 to 2032, fueled by the need for enhanced data security and control in industries with strict compliance requirements, such as banking and healthcare.
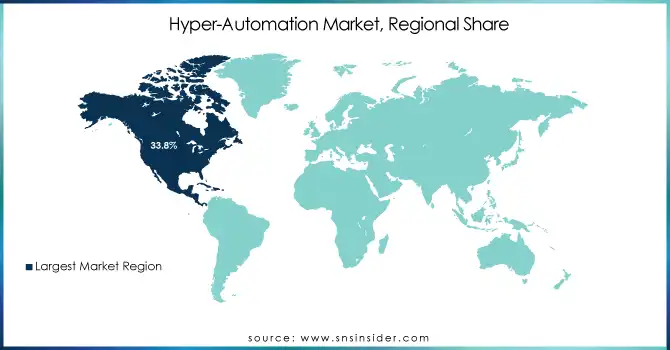
In 2023, North America dominated the Hyper-Automation Market, capturing the largest revenue share of about 39%. This dominance is driven by the region's strong adoption of advanced technologies and the presence of key players in the automation industry. Businesses across sectors such as IT, finance, and healthcare are increasingly leveraging automation to optimize processes, enhance productivity, and stay competitive, making North America a leader in the market.
On the other hand, the Asia Pacific region is expected to grow at the fastest CAGR of 19.16% from 2024 to 2032. This rapid growth can be attributed to the region's expanding industrial base, increasing investments in digital transformation, and government initiatives promoting automation technologies. Countries like China, India, and Japan are prioritizing automation to enhance manufacturing efficiency, improve supply chain management, and boost overall productivity, leading to significant market growth in this region.
Do You Need any Customization Research on Hyper-Automation Market - Enquire Now
UiPath (UiPath Studio, UiPath Orchestrator)
Wipro Ltd. (Wipro HOLMES, Wipro AiCore)
Tata Consultancy Services Ltd. (TCS Intelligent Process Automation, TCS Cognitive Business Operations)
Mitsubishi Electric Corporation (MELSEC iQ-R, MELFA Assista)
OneGlobe LLC (OneGlobe RPA, OneGlobe AI Automation)
SolveXia (SolveXia RPA, SolveXia Analytics)
Appian (Appian RPA, Appian AI)
Automation Anywhere Inc. (Automation Anywhere A2019, Automation Anywhere IQ Bot)
Allerin Tech Pvt. Ltd. (Allerin RPA, Allerin AI)
PagerDuty, Inc. (PagerDuty Incident Response, PagerDuty Event Intelligence)
Honeywell International Inc. (Honeywell Forge, Honeywell Process Solutions)
Alteryx (Alteryx Designer, Alteryx Server)
Catalytic Inc. (Catalytic Automation Platform, Catalytic AI Workflow)
akaBot (akaBot RPA, akaBot Insights)
Rocketbot (Rocketbot RPA, Rocketbot AI)
AutomationEdge (AutomationEdge IT Automation, AutomationEdge RPA)
Kofax (Kofax RPA, Kofax Intelligent Automation)
WorkFusion (WorkFusion Smart RPA, WorkFusion Intelligent Automation Cloud)
Pega Systems (Pega Robotic Automation, Pega AI)
ABBYY (ABBYY FlexiCapture, ABBYY Timeline)
IBM (IBM Robotic Process Automation, IBM Watson Orchestrate)
In 2025, Wipro enhanced its AI and Automation services, leveraging its Wipro HOLMES platform to help clients hyper-automate processes, transform operations, and reimagine customer experiences.
In July 2024, UiPath launched Autopilot, an AI-driven companion designed to automate tasks across diverse platforms and applications, significantly boosting productivity and operational efficiency.
In 2024, Honeywell launched a new generation of AI-capable handheld devices, including the CT37, CK67, and CK62, designed to optimize workflows in challenging environments like warehouses and retail floors.
| Report Attributes | Details |
|---|---|
| Market Size in 2023 | USD 44.38 Billion |
| Market Size by 2032 | USD 179.96 Billion |
| CAGR | CAGR of 16.89% From 2024 to 2032 |
| Base Year | 2023 |
| Forecast Period | 2024-2032 |
| Historical Data | 2020-2022 |
| Report Scope & Coverage | Market Size, Segments Analysis, Competitive Landscape, Regional Analysis, DROC & SWOT Analysis, Forecast Outlook |
| Key Segments | • By Component (Hardware, Software, Services) • By Technology (Robotic Process Automation, Machine Learning, Biometrics, Chatbots, Context Aware Computing, Natural Language Generation, Computer Vision) • By Deployment (On-premise, Cloud) • By Function (Marketing & Sales, Finance & Accounting, Human Resources, Operations & Supply Chain, Information Technology) • By End Use (Manufacturing, Automotive, BFSI, Healthcare, IT & Telecommunication, Retail, Transportation & Logistics, Others) |
| Regional Analysis/Coverage | North America (US, Canada, Mexico), Europe (Eastern Europe [Poland, Romania, Hungary, Turkey, Rest of Eastern Europe] Western Europe] Germany, France, UK, Italy, Spain, Netherlands, Switzerland, Austria, Rest of Western Europe]), Asia Pacific (China, India, Japan, South Korea, Vietnam, Singapore, Australia, Rest of Asia Pacific), Middle East & Africa (Middle East [UAE, Egypt, Saudi Arabia, Qatar, Rest of Middle East], Africa [Nigeria, South Africa, Rest of Africa], Latin America (Brazil, Argentina, Colombia, Rest of Latin America) |
| Company Profiles | UiPath, Wipro Ltd., Tata Consultancy Services Ltd., Mitsubishi Electric Corporation, OneGlobe LLC, SolveXia, Appian, Automation Anywhere Inc., Allerin Tech Pvt. Ltd., PagerDuty, Inc., Honeywell International Inc., Alteryx, Catalytic Inc., akaBot, Rocketbot, AutomationEdge, Kofax, WorkFusion, Pega Systems, ABBYY, IBM. |
ANS: Hyper-Automation Market was valued at USD 44.38 billion in 2023 and is expected to reach USD 179.96 billion by 2032, growing at a CAGR of 16.89% from 2024-2032.
ANS: Finance & Accounting and IT & Telecommunication are leading the demand for Hyper-Automation.
ANS: The Computer Vision segment is expected to grow at the fastest CAGR of 20.07% from 2024 to 2032.
ANS: The Hardware segment led the market with a 45% revenue share in 2023.
ANS: North America dominated the market with a 39% revenue share in 2023.
Table of Contents:
1. Introduction
1.1 Market Definition
1.2 Scope (Inclusion and Exclusions)
1.3 Research Assumptions
2. Executive Summary
2.1 Market Overview
2.2 Regional Synopsis
2.3 Competitive Summary
3. Research Methodology
3.1 Top-Down Approach
3.2 Bottom-up Approach
3.3. Data Validation
3.4 Primary Interviews
4. Market Dynamics Impact Analysis
4.1 Market Driving Factors Analysis
4.1.1 Drivers
4.1.2 Restraints
4.2 PESTLE Analysis
4.3 Porter’s Five Forces Model
5. Statistical Insights and Trends Reporting
5.1 Adoption Rates of Emerging Technologies
5.2 Investment Trends
5.3 Regulatory Impact and Compliance Trends
5.4 Customer Experience & Engagement Metrics
6. Competitive Landscape
6.1 List of Major Companies, By Region
6.2 Market Share Analysis, By Region
6.3 Product Benchmarking
6.3.1 Product specifications and features
6.3.2 Pricing
6. 4 Strategic Initiatives
6.4.1 Marketing and promotional activities
6.4.2 Distribution and supply chain strategies
6.4.3 Expansion plans and new product launches
6.4.4 Strategic partnerships and collaborations
6.5 Technological Advancements
6.6 Market Positioning and Branding
7. Hyper-Automation Market Segmentation, By Component
7.1 Chapter Overview
7.2 Hardware
7.2.1 Hardware Market Trends Analysis (2020-2032)
7.2.2 Hardware Market Size Estimates and Forecasts to 2032 (USD Billion)
7.3 Software
7.3.1 Software Market Trends Analysis (2020-2032)
7.3.2 Software Market Size Estimates and Forecasts to 2032 (USD Billion)
7.4 Services
7.4.1 Services Market Trends Analysis (2020-2032)
7.4.2 Services Market Size Estimates and Forecasts to 2032 (USD Billion)
8. Hyper-Automation Market Segmentation, By Deployment
8.1 Chapter Overview
8.2 Robotic Process Automation
8.2.1 Robotic Process Automation Market Trends Analysis (2020-2032)
8.2.2 Robotic Process Automation Market Size Estimates And Forecasts To 2032 (USD Billion)
8.3 Machine Learning
8.3.1 Machine Learning Market Trends Analysis (2020-2032)
8.3.2 Machine Learning Market Size Estimates And Forecasts To 2032 (USD Billion)
8.4 Biometrics
8.4.1 Biometrics Market Trends Analysis (2020-2032)
8.4.2 Biometrics Market Size Estimates And Forecasts To 2032 (USD Billion)
8.5 Chatbots
8.5.1 Chatbots Market Trends Analysis (2020-2032)
8.5.2 Chatbots Market Size Estimates And Forecasts To 2032 (USD Billion)
8. 6 Context Aware Computing
8.6.1 Context Aware Computing Market Trends Analysis (2020-2032)
8.6.2 Context Aware Computing Market Size Estimates And Forecasts To 2032 (USD Billion)
8.7 Operations & Supply Chain
8.7.1 Operations & Supply ChainMarket Trends Analysis (2020-2032)
8.7.2 Operations & Supply ChainMarket Size Estimates And Forecasts To 2032 (USD Billion)
8.8 Computer Vision
8.8.1 Computer Vision Market Trends Analysis (2020-2032)
8.8.2 Computer Vision Market Size Estimates And Forecasts To 2032 (USD Billion)
9. Hyper-Automation Market Segmentation, By Function
9.1 Chapter Overview
9.2 Marketing & Sales
9.2.1 Marketing & Sales Market Trends Analysis (2020-2032)
9.2.2 Marketing & Sales Market Size Estimates And Forecasts To 2032 (USD Billion)
9.3 Finance & Accounting
9.3.1 Finance & Accounting Market Trends Analysis (2020-2032)
9.3.2 Finance & Accounting Market Size Estimates And Forecasts To 2032 (USD Billion)
9.4 Human Resources
9.4.1 Human Resources Market Trends Analysis (2020-2032)
9.4.2 Human Resources Market Size Estimates And Forecasts To 2032 (USD Billion)
9.5 Operations & Supply Chain
9.5.1 Operations & Supply Chain Market Trends Analysis (2020-2032)
9.5.2 Operations & Supply Chain Market Size Estimates And Forecasts To 2032 (USD Billion)
9.6 Information Technology
9.6.1 Information Technology Market Trends Analysis (2020-2032)
9.6.2 Information Technology Market Size Estimates And Forecasts To 2032 (USD Billion)
10. Hyper-Automation Market Segmentation, By Deployment
10.1 Chapter Overview
10.2 On-premise
10.2.1 On-premise Market Trends Analysis (2020-2032)
10.2.2 On-premise Market Size Estimates And Forecasts To 2032 (USD Billion)
10.3 Cloud
10.3.1 Cloud Market Trends Analysis (2020-2032)
10.3.2 Cloud Market Size Estimates And Forecasts To 2032 (USD Billion)
11. Hyper-Automation Market Segmentation, By End Use
11.1 Chapter Overview
11.2 Manufacturing
11.2.1 Manufacturing Market Trends Analysis (2020-2032)
11.2.2 Manufacturing Market Size Estimates And Forecasts To 2032 (USD Billion)
11.3 Automotive
11.3.1 Automotive Market Trends Analysis (2020-2032)
11.3.2 Automotive Market Size Estimates And Forecasts To 2032 (USD Billion)
11.4 BFSI
11.4.1 BFSI Market Trends Analysis (2020-2032)
11.4.2 BFSI Market Size Estimates And Forecasts To 2032 (USD Billion)
11. 5 Healthcare
11.5.1 Healthcare Market Trends Analysis (2020-2032)
11.5.2 Healthcare Market Size Estimates And Forecasts To 2032 (USD Billion)
11.6 IT & Telecommunication
11.6.1 IT & Telecommunication Market Trends Analysis (2020-2032)
11.6.2 IT & Telecommunication Market Size Estimates And Forecasts To 2032 (USD Billion)
11.7 Retail
11.7.1 Retail Market Trends Analysis (2020-2032)
11.7.2 Retail Market Size Estimates And Forecasts To 2032 (USD Billion)
11.8 Transportation & Logistics
11.8.1 Transportation & Logistics Market Trends Analysis (2020-2032)
11.8.2 Transportation & Logistics Market Size Estimates And Forecasts To 2032 (USD Billion)
11.9 Others
11.9.1 Others Market Trends Analysis (2020-2032)
11.9.2 Others Market Size Estimates And Forecasts To 2032 (USD Billion)
12. Regional Analysis
12.1 Chapter Overview
12.2 North America
12.2.1 Trends Analysis
12.2.2 North America Hyper-Automation Market Estimates And Forecasts, By Country (2020-2032) (USD Billion)
12.2.3 North America Hyper-Automation Market Estimates And Forecasts, By Component (2020-2032) (USD Billion)
12.2.4 North America Hyper-Automation Market Estimates And Forecasts, By Deployment (2020-2032) (USD Billion)
12.2.5 North America Hyper-Automation Market Estimates And Forecasts, By Function (2020-2032) (USD Billion)
12.2.6 North America Hyper-Automation Market Estimates And Forecasts, By Deployment (2020-2032) (USD Billion)
12.2.7 North America Hyper-Automation Market Estimates And Forecasts, By End Use (2020-2032) (USD Billion)
12.2.8 USA
12.2.8.1 USA Hyper-Automation Market Estimates And Forecasts, By Component (2020-2032) (USD Billion)
12.2.8.2 USA Hyper-Automation Market Estimates And Forecasts, By Deployment (2020-2032) (USD Billion)
12.2.8.3 USA Hyper-Automation Market Estimates And Forecasts, By Function (2020-2032) (USD Billion)
12.2.8.4 USA Hyper-Automation Market Estimates And Forecasts, By Deployment (2020-2032) (USD Billion)
12.2.8.5 USA Hyper-Automation Market Estimates And Forecasts, By End Use (2020-2032) (USD Billion)
12.2.9 Canada
12.2.9.1 Canada Hyper-Automation Market Estimates And Forecasts, By Component (2020-2032) (USD Billion)
12.2.9.2 Canada Hyper-Automation Market Estimates And Forecasts, By Deployment (2020-2032) (USD Billion)
12.2.9.3 Canada Hyper-Automation Market Estimates And Forecasts, By Function (2020-2032) (USD Billion)
12.2.9.4 Canada Hyper-Automation Market Estimates And Forecasts, By Deployment (2020-2032) (USD Billion)
12.2.9.5 Canada Hyper-Automation Market Estimates And Forecasts, By End Use (2020-2032) (USD Billion)
12.2.10 Mexico
12.2.10.1 Mexico Hyper-Automation Market Estimates And Forecasts, By Component (2020-2032) (USD Billion)
12.2.10.2 Mexico Hyper-Automation Market Estimates And Forecasts, By Deployment (2020-2032) (USD Billion)
12.2.10.3 Mexico Hyper-Automation Market Estimates And Forecasts, By Function (2020-2032) (USD Billion)
12.2.10.4 Mexico Hyper-Automation Market Estimates And Forecasts, By Deployment (2020-2032) (USD Billion)
12.2.10.5 Mexico Hyper-Automation Market Estimates And Forecasts, By End Use (2020-2032) (USD Billion)
12.3 Europe
12.3.1 Eastern Europe
12.3.1.1 Trends Analysis
12.3.1.2 Eastern Europe Hyper-Automation Market Estimates And Forecasts, By Country (2020-2032) (USD Billion)
12.3.1.3 Eastern Europe Hyper-Automation Market Estimates And Forecasts, By Component (2020-2032) (USD Billion)
12.3.1.4 Eastern Europe Hyper-Automation Market Estimates And Forecasts, By Deployment (2020-2032) (USD Billion)
12.3.1.5 Eastern Europe Hyper-Automation Market Estimates And Forecasts, By Function (2020-2032) (USD Billion)
12.3.1.6 Eastern Europe Hyper-Automation Market Estimates And Forecasts, By Deployment (2020-2032) (USD Billion)
12.3.1.7 Eastern Europe Hyper-Automation Market Estimates And Forecasts, By End Use (2020-2032) (USD Billion)
12.3.1.8 Poland
12.3.1.8.1 Poland Hyper-Automation Market Estimates And Forecasts, By Component (2020-2032) (USD Billion)
12.3.1.8.2 Poland Hyper-Automation Market Estimates And Forecasts, By Deployment (2020-2032) (USD Billion)
12.3.1.8.3 Poland Hyper-Automation Market Estimates And Forecasts, By Function (2020-2032) (USD Billion)
12.3.1.8.4 Poland Hyper-Automation Market Estimates And Forecasts, By Deployment (2020-2032) (USD Billion)
12.3.1.8.5 Poland Hyper-Automation Market Estimates And Forecasts, By End Use (2020-2032) (USD Billion)
12.3.1.9 Romania
12.3.1.9.1 Romania Hyper-Automation Market Estimates And Forecasts, By Component (2020-2032) (USD Billion)
12.3.1.9.2 Romania Hyper-Automation Market Estimates And Forecasts, By Deployment (2020-2032) (USD Billion)
12.3.1.9.3 Romania Hyper-Automation Market Estimates And Forecasts, By Function (2020-2032) (USD Billion)
12.3.1.9.4 Romania Hyper-Automation Market Estimates And Forecasts, By Deployment (2020-2032) (USD Billion)
12.3.1.9.5 Romania Hyper-Automation Market Estimates And Forecasts, By End Use (2020-2032) (USD Billion)
12.3.1.10 Hungary
12.3.1.10.1 Hungary Hyper-Automation Market Estimates And Forecasts, By Component (2020-2032) (USD Billion)
12.3.1.10.2 Hungary Hyper-Automation Market Estimates And Forecasts, By Deployment (2020-2032) (USD Billion)
12.3.1.10.3 Hungary Hyper-Automation Market Estimates And Forecasts, By Function (2020-2032) (USD Billion)
12.3.1.10.4 Hungary Hyper-Automation Market Estimates And Forecasts, By Deployment (2020-2032) (USD Billion)
12.3.1.10.5 Hungary Hyper-Automation Market Estimates And Forecasts, By End Use (2020-2032) (USD Billion)
12.3.1.11 Turkey
12.3.1.11.1 Turkey Hyper-Automation Market Estimates And Forecasts, By Component (2020-2032) (USD Billion)
12.3.1.11.2 Turkey Hyper-Automation Market Estimates And Forecasts, By Deployment (2020-2032) (USD Billion)
12.3.1.11.3 Turkey Hyper-Automation Market Estimates And Forecasts, By Function (2020-2032) (USD Billion)
12.3.1.11.4 Turkey Hyper-Automation Market Estimates And Forecasts, By Deployment (2020-2032) (USD Billion)
12.3.1.11.5 Turkey Hyper-Automation Market Estimates And Forecasts, By End Use (2020-2032) (USD Billion)
12.3.1.12 Rest Of Eastern Europe
12.3.1.12.1 Rest Of Eastern Europe Hyper-Automation Market Estimates And Forecasts, By Component (2020-2032) (USD Billion)
12.3.1.12.2 Rest Of Eastern Europe Hyper-Automation Market Estimates And Forecasts, By Deployment (2020-2032) (USD Billion)
12.3.1.12.3 Rest Of Eastern Europe Hyper-Automation Market Estimates And Forecasts, By Function (2020-2032) (USD Billion)
12.3.1.12.4 Rest Of Eastern Europe Hyper-Automation Market Estimates And Forecasts, By Deployment (2020-2032) (USD Billion)
12.3.1.12.5 Rest Of Eastern Europe Hyper-Automation Market Estimates And Forecasts, By End Use (2020-2032) (USD Billion)
12.3.2 Western Europe
12.3.2.1 Trends Analysis
12.3.2.2 Western Europe Hyper-Automation Market Estimates And Forecasts, By Country (2020-2032) (USD Billion)
12.3.2.3 Western Europe Hyper-Automation Market Estimates And Forecasts, By Component (2020-2032) (USD Billion)
12.3.2.4 Western Europe Hyper-Automation Market Estimates And Forecasts, By Deployment (2020-2032) (USD Billion)
12.3.2.5 Western Europe Hyper-Automation Market Estimates And Forecasts, By Function (2020-2032) (USD Billion)
12.3.2.6 Western Europe Hyper-Automation Market Estimates And Forecasts, By Deployment (2020-2032) (USD Billion)
12.3.2.7 Western Europe Hyper-Automation Market Estimates And Forecasts, By End Use (2020-2032) (USD Billion)
12.3.2.8 Germany
12.3.2.8.1 Germany Hyper-Automation Market Estimates And Forecasts, By Component (2020-2032) (USD Billion)
12.3.2.8.2 Germany Hyper-Automation Market Estimates And Forecasts, By Deployment (2020-2032) (USD Billion)
12.3.2.8.3 Germany Hyper-Automation Market Estimates And Forecasts, By Function (2020-2032) (USD Billion)
12.3.2.8.4 Germany Hyper-Automation Market Estimates And Forecasts, By Deployment (2020-2032) (USD Billion)
12.3.2.8.5 Germany Hyper-Automation Market Estimates And Forecasts, By End Use (2020-2032) (USD Billion)
12.3.2.9 France
12.3.2.9.1 France Hyper-Automation Market Estimates And Forecasts, By Component (2020-2032) (USD Billion)
12.3.2.9.2 France Hyper-Automation Market Estimates And Forecasts, By Deployment (2020-2032) (USD Billion)
12.3.2.9.3 France Hyper-Automation Market Estimates And Forecasts, By Function (2020-2032) (USD Billion)
12.3.2.9.4 France Hyper-Automation Market Estimates And Forecasts, By Deployment (2020-2032) (USD Billion)
12.3.2.9.5 France Hyper-Automation Market Estimates And Forecasts, By End Use (2020-2032) (USD Billion)
12.3.2.10 UK
12.3.2.10.1 UK Hyper-Automation Market Estimates And Forecasts, By Component (2020-2032) (USD Billion)
12.3.2.10.2 UK Hyper-Automation Market Estimates And Forecasts, By Deployment (2020-2032) (USD Billion)
12.3.2.10.3 UK Hyper-Automation Market Estimates And Forecasts, By Function (2020-2032) (USD Billion)
12.3.2.10.4 UK Hyper-Automation Market Estimates And Forecasts, By Deployment (2020-2032) (USD Billion)
12.3.2.10.5 UK Hyper-Automation Market Estimates And Forecasts, By End Use (2020-2032) (USD Billion)
12.3.2.11 Italy
12.3.2.11.1 Italy Hyper-Automation Market Estimates And Forecasts, By Component (2020-2032) (USD Billion)
12.3.2.11.2 Italy Hyper-Automation Market Estimates And Forecasts, By Deployment (2020-2032) (USD Billion)
12.3.2.11.3 Italy Hyper-Automation Market Estimates And Forecasts, By Function (2020-2032) (USD Billion)
12.3.2.11.4 Italy Hyper-Automation Market Estimates And Forecasts, By Deployment (2020-2032) (USD Billion)
12.3.2.11.5 Italy Hyper-Automation Market Estimates And Forecasts, By End Use (2020-2032) (USD Billion)
12.3.2.12 Spain
12.3.2.12.1 Spain Hyper-Automation Market Estimates And Forecasts, By Component (2020-2032) (USD Billion)
12.3.2.12.2 Spain Hyper-Automation Market Estimates And Forecasts, By Deployment (2020-2032) (USD Billion)
12.3.2.12.3 Spain Hyper-Automation Market Estimates And Forecasts, By Function (2020-2032) (USD Billion)
12.3.2.12.4 Spain Hyper-Automation Market Estimates And Forecasts, By Deployment (2020-2032) (USD Billion)
12.3.2.12.5 Spain Hyper-Automation Market Estimates And Forecasts, By End Use (2020-2032) (USD Billion)
12.3.2.13 Netherlands
12.3.2.13.1 Netherlands Hyper-Automation Market Estimates And Forecasts, By Component (2020-2032) (USD Billion)
12.3.2.13.2 Netherlands Hyper-Automation Market Estimates And Forecasts, By Deployment (2020-2032) (USD Billion)
12.3.2.13.3 Netherlands Hyper-Automation Market Estimates And Forecasts, By Function (2020-2032) (USD Billion)
12.3.2.13.4 Netherlands Hyper-Automation Market Estimates And Forecasts, By Deployment (2020-2032) (USD Billion)
12.3.2.13.5 Netherlands Hyper-Automation Market Estimates And Forecasts, By End Use (2020-2032) (USD Billion)
12.3.2.14 Switzerland
12.3.2.14.1 Switzerland Hyper-Automation Market Estimates And Forecasts, By Component (2020-2032) (USD Billion)
12.3.2.14.2 Switzerland Hyper-Automation Market Estimates And Forecasts, By Deployment (2020-2032) (USD Billion)
12.3.2.14.3 Switzerland Hyper-Automation Market Estimates And Forecasts, By Function (2020-2032) (USD Billion)
12.3.2.14.4 Switzerland Hyper-Automation Market Estimates And Forecasts, By Deployment (2020-2032) (USD Billion)
12.3.2.12.5 Switzerland Hyper-Automation Market Estimates And Forecasts, By End Use (2020-2032) (USD Billion)
12.3.2.15 Austria
12.3.2.15.1 Austria Hyper-Automation Market Estimates And Forecasts, By Component (2020-2032) (USD Billion)
12.3.2.15.2 Austria Hyper-Automation Market Estimates And Forecasts, By Deployment (2020-2032) (USD Billion)
12.3.2.15.3 Austria Hyper-Automation Market Estimates And Forecasts, By Function (2020-2032) (USD Billion)
12.3.2.15.4 Austria Hyper-Automation Market Estimates And Forecasts, By Deployment (2020-2032) (USD Billion)
12.3.2.15.5 Austria Hyper-Automation Market Estimates And Forecasts, By End Use (2020-2032) (USD Billion)
12.3.2.16 Rest Of Western Europe
12.3.2.16.1 Rest Of Western Europe Hyper-Automation Market Estimates And Forecasts, By Component (2020-2032) (USD Billion)
12.3.2.16.2 Rest Of Western Europe Hyper-Automation Market Estimates And Forecasts, By Deployment (2020-2032) (USD Billion)
12.3.2.16.3 Rest Of Western Europe Hyper-Automation Market Estimates And Forecasts, By Function (2020-2032) (USD Billion)
12.3.2.16.4 Rest Of Western Europe Hyper-Automation Market Estimates And Forecasts, By Deployment (2020-2032) (USD Billion)
12.3.2.16.5 Rest Of Western Europe Hyper-Automation Market Estimates And Forecasts, By End Use (2020-2032) (USD Billion)
12.4 Asia Pacific
12.4.1 Trends Analysis
12.4.2 Asia Pacific Hyper-Automation Market Estimates And Forecasts, By Country (2020-2032) (USD Billion)
12.4.3 Asia Pacific Hyper-Automation Market Estimates And Forecasts, By Component (2020-2032) (USD Billion)
12.4.4 Asia Pacific Hyper-Automation Market Estimates And Forecasts, By Deployment (2020-2032) (USD Billion)
12.4.5 Asia Pacific Hyper-Automation Market Estimates And Forecasts, By Function (2020-2032) (USD Billion)
12.4.6 Asia Pacific Hyper-Automation Market Estimates And Forecasts, By Deployment (2020-2032) (USD Billion)
12.4.7 Asia Pacific Hyper-Automation Market Estimates And Forecasts, By End Use (2020-2032) (USD Billion)
12.4.8 China
12.4.8.1 China Hyper-Automation Market Estimates And Forecasts, By Component (2020-2032) (USD Billion)
12.4.8.2 China Hyper-Automation Market Estimates And Forecasts, By Deployment (2020-2032) (USD Billion)
12.4.8.3 China Hyper-Automation Market Estimates And Forecasts, By Function (2020-2032) (USD Billion)
12.4.8.4 China Hyper-Automation Market Estimates And Forecasts, By Deployment (2020-2032) (USD Billion)
12.4.8.5 China Hyper-Automation Market Estimates And Forecasts, By End Use (2020-2032) (USD Billion)
12.4.9 India
12.4.9.1 India Hyper-Automation Market Estimates And Forecasts, By Component (2020-2032) (USD Billion)
12.4.9.2 India Hyper-Automation Market Estimates And Forecasts, By Deployment (2020-2032) (USD Billion)
12.4.9.3 India Hyper-Automation Market Estimates And Forecasts, By Function (2020-2032) (USD Billion)
12.4.9.4 India Hyper-Automation Market Estimates And Forecasts, By Deployment (2020-2032) (USD Billion)
12.4.9.5 India Hyper-Automation Market Estimates And Forecasts, By End Use (2020-2032) (USD Billion)
12.4.10 Japan
12.4.10.1 Japan Hyper-Automation Market Estimates And Forecasts, By Component (2020-2032) (USD Billion)
12.4.10.2 Japan Hyper-Automation Market Estimates And Forecasts, By Deployment (2020-2032) (USD Billion)
12.4.10.3 Japan Hyper-Automation Market Estimates And Forecasts, By Function (2020-2032) (USD Billion)
12.4.10.4 Japan Hyper-Automation Market Estimates And Forecasts, By Deployment (2020-2032) (USD Billion)
12.4.10.5 Japan Hyper-Automation Market Estimates And Forecasts, By End Use (2020-2032) (USD Billion)
12.4.11 South Korea
12.4.11.1 South Korea Hyper-Automation Market Estimates And Forecasts, By Component (2020-2032) (USD Billion)
12.4.11.2 South Korea Hyper-Automation Market Estimates And Forecasts, By Deployment (2020-2032) (USD Billion)
12.4.11.3 South Korea Hyper-Automation Market Estimates And Forecasts, By Function (2020-2032) (USD Billion)
12.4.11.4 South Korea Hyper-Automation Market Estimates And Forecasts, By Deployment (2020-2032) (USD Billion)
12.4.11.5 South Korea Hyper-Automation Market Estimates And Forecasts, By End Use (2020-2032) (USD Billion)
12.4.12 Vietnam
12.4.12.1 Vietnam Hyper-Automation Market Estimates And Forecasts, By Component (2020-2032) (USD Billion)
12.4.12.2 Vietnam Hyper-Automation Market Estimates And Forecasts, By Deployment (2020-2032) (USD Billion)
12.4.12.3 Vietnam Hyper-Automation Market Estimates And Forecasts, By Function (2020-2032) (USD Billion)
12.4.12.4 Vietnam Hyper-Automation Market Estimates And Forecasts, By Deployment (2020-2032) (USD Billion)
12.4.12.5 Vietnam Hyper-Automation Market Estimates And Forecasts, By End Use (2020-2032) (USD Billion)
12.4.13 Singapore
12.4.13.1 Singapore Hyper-Automation Market Estimates And Forecasts, By Component (2020-2032) (USD Billion)
12.4.13.2 Singapore Hyper-Automation Market Estimates And Forecasts, By Deployment (2020-2032) (USD Billion)
12.4.13.3 Singapore Hyper-Automation Market Estimates And Forecasts, By Function (2020-2032) (USD Billion)
12.4.13.4 Singapore Hyper-Automation Market Estimates And Forecasts, By Deployment (2020-2032) (USD Billion)
12.4.13.5 Singapore Hyper-Automation Market Estimates And Forecasts, By End Use (2020-2032) (USD Billion)
12.4.14 Australia
12.4.14.1 Australia Hyper-Automation Market Estimates And Forecasts, By Component (2020-2032) (USD Billion)
12.4.14.2 Australia Hyper-Automation Market Estimates And Forecasts, By Deployment (2020-2032) (USD Billion)
12.4.14.3 Australia Hyper-Automation Market Estimates And Forecasts, By Function (2020-2032) (USD Billion)
12.4.14.4 Australia Hyper-Automation Market Estimates And Forecasts, By Deployment (2020-2032) (USD Billion)
12.4.14.5 Australia Hyper-Automation Market Estimates And Forecasts, By End Use (2020-2032) (USD Billion)
12.4.15 Rest Of Asia Pacific
12.4.15.1 Rest Of Asia Pacific Hyper-Automation Market Estimates And Forecasts, By Component (2020-2032) (USD Billion)
12.4.15.2 Rest Of Asia Pacific Hyper-Automation Market Estimates And Forecasts, By Deployment (2020-2032) (USD Billion)
12.4.15.3 Rest Of Asia Pacific Hyper-Automation Market Estimates And Forecasts, By Function (2020-2032) (USD Billion)
12.4.15.4 Rest Of Asia Pacific Hyper-Automation Market Estimates And Forecasts, By Deployment (2020-2032) (USD Billion)
12.4.15.5 Rest Of Asia Pacific Hyper-Automation Market Estimates And Forecasts, By End Use (2020-2032) (USD Billion)
12.5 Middle East And Africa
12.5.1 Middle East
12.5.1.1 Trends Analysis
12.5.1.2 Middle East Hyper-Automation Market Estimates And Forecasts, By Country (2020-2032) (USD Billion)
12.5.1.3 Middle East Hyper-Automation Market Estimates And Forecasts, By Component (2020-2032) (USD Billion)
12.5.1.4 Middle East Hyper-Automation Market Estimates And Forecasts, By Deployment (2020-2032) (USD Billion)
12.5.1.5 Middle East Hyper-Automation Market Estimates And Forecasts, By Function (2020-2032) (USD Billion)
12.5.1.6 Middle East Hyper-Automation Market Estimates And Forecasts, By Deployment (2020-2032) (USD Billion)
12.5.1.7 Middle East Hyper-Automation Market Estimates And Forecasts, By End Use (2020-2032) (USD Billion)
12.5.1.8 UAE
12.5.1.8.1 UAE Hyper-Automation Market Estimates And Forecasts, By Component (2020-2032) (USD Billion)
12.5.1.8.2 UAE Hyper-Automation Market Estimates And Forecasts, By Deployment (2020-2032) (USD Billion)
12.5.1.8.3 UAE Hyper-Automation Market Estimates And Forecasts, By Function (2020-2032) (USD Billion)
12.5.1.8.4 UAE Hyper-Automation Market Estimates And Forecasts, By Deployment (2020-2032) (USD Billion)
12.5.1.8.5 UAE Hyper-Automation Market Estimates And Forecasts, By End Use (2020-2032) (USD Billion)
12.5.1.9 Egypt
12.5.1.9.1 Egypt Hyper-Automation Market Estimates And Forecasts, By Component (2020-2032) (USD Billion)
12.5.1.9.2 Egypt Hyper-Automation Market Estimates And Forecasts, By Deployment (2020-2032) (USD Billion)
12.5.1.9.3 Egypt Hyper-Automation Market Estimates And Forecasts, By Function (2020-2032) (USD Billion)
12.5.1.9.4 Egypt Hyper-Automation Market Estimates And Forecasts, By Deployment (2020-2032) (USD Billion)
12.5.1.9.5 Egypt Hyper-Automation Market Estimates And Forecasts, By End Use (2020-2032) (USD Billion)
12.5.1.10 Saudi Arabia
12.5.1.10.1 Saudi Arabia Hyper-Automation Market Estimates And Forecasts, By Component (2020-2032) (USD Billion)
12.5.1.10.2 Saudi Arabia Hyper-Automation Market Estimates And Forecasts, By Deployment (2020-2032) (USD Billion)
12.5.1.10.3 Saudi Arabia Hyper-Automation Market Estimates And Forecasts, By Function (2020-2032) (USD Billion)
12.5.1.10.4 Saudi Arabia Hyper-Automation Market Estimates And Forecasts, By Deployment (2020-2032) (USD Billion)
12.5.1.10.5 Saudi Arabia Hyper-Automation Market Estimates And Forecasts, By End Use (2020-2032) (USD Billion)
12.5.1.11 Qatar
12.5.1.11.1 Qatar Hyper-Automation Market Estimates And Forecasts, By Component (2020-2032) (USD Billion)
12.5.1.11.2 Qatar Hyper-Automation Market Estimates And Forecasts, By Deployment (2020-2032) (USD Billion)
12.5.1.11.3 Qatar Hyper-Automation Market Estimates And Forecasts, By Function (2020-2032) (USD Billion)
12.5.1.11.4 Qatar Hyper-Automation Market Estimates And Forecasts, By Deployment (2020-2032) (USD Billion)
12.5.1.11.5 Qatar Hyper-Automation Market Estimates And Forecasts, By End Use (2020-2032) (USD Billion)
12.5.1.12 Rest Of Middle East
12.5.1.12.1 Rest Of Middle East Hyper-Automation Market Estimates And Forecasts, By Component (2020-2032) (USD Billion)
12.5.1.12.2 Rest Of Middle East Hyper-Automation Market Estimates And Forecasts, By Deployment (2020-2032) (USD Billion)
12.5.1.12.3 Rest Of Middle East Hyper-Automation Market Estimates And Forecasts, By Function (2020-2032) (USD Billion)
12.5.1.12.4 Rest Of Middle East Hyper-Automation Market Estimates And Forecasts, By Deployment (2020-2032) (USD Billion)
12.5.1.12.5 Rest Of Middle East Hyper-Automation Market Estimates And Forecasts, By End Use (2020-2032) (USD Billion)
12.5.2 Africa
12.5.2.1 Trends Analysis
12.5.2.2 Africa Hyper-Automation Market Estimates And Forecasts, By Country (2020-2032) (USD Billion)
12.5.2.3 Africa Hyper-Automation Market Estimates And Forecasts, By Component (2020-2032) (USD Billion)
12.5.2.4 Africa Hyper-Automation Market Estimates And Forecasts, By Deployment (2020-2032) (USD Billion)
12.5.2.5 Africa Hyper-Automation Market Estimates And Forecasts, By Function (2020-2032) (USD Billion)
12.5.2.6 Africa Hyper-Automation Market Estimates And Forecasts, By Deployment (2020-2032) (USD Billion)
12.5.2.7 Africa Hyper-Automation Market Estimates And Forecasts, By End Use (2020-2032) (USD Billion)
12.5.2.8 South Africa
12.5.2.8.1 South Africa Hyper-Automation Market Estimates And Forecasts, By Component (2020-2032) (USD Billion)
12.5.2.8.2 South Africa Hyper-Automation Market Estimates And Forecasts, By Deployment (2020-2032) (USD Billion)
12.5.2.8.3 South Africa Hyper-Automation Market Estimates And Forecasts, By Function (2020-2032) (USD Billion)
12.5.2.8.4 South Africa Hyper-Automation Market Estimates And Forecasts, By Deployment (2020-2032) (USD Billion)
12.5.2.8.5 South Africa Hyper-Automation Market Estimates And Forecasts, By End Use (2020-2032) (USD Billion)
12.5.2.9 Nigeria
12.5.2.9.1 Nigeria Hyper-Automation Market Estimates And Forecasts, By Component (2020-2032) (USD Billion)
12.5.2.9.2 Nigeria Hyper-Automation Market Estimates And Forecasts, By Deployment (2020-2032) (USD Billion)
12.5.2.9.3 Nigeria Hyper-Automation Market Estimates And Forecasts, By Function (2020-2032) (USD Billion)
12.5.2.9.4 Nigeria Hyper-Automation Market Estimates And Forecasts, By Deployment (2020-2032) (USD Billion)
12.5.2.9.5 Nigeria Hyper-Automation Market Estimates And Forecasts, By End Use (2020-2032) (USD Billion)
12.5.2.10 Rest Of Africa
12.5.2.10.1 Rest Of Africa Hyper-Automation Market Estimates And Forecasts, By Component (2020-2032) (USD Billion)
12.5.2.10.2 Rest Of Africa Hyper-Automation Market Estimates And Forecasts, By Deployment (2020-2032) (USD Billion)
12.5.2.10.3 Rest Of Africa Hyper-Automation Market Estimates And Forecasts, By Function (2020-2032) (USD Billion)
12.5.2.10.4 Rest Of Africa Hyper-Automation Market Estimates And Forecasts, By Deployment (2020-2032) (USD Billion)
12.5.2.10.5 Rest Of Africa Hyper-Automation Market Estimates And Forecasts, By End Use (2020-2032) (USD Billion)
12.6 Latin America
12.6.1 Trends Analysis
12.6.2 Latin America Hyper-Automation Market Estimates And Forecasts, By Country (2020-2032) (USD Billion)
12.6.3 Latin America Hyper-Automation Market Estimates And Forecasts, By Component (2020-2032) (USD Billion)
12.6.4 Latin America Hyper-Automation Market Estimates And Forecasts, By Deployment (2020-2032) (USD Billion)
12.6.5 Latin America Hyper-Automation Market Estimates And Forecasts, By Function (2020-2032) (USD Billion)
12.6.6 Latin America Hyper-Automation Market Estimates And Forecasts, By Deployment (2020-2032) (USD Billion)
12.6.7 Latin America Hyper-Automation Market Estimates And Forecasts, By End Use (2020-2032) (USD Billion)
12.6.8 Brazil
12.6.8.1 Brazil Hyper-Automation Market Estimates And Forecasts, By Component (2020-2032) (USD Billion)
12.6.8.2 Brazil Hyper-Automation Market Estimates And Forecasts, By Deployment (2020-2032) (USD Billion)
12.6.8.3 Brazil Hyper-Automation Market Estimates And Forecasts, By Function (2020-2032) (USD Billion)
12.6.8.4 Brazil Hyper-Automation Market Estimates And Forecasts, By Deployment (2020-2032) (USD Billion)
12.6.8.5 Brazil Hyper-Automation Market Estimates And Forecasts, By End Use (2020-2032) (USD Billion)
12.6.9 Argentina
12.6.9.1 Argentina Hyper-Automation Market Estimates And Forecasts, By Component (2020-2032) (USD Billion)
12.6.9.2 Argentina Hyper-Automation Market Estimates And Forecasts, By Deployment (2020-2032) (USD Billion)
12.6.9.3 Argentina Hyper-Automation Market Estimates And Forecasts, By Function (2020-2032) (USD Billion)
12.6.9.4 Argentina Hyper-Automation Market Estimates And Forecasts, By Deployment (2020-2032) (USD Billion)
12.6.9.5 Argentina Hyper-Automation Market Estimates And Forecasts, By End Use (2020-2032) (USD Billion)
12.6.10 Colombia
12.6.10.1 Colombia Hyper-Automation Market Estimates And Forecasts, By Component (2020-2032) (USD Billion)
12.6.10.2 Colombia Hyper-Automation Market Estimates And Forecasts, By Deployment (2020-2032) (USD Billion)
12.6.10.3 Colombia Hyper-Automation Market Estimates And Forecasts, By Function (2020-2032) (USD Billion)
12.6.10.4 Colombia Hyper-Automation Market Estimates And Forecasts, By Deployment (2020-2032) (USD Billion)
12.6.10.5 Colombia Hyper-Automation Market Estimates And Forecasts, By End Use (2020-2032) (USD Billion)
12.6.11 Rest Of Latin America
12.6.11.1 Rest Of Latin America Hyper-Automation Market Estimates And Forecasts, By Component (2020-2032) (USD Billion)
12.6.11.2 Rest Of Latin America Hyper-Automation Market Estimates And Forecasts, By Deployment (2020-2032) (USD Billion)
12.6.11.3 Rest Of Latin America Hyper-Automation Market Estimates And Forecasts, By Function (2020-2032) (USD Billion)
12.6.11.4 Rest Of Latin America Hyper-Automation Market Estimates And Forecasts, By Deployment (2020-2032) (USD Billion)
12.6.11.5 Rest Of Latin America Hyper-Automation Market Estimates And Forecasts, By End Use (2020-2032) (USD Billion)
13. Company Profiles
13.1 UiPath
13.1.1 Company Overview
13.1.2 Financial
13.1.3 Products/ Services Offered
13.1.4 SWOT Analysis
13.2 Wipro Ltd.
13.2.1 Company Overview
13.2.2 Financial
13.2.3 Products/ Services Offered
13.2.4 SWOT Analysis
13.3 Tata Consultancy Services Ltd.
13.3.1 Company Overview
13.3.2 Financial
13.3.3 Products/ Services Offered
13.3.4 SWOT Analysis
13.4 Mitsubishi Electric Corporation
13.4.1 Company Overview
13.4.2 Financial
13.4.3 Products/ Services Offered
13.4.4 SWOT Analysis
13.5 OneGlobe LLC
13.5.1 Company Overview
13.5.2 Financial
13.5.3 Products/ Services Offered
13.5.4 SWOT Analysis
13.6 SolveXia
13.6.1 Company Overview
13.6.2 Financial
13.6.3 Products/ Services Offered
13.6.4 SWOT Analysis
13.7 Appian
13.7.1 Company Overview
13.7.2 Financial
13.7.3 Products/ Services Offered
13.7.4 SWOT Analysis
13.8 Automation Anywhere Inc.
13.8.1 Company Overview
13.8.2 Financial
13.8.3 Products/ Services Offered
13.8.4 SWOT Analysis
13.9 Allerin Tech Pvt. Ltd.
13.9.1 Company Overview
13.9.2 Financial
13.9.3 Products/ Services Offered
13.9.4 SWOT Analysis
13.10 PagerDuty, Inc.
13.10.1 Company Overview
13.10.2 Financial
13.10.3 Products/ Services Offered
13.10.4 SWOT Analysis
14. Use Cases and Best Practices
15. Conclusion
An accurate research report requires proper strategizing as well as implementation. There are multiple factors involved in the completion of good and accurate research report and selecting the best methodology to compete the research is the toughest part. Since the research reports we provide play a crucial role in any company’s decision-making process, therefore we at SNS Insider always believe that we should choose the best method which gives us results closer to reality. This allows us to reach at a stage wherein we can provide our clients best and accurate investment to output ratio.
Each report that we prepare takes a timeframe of 350-400 business hours for production. Starting from the selection of titles through a couple of in-depth brain storming session to the final QC process before uploading our titles on our website we dedicate around 350 working hours. The titles are selected based on their current market cap and the foreseen CAGR and growth.
The 5 steps process:
Step 1: Secondary Research:
Secondary Research or Desk Research is as the name suggests is a research process wherein, we collect data through the readily available information. In this process we use various paid and unpaid databases which our team has access to and gather data through the same. This includes examining of listed companies’ annual reports, Journals, SEC filling etc. Apart from this our team has access to various associations across the globe across different industries. Lastly, we have exchange relationships with various university as well as individual libraries.

Step 2: Primary Research
When we talk about primary research, it is a type of study in which the researchers collect relevant data samples directly, rather than relying on previously collected data. This type of research is focused on gaining content specific facts that can be sued to solve specific problems. Since the collected data is fresh and first hand therefore it makes the study more accurate and genuine.
We at SNS Insider have divided Primary Research into 2 parts.
Part 1 wherein we interview the KOLs of major players as well as the upcoming ones across various geographic regions. This allows us to have their view over the market scenario and acts as an important tool to come closer to the accurate market numbers. As many as 45 paid and unpaid primary interviews are taken from both the demand and supply side of the industry to make sure we land at an accurate judgement and analysis of the market.
This step involves the triangulation of data wherein our team analyses the interview transcripts, online survey responses and observation of on filed participants. The below mentioned chart should give a better understanding of the part 1 of the primary interview.

Part 2: In this part of primary research the data collected via secondary research and the part 1 of the primary research is validated with the interviews from individual consultants and subject matter experts.
Consultants are those set of people who have at least 12 years of experience and expertise within the industry whereas Subject Matter Experts are those with at least 15 years of experience behind their back within the same space. The data with the help of two main processes i.e., FGDs (Focused Group Discussions) and IDs (Individual Discussions). This gives us a 3rd party nonbiased primary view of the market scenario making it a more dependable one while collation of the data pointers.
Step 3: Data Bank Validation
Once all the information is collected via primary and secondary sources, we run that information for data validation. At our intelligence centre our research heads track a lot of information related to the market which includes the quarterly reports, the daily stock prices, and other relevant information. Our data bank server gets updated every fortnight and that is how the information which we collected using our primary and secondary information is revalidated in real time.

Step 4: QA/QC Process
After all the data collection and validation our team does a final level of quality check and quality assurance to get rid of any unwanted or undesired mistakes. This might include but not limited to getting rid of the any typos, duplication of numbers or missing of any important information. The people involved in this process include technical content writers, research heads and graphics people. Once this process is completed the title gets uploader on our platform for our clients to read it.
Step 5: Final QC/QA Process:
This is the last process and comes when the client has ordered the study. In this process a final QA/QC is done before the study is emailed to the client. Since we believe in giving our clients a good experience of our research studies, therefore, to make sure that we do not lack at our end in any way humanly possible we do a final round of quality check and then dispatch the study to the client.
Key Segments:
By Component
Hardware
Software
Services
By Technology
Robotic Process Automation
Machine Learning
Biometrics
Chatbots
Context Aware Computing
Natural Language Generation
Computer Vision
By Deployment
On-premise
Cloud
By Function
Marketing & Sales
Finance & Accounting
Human Resources
Operations & Supply Chain
Information Technology
By End Use
Manufacturing
Automotive
BFSI
Healthcare
IT & Telecommunication
Retail
Transportation & Logistics
Others
Request for Segment Customization as per your Business Requirement: Segment Customization Request
Regional Coverage:
North America
US
Canada
Mexico
Europe
Eastern Europe
Poland
Romania
Hungary
Turkey
Rest of Eastern Europe
Western Europe
Germany
France
UK
Italy
Spain
Netherlands
Switzerland
Austria
Rest of Western Europe
Asia Pacific
China
India
Japan
South Korea
Vietnam
Singapore
Australia
Rest of Asia Pacific
Middle East & Africa
Middle East
UAE
Egypt
Saudi Arabia
Qatar
Rest of the Middle East
Africa
Nigeria
South Africa
Rest of Africa
Latin America
Brazil
Argentina
Colombia
Rest of Latin America
Request for Country Level Research Report: Country Level Customization Request
Available Customization
With the given market data, SNS Insider offers customization as per the company’s specific needs. The following customization options are available for the report:
Product Analysis
Criss-Cross segment analysis (e.g. Product X Application)
Product Matrix which gives a detailed comparison of the product portfolio of each company
Geographic Analysis
Additional countries in any of the regions
Company Information
Detailed analysis and profiling of additional market players (Up to five)
The Crowdsourced Testing Market size was valued at USD 2.6 Billion in 2023 and will reach USD 6.3 Billion by 2032, growing at a CAGR of 10.4% by 2032.
Gigabit Passive Optical Network Market was valued at USD 6.7 Billion in 2023 and will reach USD 12.9 Million by 2032, growing at a CAGR of 7.49% by 2032.
Data Analytics Outsourcing Market Size was valued at USD 11.49 Billion in 2023 and is expected to reach USD 164.33 Billion by 2032 and grow at a CAGR of 34.43% over the forecast period 2024-2032.
The Data Center As A Service Market was valued at USD 103.4 Billion in 2023 and will reach USD 728.7 Billion by 2032, growing at a CAGR of 24.24% by 2032.
The Sales Gamification Software Market size was valued at USD 13.1 Billion in 2023. It is expected to grow to USD 90.8 Billion by 2032 and grow at a CAGR of 27.4% over the forecast period of 2024-2032.
The Software-defined Wide Area Network Market was valued at USD 5.19 Billion in 2023 and will reach USD 59.41 Billion and CAGR of 31.14% by 2032.

Hi! Click one of our member below to chat on Phone
© 2025 All Rights Reserved by SNS Insider Pvt Ltd


