image

Hydrotherapy Equipment Market Size & Overview:

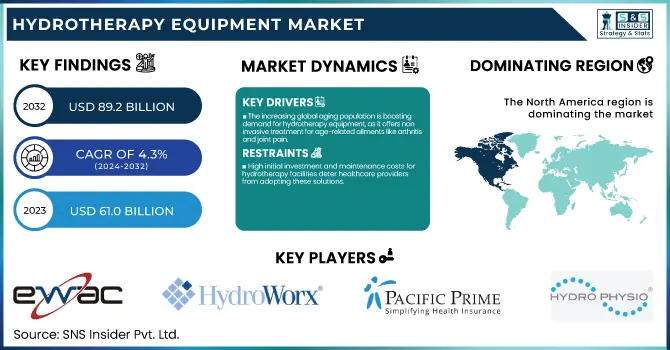
The Hydrotherapy Equipment Market size was valued at USD 61 Billion in 2023 and is expected to reach USD 89.2 billion by 2032, growing at a CAGR of 4.3% over the forecast period 2024-2032.

Hydrotherapy Equipment Market Revenue Analysis

To Get more information on Hydrotherapy Equipment Market - Request Free Sample Report

The Hydrotherapy Equipment Market analysis report also offers valuable information to clients expanding their capabilities in the industry. It provides comprehensive coverage of conditions such as arthritis, musculoskeletal disorders, neurological diseases, and others with a high incidence and prevalence, driving demand for hydrotherapy solutions. The report examines market volumes and potential growth, identifying trends and adoption patterns across various regions. It also considers healthcare spending, government funding, insurance coverage, and out-of-pocket expenses. It also examines adoption rates in hospitals, rehabilitation clinics, and wellness centers. The study examines innovations like hydrotherapy pools fitted with AI and underwater treadmills. The report presents an analysis of regional regulatory compliance, helping prepare companies to meet safety standards and certifications. The global hydrotherapy equipment market is anticipated to witness considerable growth over the upcoming decade, driven by increasing awareness of non-invasive treatments and the rising prevalence of chronic musculoskeletal conditions.

Hydrotherapy Equipment Market Dynamics

Driver

  • The increasing global aging population is boosting demand for hydrotherapy equipment, as it offers non-invasive treatment for age-related ailments like arthritis and joint pain.

One of the major factors driving the growth of the hydrotherapy equipment market is the global aging population, with the rapidly growing number of older adults leading to a greater demand for non-invasive treatment, including hydrotherapy, for diseases such as arthritis and joint pain. In 2024, countries like China, Japan, South Korea, and Italy all recorded falling birth rates and rising life expectancies, resulting in shrinking and aging populations. For instance, China experienced a population decrease of nearly 1.4 million, marking its third consecutive year of decline. This demographic trend is associated with a greater incidence of osteoarthritis, the most prevalent type of arthritis. A 2023 study revealed that 15% of individuals aged 30 and older are affected by osteoarthritis, with projections indicating that nearly 1 billion people will have the condition by 2050. The prevalence of knee osteoarthritis is estimated to increase by 74.9% between 2020 and 2050, and hand osteoarthritis by 48.6%.

In US the adults aged 50–80 years in the United States, 70% reported having joint pain, including 31% who rated their pain moderate and 8% who rated it severe. Among individuals with joint pain, 45% experienced symptoms daily, while nearly half said they were limited in their usual activities. Hydrotherapy has emerged as a non-invasive solution for the treatment of arthritis and joint pain, which is especially appealing to the older population. By relieving pain and increasing mobility in the joints, hydrotherapy improves the lives of older adults, which is further expected to drive the demand for hydrotherapy equipment.

Restraints:

  • High initial investment and maintenance costs for hydrotherapy facilities deter healthcare providers from adopting these solutions.

A major challenge for healthcare providers considering the adoption of hydrotherapy is the high initial investment and maintenance cost for the equipment. Setting up hydrotherapy facilities demands a significant investment, including infrastructure construction, equipment purchase, and personnel training. The design and construction of spaces for hydrotherapy pools and equipment average between $100,000 and $500,000 as equipment installation costs between $50,000 and $100,000. Moreover, acquiring hydrotherapy equipment, underwater treadmills, massage devices, resistance jets, etc., anywhere from $10,000 to $50,000 is another cost involved.

In addition to initial implementation costs, the cost of maintenance also becomes a financial burden for healthcare providers. Regular maintenance is critical for equipment performance and patient safety, with maintenance costs usually accounting for 10% to 15% of the annual budget. For a medium-sized spa, this equates to about $20,000-$30,000 annually. The cost of hydrotherapy equipment can also become prohibitive for smaller clinics and rehabilitation centers, which may prevent them from investing in this helpful type of therapy for patients. In addition, the costs of hydrotherapy chairs can be quite high, from $5,000 to $15,000 depending on model and features, which further limits adoption. Thus, although hydrotherapy has several benefits for the patient, the cost implications in terms of provision and maintenance of the respective equipment is a considerable barrier to the use of hydrotherapy in clinical practice in many countries.

Opportunities:

  • Integrating Internet of Things (IoT) technology into hydrotherapy equipment enables remote monitoring and personalized treatments, enhancing user experience.

The introduction of IoT into hydrotherapy equipment opens a new dimension in patient care with real-time monitoring and personalised therapy. This potential is further underpinned by the rising uptake of IoT-linked medical devices. An Ipsos USA survey shows that 80% of Americans own at least one medical device e.g., smartwatches, smart fitness trackers and 28% have received health alerts from these devices. In fact, 84% said the data was useful, and 76% received an accurate diagnosis when they visited a physician.

The shift towards wearable health technology is evident, with smart rings gaining popularity. Oura, which has specialized in this market, sold over 2.5 million units since it launched in 2015, underscoring the demand for small, continuous health-monitoring devices. This trend shows consumer readiness to adopt health solutions entwined with the IOT. Here are some advanced features that can be implemented through IoT in the Hydrotherapy equipment. Such capabilities can enhance clinical outcomes and patient experience. Additionally, by incorporating wearable technology, clinicians gain access to continuous feedback for assessing patient progress during hydrotherapy sessions, which has significant implications for treatment customization. This trend is indicative of a growing desire for therapeutic and wellness-related solutions that put IoT based hydrotherapy machine equipment at the center of shifting consumer perceptions on connected health services.

Challenges:

  • Limited availability of hydrotherapy equipment in developing regions, due to lack of awareness and infrastructure, hampers market growth.

The limited availability of hydrotherapy equipment in developing regions stems from several interrelated factors. A significant barrier is that the initial investment required to develop hydrotherapy facilities is high. Construction or renovation can cost between $100,000 to $500,000, while equipment installation can cost between $50,000 and $100,000. Buying specialized equipment like underwater treadmills and resistance jets can account for another $10,000 to $50,000 in costs. In addition, the hiring of qualified hydro therapists and support staff is estimated at annual supervision costs between $200,000 and $300,000. These high-cost pressures keep many healthcare providers in developing nations from developing hydrotherapy services.

Infrastructural hurdles also limit the inclusion of hydrotherapy machinery. This was substantiated by a study carried out in a central Indian district, which found only 85.7% of Primary Health Centers (PHCs) had access to improved water sources, and only 28.6% had facilities for rainwater harvesting. In addition, 71.4% of the PHCs did not have the facility of separate sanitation for males and females. Indeed, lack of basic water and sanitation infrastructure complicate the construction and usage of hydrotherapy facilities, which require stable water delivery and high hygiene standards. In addition, there is a significant lack of awareness of hydrotherapy in the healthcare arena as well as the general populace in these areas. Lack of awareness among medical professionals has led to underuse of hydrotherapy perceived as a form of treatment modality. As such, all these factors cumulatively prevent the provision of hydrotherapy equipment especially in developing countries where examples of all he above can be seen.

Hydrotherapy Equipment Market Segmentation Analysis

By Type

The hydrotherapy pools segment held the largest revenue share of 37% in 2023. This significant market share can be attributed to several factors, including the versatility and effectiveness of hydrotherapy pools in treating a wide range of conditions. According to the American Physical Therapy Association (APTA), aquatic therapy in pools can reduce joint compression forces by up to 50-75%, making it an ideal option for patients with arthritis, joint injuries, and other musculoskeletal disorders. According to the U.S. Centers for Disease Control and Prevention (CDC), more than 54 million people in the United States aged 18 and older have doctor-diagnosed arthritis, indicating a possible target market for hydrotherapy water pool therapists. Additionally, hydrotherapy pools provide a conducive environment for rehabilitation, enabling therapists to customize water temperature, depth, and resistance based on specific patient requirements. Hydrotherapy is recommended by the National Institute for Health and Care Excellence (NICE) in the UK as one of the core treatment packages for osteoarthritis, which affects an estimated 8.75 million people in the UK. As a result of its recognition by esteemed health organizations, there has been a growing implementation of hydrotherapy pools across hospitals, rehabilitation centers, and sports establishments. Moreover, enhancements in pool design, including the incorporation of underwater treadmills and resistance jets, have broadened the therapeutic benefits of hydrotherapy pools, thereby reinforcing their leading role in the market.

By Application

The cardiology segment dominated and held the largest revenue share of 32% in 2023. In addition, this large market share is also due to the rising incidence of cardiovascular diseases and the increasing awareness of the benefits of hydrotherapy during cardiac rehabilitation. Cardiovascular diseases are the number one killer worldwide, claiming approximately 17.9 million lives each year World Health Organization 2020. The high prevalence of CAD has compelled patients to seek effective rehabilitation methods, making hydrotherapy a valuable option in cardiac care.

The American Heart Association (AHA) acknowledges the benefits of aquatic exercise as a good type of cardiac rehabilitation, especially in patients with limited ability to exercise on land. Hydrotherapy provides a low-impact environment that limits stress on joints while delivering resistance for cardiovascular conditioning. Cardiac Rehabilitation is a key aspect of recovery, but it is also expensive, costing the United States around $363 billion per year as per the U.S. Centers for Disease Control and Prevention (CDC), making affordable rehabilitation solutions like hydrotherapy essential. Aquatic therapy, which can improve exercise capacity, quality of life, and cardiovascular function, has been shown beneficial in patients with heart failure. For example, A study published in the European Journal of Preventive Cardiology found that hydrotherapy significantly improved peak oxygen uptake and left ventricular function in heart failure patients. This evidence-based effectiveness has resulted in a wider adoption of Hydrotherapy in cardiac rehabilitation programs in healthcare infrastructure, thereby leading to the segment's dominating market position.

By end-use

The spa & wellness centers dominated the market with a 48% share of revenue in 2023. The dominant share in this segment is coupled with high demand for the wellness tourism market and growing awareness of consumers towards the health benefits of hydrotherapy treatments. According to the Global Wellness Institute, the wellness tourism market was valued at $639 billion in 2017 and was projected to reach $919 billion by 2022, with a compound annual growth rate of 7.5%. This rapid growth has led to a surge in the number of spa and wellness centers offering hydrotherapy services.

According to the U.S. Bureau of Labor Statistics, the number of spa establishments in the U.S. rose by 20% from 2012 to 2017, driven by the increasing demand for wellness services. There is a substantial need for hydrotherapy devices, including whirlpools, hot tubs, specialized showers, etc., which are extensively used in these establishments to serve consumers looking for stress relief, pain relief, and wellness. According to the International Spa Association (ISPA), stress relief and relaxation accounted for 47% of reported reasons why people frequented spas, and hydrotherapy treatments are commonly linked to stress relief and relaxation. Moreover, the growing emphasis on preventative care and self-care activities has led to an increase in the number of individuals opting for hydrotherapy services offered by spa and wellness centers, with the segment dominating the market.

Hydrotherapy Equipment Market Reginal Insights

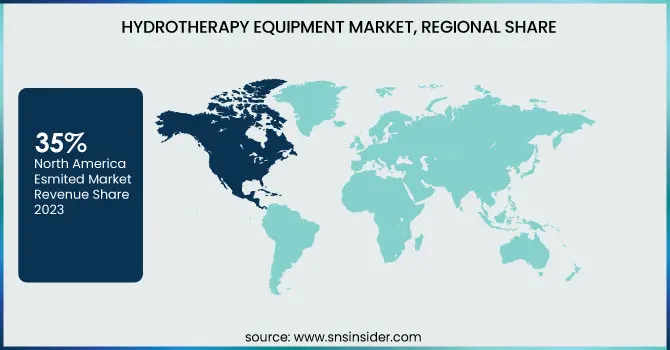
The hydrotherapy equipment market was dominated by North America in 2023 with a revenue share of 35%. This dominance can be ascribed to the presence of sophisticated healthcare infrastructure, high healthcare expenditure, and increasing awareness towards alternative therapies in the region. U.S. healthcare spending was $4.1 trillion in 2020, about 19.7% of the nation’s Gross Domestic Product (GDP), according to the Centers for Medicare & Medicaid Services (CMS). This significant healthcare expenditure has helped to create a widespread infrastructure for advanced hydrotherapy equipment in the organizations.

The Asia-Pacific region is projected to have the highest CAGR during the forecast period, due to rapid urbanization, rising disposable incomes, and growing awareness of healthcare. According to the World Bank, East Asia and the Pacific is also to see 400 million new people living in cities by 2050, which provides an attractive market for the wellness and healthcare industries. According to China Tourism Academy, domestic wellness trips reached 239 million in 2019, a 19% increase from 2018, and the trend has continued to rise in China in particular. Others, including the governments of Japan and South Korea, have focused on the region’s growth by driving preventive healthcare and managing their aging populations. Policies to encourage the practice are already in place in some countries such as Japan, where the Ministry of Health, Labour and Welfare has introduced various provisions aimed at encouraging health tourism, which often involves hydrotherapy treatments. Asia-Pacific is anticipated to be the fastest-growing market for hydrotherapy equipment owing to all these factors coupled with the large population base in the region and rising healthcare expenditure.

Hydrotherapy-Equipment-Market-Regional-Share

Get Customized Report as per Your Business Requirement - Enquiry Now

Key Players in Hydrotherapy Equipment Market

Key Service Providers/Manufacturers

  • EWAC (Movable Swimming Pool Floors, Underwater Treadmills)

  • HYDROWORX (HydroWorx RISE Modular Hydrotherapy System)

  • Prime Pacific Health Innovations Corporation (Aquanet EC-2000, Aquanet APS-100)

  • Hydro Physio (Hydrotherapy Systems for Rehabilitation)

  • Sidmar Manufacturing, Inc. (Hydrotherapy Massage Tables)

  • SwimEx Inc (SwimEx 1000 T Pool, SwimEx 500 S Pool)

  • Kohler Co (Kohler Walk-In Bath, Kohler Hydrotherapy Whirlpool Tubs)

  • RMS, Co. (Hydrotherapy Tanks, Whirlpool Baths)

  • Narang Medical Limited (Hydrotherapy Tanks, Physiotherapy Equipment)

  • Jacuzzi Inc. (Hot Tubs, Whirlpool Baths)

  • Accord Medical Products (Hydrotherapy Tanks, Rehabilitation Equipment)

  • Lojer (Manuthera 242 Treatment Table, Capre Treatment Table)

  • Vacuactivus (CryoStar Antarctica Cryotherapy Chamber, InfraStar Bike)

  • Desco Medical India (Hydrotherapy Tanks, Hydrotherapy Accessories)

  • HoMedics (Shiatsu Bliss Footbath with Heat Boost, Bubble Mate Foot Spa)

  • Conair (Foot Spa with Vibration)

  • Ivation (Foot Spa Massager)

  • Beinilai (Collapsible Pedicure Foot Spa)

  • Holmatro (Hydraulic Rescue Equipment)

  • HydroWorx (HydroWorx 2000 Series, HydroWorx 3500 Series)

Recent Developments

  • In June 2024, HydroWorx, a leading home manufacturer of aquatic therapy products, released a new line of portable hydrotherapy pools designed for home use. This revolutionary solution meets the rising need for rehabilitation services at home, driven by the trend toward care at home.

  • In September 2024, Jacuzzi Brands LLC announced its partnership with a prominent hospital chain to facilitate the application of smart hydrotherapy systems within their rehabilitation departments. The purpose of this joint venture is to improve patient outcomes through individualized hydrotherapy treatments and data-driven therapy protocols.

Hydrotherapy Equipment Market Report Scope

Report Attributes Details
Market Size in 2023 USD 61 Billion 
Market Size by 2032 USD 89.2 Billion 
CAGR CAGR of 4.3% From 2024 to 2032
Base Year 2023
Forecast Period 2024-2032
Historical Data 2020-2022
Report Scope & Coverage Market Size, Segments Analysis, Competitive Landscape, Regional Analysis, DROC & SWOT Analysis, Forecast Outlook
Key Segments • By Type (Chambers/Tanks, Underwater Treadmill, Hydrotherapy Pools, Hydrotherapy Tub/Bath, Others)
• By Application (Cardiology, Pain Management, Dermatology, Others)
• By End Use (Hospitals & Rehabilitation Centers, Spa & Wellness Centers, Others)
Regional Analysis/Coverage North America (US, Canada, Mexico), Europe (Eastern Europe [Poland, Romania, Hungary, Turkey, Rest of Eastern Europe] Western Europe] Germany, France, UK, Italy, Spain, Netherlands, Switzerland, Austria, Rest of Western Europe]), Asia Pacific (China, India, Japan, South Korea, Vietnam, Singapore, Australia, Rest of Asia Pacific), Middle East & Africa (Middle East [UAE, Egypt, Saudi Arabia, Qatar, Rest of Middle East], Africa [Nigeria, South Africa, Rest of Africa], Latin America (Brazil, Argentina, Colombia, Rest of Latin America)
Company Profiles EWAC, HYDROWORX, Prime Pacific Health Innovations Corporation, Hydro Physio, Sidmar Manufacturing Inc., SwimEx Inc., Kohler Co., RMS Co., Narang Medical Limited, Jacuzzi Inc., Accord Medical Products, Lojer, Vacuactivus, Desco Medical India, HoMedics, Conair, Ivation, Beinilai, Holmatro, HydroWorx

Frequently Asked Questions

Ans. The projected market size for the Hydrotherapy Equipment Market is USD 89.2 billion by 2032.

Ans: The North American region dominated the Hydrotherapy Equipment Market in 2023.

Ans. The CAGR of the Hydrotherapy Equipment Market is 4.3% during the forecast period of 2024-2032.

Ans:  

  • The increasing global aging population is boosting demand for hydrotherapy equipment, as it offers non-invasive treatment for age-related ailments like arthritis and joint pain.

Ans:  The spa & wellness centers segment dominated the Hydrotherapy Equipment Market.

Table of Contents

1. Introduction

1.1 Market Definition

1.2 Scope (Inclusion and Exclusions)

1.3 Research Assumptions

2. Executive Summary

2.1 Market Overview

2.2 Regional Synopsis

2.3 Competitive Summary

3. Research Methodology

3.1 Top-Down Approach

3.2 Bottom-up Approach

3.3. Data Validation

3.4 Primary Interviews

4. Market Dynamics Impact Analysis

4.1 Market Driving Factors Analysis

4.1.1 Drivers

4.1.2 Restraints

4.1.3 Opportunities

4.1.4 Challenges

4.2 PESTLE Analysis

4.3 Porter’s Five Forces Model

5. Statistical Insights and Trends Reporting

5.1 Incidence and Prevalence of Conditions Treated with Hydrotherapy (2023)

5.2 Healthcare Spending on Hydrotherapy (2023)

5.3 Adoption Rates in Rehabilitation and Wellness Centers (2023)

5.4 Technological Advancements and Feature Adoption (2023)

6. Competitive Landscape

6.1 List of Major Companies, By Region

6.2 Market Share Analysis, By Region

6.3 Product Benchmarking

6.3.1 Product specifications and features

6.3.2 Pricing

6.4 Strategic Initiatives

6.4.1 Marketing and promotional activities

6.4.2 Distribution and Supply Chain Strategies

6.4.3 Expansion plans and new product launches

6.4.4 Strategic partnerships and collaborations

6.5 Technological Advancements

6.6 Market Positioning and Branding

7. Hydrotherapy Equipment Market Segmentation, By Type

7.1 Chapter Overview

7.2 Chambers/Tanks

7.2.1 Chambers/Tanks Market Trends Analysis (2020-2032)

7.2.2 Chambers/Tanks Market Size Estimates and Forecasts to 2032 (USD Billion)

7.3 Underwater Treadmill

7.3.1 Underwater Treadmill Market Trends Analysis (2020-2032)

7.3.2 Underwater Treadmill Market Size Estimates and Forecasts to 2032 (USD Billion)

7.4 Hydrotherapy Pools

7.4.1 Hydrotherapy Pools Market Trends Analysis (2020-2032)

7.4.2 Hydrotherapy Pools Market Size Estimates and Forecasts to 2032 (USD Billion)

7.5 Hydrotherapy Tub/Bath

7.5.1 Hydrotherapy Tub/Bath Market Trends Analysis (2020-2032)

7.5.2 Hydrotherapy Tub/Bath Market Size Estimates and Forecasts to 2032 (USD Billion)

7.6 Others

7.6.1 Others Market Trends Analysis (2020-2032)

7.6.2 Others Market Size Estimates and Forecasts to 2032 (USD Billion)

8. Hydrotherapy Equipment Market Segmentation, By Application

8.1 Chapter Overview

8.2 Cardiology

8.2.1 Cardiology Market Trends Analysis (2020-2032)

8.2.2 Cardiology Market Size Estimates and Forecasts to 2032 (USD Billion)

8.3 Pain Management

8.3.1 Pain Management Market Trends Analysis (2020-2032)

8.3.2 Pain Management Market Size Estimates and Forecasts to 2032 (USD Billion)

8.4 Dermatology

8.4.1 Dermatology Market Trends Analysis (2020-2032)

8.4.2 Dermatology Market Size Estimates and Forecasts to 2032 (USD Billion)

8.5 Others

8.5.1 Others Market Trends Analysis (2020-2032)

8.5.2 Others Market Size Estimates and Forecasts to 2032 (USD Billion)

9. Hydrotherapy Equipment Market Segmentation, By End-Use

9.1 Chapter Overview

9.2 Hospitals & Rehabilitation Centers

9.2.1 Hospitals & Rehabilitation Centers Market Trends Analysis (2020-2032)

9.2.2 Hospitals & Rehabilitation Centers Market Size Estimates and Forecasts to 2032 (USD Billion)

9.3 Spa & Wellness Centers

9.3.1 Spa & Wellness Centers Market Trends Analysis (2020-2032)

9.3.2 Spa & Wellness Centers Market Size Estimates and Forecasts to 2032 (USD Billion)

9.5 Others

9.4.1 Others Market Trends Analysis (2020-2032)

9.4.2 Others Market Size Estimates and Forecasts to 2032 (USD Billion)

10. Regional Analysis

10.1 Chapter Overview

10.2 North America

10.2.1 Trends Analysis

10.2.2 North America Hydrotherapy Equipment Market Estimates and Forecasts, by Country (2020-2032) (USD Billion)

10.2.3 North America Hydrotherapy Equipment Market Estimates and Forecasts, By Type (2020-2032) (USD Billion) 

10.2.4 North America Hydrotherapy Equipment Market Estimates and Forecasts, By Application (2020-2032) (USD Billion)

10.2.5 North America Hydrotherapy Equipment Market Estimates and Forecasts, By End-Use (2020-2032) (USD Billion)

10.2.6 USA

10.2.6.1 USA Hydrotherapy Equipment Market Estimates and Forecasts, By Type (2020-2032) (USD Billion)

10.2.6.2 USA Hydrotherapy Equipment Market Estimates and Forecasts, By Application (2020-2032) (USD Billion)

10.2.6.3 USA Hydrotherapy Equipment Market Estimates and Forecasts, By End-Use (2020-2032) (USD Billion)

10.2.7 Canada

10.2.7.1 Canada Hydrotherapy Equipment Market Estimates and Forecasts, By Type (2020-2032) (USD Billion)

10.2.7.2 Canada Hydrotherapy Equipment Market Estimates and Forecasts, By Application (2020-2032) (USD Billion)

10.2.7.3 Canada Hydrotherapy Equipment Market Estimates and Forecasts, By End-Use (2020-2032) (USD Billion)

10.2.8 Mexico

10.2.8.1 Mexico Hydrotherapy Equipment Market Estimates and Forecasts, By Type (2020-2032) (USD Billion)

10.2.8.2 Mexico Hydrotherapy Equipment Market Estimates and Forecasts, By Application (2020-2032) (USD Billion)

10.2.8.3 Mexico Hydrotherapy Equipment Market Estimates and Forecasts, By End-Use (2020-2032) (USD Billion)

10.3 Europe

10.3.1 Eastern Europe

10.3.1.1 Trends Analysis

10.3.1.2 Eastern Europe Hydrotherapy Equipment Market Estimates and Forecasts, by Country (2020-2032) (USD Billion)

10.3.1.3 Eastern Europe Hydrotherapy Equipment Market Estimates and Forecasts, By Type (2020-2032) (USD Billion) 

10.3.1.4 Eastern Europe Hydrotherapy Equipment Market Estimates and Forecasts, By Application (2020-2032) (USD Billion)

10.3.1.5 Eastern Europe Hydrotherapy Equipment Market Estimates and Forecasts, By End-Use (2020-2032) (USD Billion)

10.3.1.6 Poland

10.3.1.6.1 Poland Hydrotherapy Equipment Market Estimates and Forecasts, By Type (2020-2032) (USD Billion)

10.3.1.6.2 Poland Hydrotherapy Equipment Market Estimates and Forecasts, By Application (2020-2032) (USD Billion)

10.3.1.6.3 Poland Hydrotherapy Equipment Market Estimates and Forecasts, By End-Use (2020-2032) (USD Billion)

10.3.1.7 Romania

10.3.1.7.1 Romania Hydrotherapy Equipment Market Estimates and Forecasts, By Type (2020-2032) (USD Billion)

10.3.1.7.2 Romania Hydrotherapy Equipment Market Estimates and Forecasts, By Application (2020-2032) (USD Billion)

10.3.1.7.3 Romania Hydrotherapy Equipment Market Estimates and Forecasts, By End-Use (2020-2032) (USD Billion)

10.3.1.8 Hungary

10.3.1.8.1 Hungary Hydrotherapy Equipment Market Estimates and Forecasts, By Type (2020-2032) (USD Billion)

10.3.1.8.2 Hungary Hydrotherapy Equipment Market Estimates and Forecasts, By Application (2020-2032) (USD Billion)

10.3.1.8.3 Hungary Hydrotherapy Equipment Market Estimates and Forecasts, By End-Use (2020-2032) (USD Billion)

10.3.1.9 Turkey

10.3.1.9.1 Turkey Hydrotherapy Equipment Market Estimates and Forecasts, By Type (2020-2032) (USD Billion)

10.3.1.9.2 Turkey Hydrotherapy Equipment Market Estimates and Forecasts, By Application (2020-2032) (USD Billion)

10.3.1.9.3 Turkey Hydrotherapy Equipment Market Estimates and Forecasts, By End-Use (2020-2032) (USD Billion)

10.3.1.10 Rest of Eastern Europe

10.3.1.10.1 Rest of Eastern Europe Hydrotherapy Equipment Market Estimates and Forecasts, By Type (2020-2032) (USD Billion)

10.3.1.10.2 Rest of Eastern Europe Hydrotherapy Equipment Market Estimates and Forecasts, By Application (2020-2032) (USD Billion)

10.3.1.10.3 Rest of Eastern Europe Hydrotherapy Equipment Market Estimates and Forecasts, By End-Use (2020-2032) (USD Billion)

10.3.2 Western Europe

10.3.2.1 Trends Analysis

10.3.2.2 Western Europe Hydrotherapy Equipment Market Estimates and Forecasts, by Country (2020-2032) (USD Billion)

10.3.2.3 Western Europe Hydrotherapy Equipment Market Estimates and Forecasts, By Type (2020-2032) (USD Billion) 

10.3.2.4 Western Europe Hydrotherapy Equipment Market Estimates and Forecasts, By Application (2020-2032) (USD Billion)

10.3.2.5 Western Europe Hydrotherapy Equipment Market Estimates and Forecasts, By End-Use (2020-2032) (USD Billion)

10.3.2.6 Germany

10.3.2.6.1 Germany Hydrotherapy Equipment Market Estimates and Forecasts, By Type (2020-2032) (USD Billion)

10.3.2.6.2 Germany Hydrotherapy Equipment Market Estimates and Forecasts, By Application (2020-2032) (USD Billion)

10.3.2.6.3 Germany Hydrotherapy Equipment Market Estimates and Forecasts, By End-Use (2020-2032) (USD Billion)

10.3.2.7 France

10.3.2.7.1 France Hydrotherapy Equipment Market Estimates and Forecasts, By Type (2020-2032) (USD Billion)

10.3.2.7.2 France Hydrotherapy Equipment Market Estimates and Forecasts, By Application (2020-2032) (USD Billion)

10.3.2.7.3 France Hydrotherapy Equipment Market Estimates and Forecasts, By End-Use (2020-2032) (USD Billion)

10.3.2.8 UK

10.3.2.8.1 UK Hydrotherapy Equipment Market Estimates and Forecasts, By Type (2020-2032) (USD Billion)

10.3.2.8.2 UK Hydrotherapy Equipment Market Estimates and Forecasts, By Application (2020-2032) (USD Billion)

10.3.2.8.3 UK Hydrotherapy Equipment Market Estimates and Forecasts, By End-Use (2020-2032) (USD Billion)

10.3.2.9 Italy

10.3.2.9.1 Italy Hydrotherapy Equipment Market Estimates and Forecasts, By Type (2020-2032) (USD Billion)

10.3.2.9.2 Italy Hydrotherapy Equipment Market Estimates and Forecasts, By Application (2020-2032) (USD Billion)

10.3.2.9.3 Italy Hydrotherapy Equipment Market Estimates and Forecasts, By End-Use (2020-2032) (USD Billion)

10.3.2.10 Spain

10.3.2.10.1 Spain Hydrotherapy Equipment Market Estimates and Forecasts, By Type (2020-2032) (USD Billion)

10.3.2.10.2 Spain Hydrotherapy Equipment Market Estimates and Forecasts, By Application (2020-2032) (USD Billion)

10.3.2.10.3 Spain Hydrotherapy Equipment Market Estimates and Forecasts, By End-Use (2020-2032) (USD Billion)

10.3.2.11 Netherlands

10.3.2.11.1 Netherlands Hydrotherapy Equipment Market Estimates and Forecasts, By Type (2020-2032) (USD Billion)

10.3.2.11.2 Netherlands Hydrotherapy Equipment Market Estimates and Forecasts, By Application (2020-2032) (USD Billion)

10.3.2.11.3 Netherlands Hydrotherapy Equipment Market Estimates and Forecasts, By End-Use (2020-2032) (USD Billion)

10.3.2.12 Switzerland

10.3.2.12.1 Switzerland Hydrotherapy Equipment Market Estimates and Forecasts, By Type (2020-2032) (USD Billion)

10.3.2.12.2 Switzerland Hydrotherapy Equipment Market Estimates and Forecasts, By Application (2020-2032) (USD Billion)

10.3.2.12.3 Switzerland Hydrotherapy Equipment Market Estimates and Forecasts, By End-Use (2020-2032) (USD Billion)

10.3.2.13 Austria

10.3.2.13.1 Austria Hydrotherapy Equipment Market Estimates and Forecasts, By Type (2020-2032) (USD Billion)

10.3.2.13.2 Austria Hydrotherapy Equipment Market Estimates and Forecasts, By Application (2020-2032) (USD Billion)

10.3.2.13.3 Austria Hydrotherapy Equipment Market Estimates and Forecasts, By End-Use (2020-2032) (USD Billion)

10.3.2.14 Rest of Western Europe

10.3.2.14.1 Rest of Western Europe Hydrotherapy Equipment Market Estimates and Forecasts, By Type (2020-2032) (USD Billion)

10.3.2.14.2 Rest of Western Europe Hydrotherapy Equipment Market Estimates and Forecasts, By Application (2020-2032) (USD Billion)

10.3.2.14.3 Rest of Western Europe Hydrotherapy Equipment Market Estimates and Forecasts, By End-Use (2020-2032) (USD Billion)

10.4 Asia Pacific

10.4.1 Trends Analysis

10.4.2 Asia Pacific Hydrotherapy Equipment Market Estimates and Forecasts, by Country (2020-2032) (USD Billion)

10.4.3 Asia Pacific Hydrotherapy Equipment Market Estimates and Forecasts, By Type (2020-2032) (USD Billion) 

10.4.4 Asia Pacific Hydrotherapy Equipment Market Estimates and Forecasts, By Application (2020-2032) (USD Billion)

10.4.5 Asia Pacific Hydrotherapy Equipment Market Estimates and Forecasts, By End-Use (2020-2032) (USD Billion)

10.4.6 China

10.4.6.1 China Hydrotherapy Equipment Market Estimates and Forecasts, By Type (2020-2032) (USD Billion)

10.4.6.2 China Hydrotherapy Equipment Market Estimates and Forecasts, By Application (2020-2032) (USD Billion)

10.4.6.3 China Hydrotherapy Equipment Market Estimates and Forecasts, By End-Use (2020-2032) (USD Billion)

10.4.7 India

10.4.7.1 India Hydrotherapy Equipment Market Estimates and Forecasts, By Type (2020-2032) (USD Billion)

10.4.7.2 India Hydrotherapy Equipment Market Estimates and Forecasts, By Application (2020-2032) (USD Billion)

10.4.7.3 India Hydrotherapy Equipment Market Estimates and Forecasts, By End-Use (2020-2032) (USD Billion)

10.4.8 Japan

10.4.8.1 Japan Hydrotherapy Equipment Market Estimates and Forecasts, By Type (2020-2032) (USD Billion)

10.4.8.2 Japan Hydrotherapy Equipment Market Estimates and Forecasts, By Application (2020-2032) (USD Billion)

10.4.8.3 Japan Hydrotherapy Equipment Market Estimates and Forecasts, By End-Use (2020-2032) (USD Billion)

10.4.9 South Korea

10.4.9.1 South Korea Hydrotherapy Equipment Market Estimates and Forecasts, By Type (2020-2032) (USD Billion)

10.4.9.2 South Korea Hydrotherapy Equipment Market Estimates and Forecasts, By Application (2020-2032) (USD Billion)

10.4.9.3 South Korea Hydrotherapy Equipment Market Estimates and Forecasts, By End-Use (2020-2032) (USD Billion)

10.4.10 Vietnam

10.4.10.1 Vietnam Hydrotherapy Equipment Market Estimates and Forecasts, By Type (2020-2032) (USD Billion)

10.4.10.2 Vietnam Hydrotherapy Equipment Market Estimates and Forecasts, By Application (2020-2032) (USD Billion)

10.4.10.3 Vietnam Hydrotherapy Equipment Market Estimates and Forecasts, By End-Use (2020-2032) (USD Billion)

10.4.11 Singapore

10.4.11.1 Singapore Hydrotherapy Equipment Market Estimates and Forecasts, By Type (2020-2032) (USD Billion)

10.4.11.2 Singapore Hydrotherapy Equipment Market Estimates and Forecasts, By Application (2020-2032) (USD Billion)

10.4.11.3 Singapore Hydrotherapy Equipment Market Estimates and Forecasts, By End-Use (2020-2032) (USD Billion)

10.4.12 Australia

10.4.12.1 Australia Hydrotherapy Equipment Market Estimates and Forecasts, By Type (2020-2032) (USD Billion)

10.4.12.2 Australia Hydrotherapy Equipment Market Estimates and Forecasts, By Application (2020-2032) (USD Billion)

10.4.12.3 Australia Hydrotherapy Equipment Market Estimates and Forecasts, By End-Use (2020-2032) (USD Billion)

10.4.13 Rest of Asia Pacific

10.4.13.1 Rest of Asia Pacific Hydrotherapy Equipment Market Estimates and Forecasts, By Type (2020-2032) (USD Billion)

10.4.13.2 Rest of Asia Pacific Hydrotherapy Equipment Market Estimates and Forecasts, By Application (2020-2032) (USD Billion)

10.4.13.3 Rest of Asia Pacific Hydrotherapy Equipment Market Estimates and Forecasts, By End-Use (2020-2032) (USD Billion)

10.5 Middle East and Africa

10.5.1 Middle East

10.5.1.1 Trends Analysis

10.5.1.2 Middle East Hydrotherapy Equipment Market Estimates and Forecasts, by Country (2020-2032) (USD Billion)

10.5.1.3 Middle East Hydrotherapy Equipment Market Estimates and Forecasts, By Type (2020-2032) (USD Billion) 

10.5.1.4 Middle East Hydrotherapy Equipment Market Estimates and Forecasts, By Application (2020-2032) (USD Billion)

10.5.1.5 Middle East Hydrotherapy Equipment Market Estimates and Forecasts, By End-Use (2020-2032) (USD Billion)

10.5.1.6 UAE

10.5.1.6.1 UAE Hydrotherapy Equipment Market Estimates and Forecasts, By Type (2020-2032) (USD Billion)

10.5.1.6.2 UAE Hydrotherapy Equipment Market Estimates and Forecasts, By Application (2020-2032) (USD Billion)

10.5.1.6.3 UAE Hydrotherapy Equipment Market Estimates and Forecasts, By End-Use (2020-2032) (USD Billion)

10.5.1.7 Egypt

10.5.1.7.1 Egypt Hydrotherapy Equipment Market Estimates and Forecasts, By Type (2020-2032) (USD Billion)

10.5.1.7.2 Egypt Hydrotherapy Equipment Market Estimates and Forecasts, By Application (2020-2032) (USD Billion)

10.5.1.7.3 Egypt Hydrotherapy Equipment Market Estimates and Forecasts, By End-Use (2020-2032) (USD Billion)

10.5.1.8 Saudi Arabia

10.5.1.8.1 Saudi Arabia Hydrotherapy Equipment Market Estimates and Forecasts, By Type (2020-2032) (USD Billion)

10.5.1.8.2 Saudi Arabia Hydrotherapy Equipment Market Estimates and Forecasts, By Application (2020-2032) (USD Billion)

10.5.1.8.3 Saudi Arabia Hydrotherapy Equipment Market Estimates and Forecasts, By End-Use (2020-2032) (USD Billion)

10.5.1.9 Qatar

10.5.1.9.1 Qatar Hydrotherapy Equipment Market Estimates and Forecasts, By Type (2020-2032) (USD Billion)

10.5.1.9.2 Qatar Hydrotherapy Equipment Market Estimates and Forecasts, By Application (2020-2032) (USD Billion)

10.5.1.9.3 Qatar Hydrotherapy Equipment Market Estimates and Forecasts, By End-Use (2020-2032) (USD Billion)

10.5.1.10 Rest of Middle East

10.5.1.10.1 Rest of Middle East Hydrotherapy Equipment Market Estimates and Forecasts, By Type (2020-2032) (USD Billion)

10.5.1.10.2 Rest of Middle East Hydrotherapy Equipment Market Estimates and Forecasts, By Application (2020-2032) (USD Billion)

10.5.1.10.3 Rest of Middle East Hydrotherapy Equipment Market Estimates and Forecasts, By End-Use (2020-2032) (USD Billion)

10.5.2 Africa

10.5.2.1 Trends Analysis

10.5.2.2 Africa Hydrotherapy Equipment Market Estimates and Forecasts, by Country (2020-2032) (USD Billion)

10.5.2.3 Africa Hydrotherapy Equipment Market Estimates and Forecasts, By Type (2020-2032) (USD Billion) 

10.5.2.4 Africa Hydrotherapy Equipment Market Estimates and Forecasts, By Application (2020-2032) (USD Billion)

10.5.2.5 Africa Hydrotherapy Equipment Market Estimates and Forecasts, By End-Use (2020-2032) (USD Billion)

10.5.2.6 South Africa

10.5.2.6.1 South Africa Hydrotherapy Equipment Market Estimates and Forecasts, By Type (2020-2032) (USD Billion)

10.5.2.6.2 South Africa Hydrotherapy Equipment Market Estimates and Forecasts, By Application (2020-2032) (USD Billion)

10.5.2.6.3 South Africa Hydrotherapy Equipment Market Estimates and Forecasts, By End-Use (2020-2032) (USD Billion)

10.5.2.7 Nigeria

10.5.2.7.1 Nigeria Hydrotherapy Equipment Market Estimates and Forecasts, By Type (2020-2032) (USD Billion)

10.5.2.7.2 Nigeria Hydrotherapy Equipment Market Estimates and Forecasts, By Application (2020-2032) (USD Billion)

10.5.2.7.3 Nigeria Hydrotherapy Equipment Market Estimates and Forecasts, By End-Use (2020-2032) (USD Billion)

10.5.2.8 Rest of Africa

10.5.2.8.1 Rest of Africa Hydrotherapy Equipment Market Estimates and Forecasts, By Type (2020-2032) (USD Billion)

10.5.2.8.2 Rest of Africa Hydrotherapy Equipment Market Estimates and Forecasts, By Application (2020-2032) (USD Billion)

10.5.2.8.3 Rest of Africa Hydrotherapy Equipment Market Estimates and Forecasts, By End-Use (2020-2032) (USD Billion)

10.6 Latin America

10.6.1 Trends Analysis

10.6.2 Latin America Hydrotherapy Equipment Market Estimates and Forecasts, by Country (2020-2032) (USD Billion)

10.6.3 Latin America Hydrotherapy Equipment Market Estimates and Forecasts, By Type (2020-2032) (USD Billion) 

10.6.4 Latin America Hydrotherapy Equipment Market Estimates and Forecasts, By Application (2020-2032) (USD Billion)

10.6.5 Latin America Hydrotherapy Equipment Market Estimates and Forecasts, By End-Use (2020-2032) (USD Billion)

10.6.6 Brazil

10.6.6.1 Brazil Hydrotherapy Equipment Market Estimates and Forecasts, By Type (2020-2032) (USD Billion)

10.6.6.2 Brazil Hydrotherapy Equipment Market Estimates and Forecasts, By Application (2020-2032) (USD Billion)

10.6.6.3 Brazil Hydrotherapy Equipment Market Estimates and Forecasts, By End-Use (2020-2032) (USD Billion)

10.6.7 Argentina

10.6.7.1 Argentina Hydrotherapy Equipment Market Estimates and Forecasts, By Type (2020-2032) (USD Billion)

10.6.7.2 Argentina Hydrotherapy Equipment Market Estimates and Forecasts, By Application (2020-2032) (USD Billion)

10.6.7.3 Argentina Hydrotherapy Equipment Market Estimates and Forecasts, By End-Use (2020-2032) (USD Billion)

10.6.8 Colombia

10.6.8.1 Colombia Hydrotherapy Equipment Market Estimates and Forecasts, By Type (2020-2032) (USD Billion)

10.6.8.2 Colombia Hydrotherapy Equipment Market Estimates and Forecasts, By Application (2020-2032) (USD Billion)

10.6.8.3 Colombia Hydrotherapy Equipment Market Estimates and Forecasts, By End-Use (2020-2032) (USD Billion)

10.6.9 Rest of Latin America

10.6.9.1 Rest of Latin America Hydrotherapy Equipment Market Estimates and Forecasts, By Type (2020-2032) (USD Billion)

10.6.9.2 Rest of Latin America Hydrotherapy Equipment Market Estimates and Forecasts, By Application (2020-2032) (USD Billion)

10.6.9.3 Rest of Latin America Hydrotherapy Equipment Market Estimates and Forecasts, By End-Use (2020-2032) (USD Billion)

11. Company Profiles

11.1 EWAC

11.1.1 Company Overview

11.1.2 Financial

11.1.3 Products/ Services Offered

11.1.4 SWOT Analysis

11.2 HYDROWORX

11.2.1 Company Overview

11.2.2 Financial

11.2.3 Products/ Services Offered

11.2.4 SWOT Analysis

11.3 Prime Pacific Health Innovations Corporation

11.3.1 Company Overview

11.3.2 Financial

11.3.3 Products/ Services Offered

11.3.4 SWOT Analysis

11.4 Hydro Physio

11.4.1 Company Overview

11.4.2 Financial

11.4.3 Products/ Services Offered

11.4.4 SWOT Analysis

11.5 Sidmar Manufacturing Inc.

11.5.1 Company Overview

11.5.2 Financial

11.5.3 Products/ Services Offered

11.5.4 SWOT Analysis

11.6 SwimEx Inc.

11.6.1 Company Overview

11.6.2 Financial

11.6.3 Products/ Services Offered

11.6.4 SWOT Analysis

11.7 Kohler Co.

11.7.1 Company Overview

11.7.2 Financial

11.7.3 Products/ Services Offered

11.7.4 SWOT Analysis

11.8 RMS Co.

11.8.1 Company Overview

11.8.2 Financial

11.8.3 Products/ Services Offered

11.8.4 SWOT Analysis

11.9 Narang Medical Limited

11.9.1 Company Overview

11.9.2 Financial

11.9.3 Products/ Services Offered

11.9.4 SWOT Analysis

11.10 Jacuzzi Inc.

11.10.1 Company Overview

11.10.2 Financial

11.10.3 Products/ Services Offered

11.10.4 SWOT Analysis

12. Use Cases and Best Practices

13. Conclusion

An accurate research report requires proper strategizing as well as implementation. There are multiple factors involved in the completion of good and accurate research report and selecting the best methodology to compete the research is the toughest part. Since the research reports we provide play a crucial role in any company’s decision-making process, therefore we at SNS Insider always believe that we should choose the best method which gives us results closer to reality. This allows us to reach at a stage wherein we can provide our clients best and accurate investment to output ratio.

Each report that we prepare takes a timeframe of 350-400 business hours for production. Starting from the selection of titles through a couple of in-depth brain storming session to the final QC process before uploading our titles on our website we dedicate around 350 working hours. The titles are selected based on their current market cap and the foreseen CAGR and growth.


The 5 steps process:

Step 1: Secondary Research:

Secondary Research or Desk Research is as the name suggests is a research process wherein, we collect data through the readily available information. In this process we use various paid and unpaid databases which our team has access to and gather data through the same. This includes examining of listed companies’ annual reports, Journals, SEC filling etc. Apart from this our team has access to various associations across the globe across different industries. Lastly, we have exchange relationships with various university as well as individual libraries.

Secondary Research

Step 2: Primary Research

When we talk about primary research, it is a type of study in which the researchers collect relevant data samples directly, rather than relying on previously collected data.  This type of research is focused on gaining content specific facts that can be sued to solve specific problems. Since the collected data is fresh and first hand therefore it makes the study more accurate and genuine.

We at SNS Insider have divided Primary Research into 2 parts.

Part 1 wherein we interview the KOLs of major players as well as the upcoming ones across various geographic regions. This allows us to have their view over the market scenario and acts as an important tool to come closer to the accurate market numbers. As many as 45 paid and unpaid primary interviews are taken from both the demand and supply side of the industry to make sure we land at an accurate judgement and analysis of the market.

This step involves the triangulation of data wherein our team analyses the interview transcripts, online survey responses and observation of on filed participants. The below mentioned chart should give a better understanding of the part 1 of the primary interview.

Primary Research

Part 2: In this part of primary research the data collected via secondary research and the part 1 of the primary research is validated with the interviews from individual consultants and subject matter experts.

Consultants are those set of people who have at least 12 years of experience and expertise within the industry whereas Subject Matter Experts are those with at least 15 years of experience behind their back within the same space. The data with the help of two main processes i.e., FGDs (Focused Group Discussions) and IDs (Individual Discussions). This gives us a 3rd party nonbiased primary view of the market scenario making it a more dependable one while collation of the data pointers.

Step 3: Data Bank Validation

Once all the information is collected via primary and secondary sources, we run that information for data validation. At our intelligence centre our research heads track a lot of information related to the market which includes the quarterly reports, the daily stock prices, and other relevant information. Our data bank server gets updated every fortnight and that is how the information which we collected using our primary and secondary information is revalidated in real time.

Data Bank Validation

Step 4: QA/QC Process

After all the data collection and validation our team does a final level of quality check and quality assurance to get rid of any unwanted or undesired mistakes. This might include but not limited to getting rid of the any typos, duplication of numbers or missing of any important information. The people involved in this process include technical content writers, research heads and graphics people. Once this process is completed the title gets uploader on our platform for our clients to read it.

Step 5: Final QC/QA Process:

This is the last process and comes when the client has ordered the study. In this process a final QA/QC is done before the study is emailed to the client. Since we believe in giving our clients a good experience of our research studies, therefore, to make sure that we do not lack at our end in any way humanly possible we do a final round of quality check and then dispatch the study to the client.

Key Market Segments:

By Type

  • Chambers/Tanks

  • Underwater Treadmill

  • Hydrotherapy Pools

  • Hydrotherapy Tub/Bath

  • Others

By Application

  • Cardiology

  • Pain Management

  • Dermatology

  • Others

By End Use

  • Hospitals & Rehabilitation Centers

  • Spa & Wellness Centers

  • Others

Request for Segment Customization as per your Business Requirement: Segment Customization Request

Regional Coverage:

North America

  • US

  • Canada

  • Mexico

Europe

  • Eastern Europe

    • Poland

    • Romania

    • Hungary

    • Turkey

    • Rest of Eastern Europe

  • Western Europe

    • Germany

    • France

    • UK

    • Italy

    • Spain

    • Netherlands

    • Switzerland

    • Austria

    • Rest of Western Europe

Asia Pacific

  • China

  • India

  • Japan

  • South Korea

  • Vietnam

  • Singapore

  • Australia

  • Rest of Asia Pacific

Middle East & Africa

  • Middle East

    • UAE

    • Egypt

    • Saudi Arabia

    • Qatar

    • Rest of Middle East

  • Africa

    • Nigeria

    • South Africa

    • Rest of Africa

Latin America

  • Brazil

  • Argentina

  • Colombia

  • Rest of Latin America

Request for Country Level Research Report: Country Level Customization Request

Available Customization

With the given market data, SNS Insider offers customization as per the company’s specific needs. The following customization options are available for the report:

  • Detailed Volume Analysis

  • Criss-Cross segment analysis (e.g. Product X Application)

  • Competitive Product Benchmarking

  • Geographic Analysis

  • Additional countries in any of the regions

  • Customized Data Representation

  • Detailed analysis and profiling of additional market players


  •            5000 (33% Discount)


  •            8950 (40% Discount)


  •            3050 (23% Discount)

Start a Conversation

Hi! Click one of our member below to chat on Phone