image

Hydrogen Pipeline Market Report Scope & Overview:

The Hydrogen Pipeline Market was estimated at USD 9.25 billion in 2023 and is expected to reach USD 35.43 billion by 2032, with a growing CAGR of 16.09% over the forecast period 2024-2032. This report uniquely captures the evolution of the hydrogen pipeline market by presenting regional trends in pipeline installation and utilization rates, highlighting shifts in infrastructure deployment and operational efficiency. It tracks the rise of smart pipeline monitoring systems as part of increasing technological adoption. A focus on safety reveals a steady decline in incident rates driven by AI-based leak detection systems. Additionally, the report explores emerging trends such as blended hydrogen transport with natural gas and the repurposing of existing gas pipelines, signaling a transformative shift in energy infrastructure.

The U.S. hydrogen pipeline market is projected to grow from USD 1.01 billion in 2023 to USD 3.88 billion by 2032, expanding at a robust CAGR of 16.14%. This growth is driven by rising investments in clean energy infrastructure and increasing demand for low-emission fuel alternatives. The market is witnessing steady year-over-year gains, reflecting strong momentum in hydrogen transportation development across the country.

Market Dynamics

Drivers

  • Growing concerns over climate change and carbon emissions are accelerating the adoption of hydrogen as a clean fuel, driving demand for dedicated pipeline infrastructure.

The rising demand for clean energy sources is a major driver of growth in the hydrogen pipeline market. With climate change and carbon emissions on the rise, hydrogen is becoming a viable alternative to fossil fuels, and governments and industries around the world are jumping on the bandwagon. Future green hydrogen produced through renewable energy sources provides a carbon-free solution to decarbonizing transportation, power generation, and other heavy industry sectors. As energy producers switch to hydrogen, the need for effective and scalable hydrogen transport systems becomes critical, with pipelines the best option for long-distance, high-volume transport. Leading net-zero goals in addition to clean energy roadmaps supported strong investments in hydrogen infrastructure across Europe, Asia-Pacific, and North America in the latest market trends. This growth story will be further complemented by technological innovations in the segment, declining production costs, and increasing integration with renewable energy sources to fulfill the world’s emerging energy needs sustainably.

Restraint

  • High capital and infrastructure costs hinder the scalability of hydrogen pipelines due to expensive construction, material requirements, and retrofitting challenges.

Developing hydrogen pipeline infrastructure requires substantial capital investment, which poses a significant restraint to market growth. The construction of new hydrogen-specific pipelines must overcome significant engineering and material selection costs and safety measures, all attributed to hydrogen having unique properties, such as small molecular size and high diffusivity. Furthermore, retrofitting existing natural gas pipelines to convey hydrogen is not a straightforward process, as upgrading or replacing large sections is often needed to ensure that materials are compatible with hydrogen and to avoid phenomena like hydrogen embrittlement. All of these changes raise capital and operating costs. Furthermore, hydrogen demand is much smaller than that for fossil fuels, and thus economies of scale in the near term will be hard to achieve. Investors can be incentivized to take their chances on mammoth projects but struggle in regions without supportive regulatory frameworks or long-term offtake contracts. Consequently, the advanced pipeline investment is still a prominent obstacle to the proliferation and growth of hydrogen pipeline networks.

Opportunities

  • Private sector investments and PPPs are accelerating hydrogen pipeline development by combining government support with industry expertise and capital.

Private sector investment and Public-Private Partnerships (PPP) are playing a crucial role in accelerating the development of hydrogen pipeline infrastructure. As global interest in clean energy intensifies, numerous energy giants, industrial conglomerates, and infrastructure developers are entering the hydrogen value chain. This has led many stakeholders to invest in and further develop production, storage, and distribution networks with the longer-term aim of seeing hydrogen emerge as a viable sustainable fuel source. Through PPP models, governments and private players are able to share financial risks, technical know-how, and regulatory support, paving the way for large-scale hydrogen projects to be economically viable. Governments help by means of policy incentives, subsidies and strategic planning, while the private sector offers the innovation, capital and operational efficiencies. The future collaboration is essential for the development of extensive pipeline network to move hydrogen from production centers to industrial sites, fuelling stations or export terminals. Hydrogen infrastructure in 2030Finally, PPP growth is likely to provide a major lift to hydrogen infrastructure scalability and reliability globally.

Challenges

  • Alternative transport methods like liquefied hydrogen tankers and ammonia carriers pose competition to pipelines due to their flexibility and suitability for long-distance and export applications.

One of the key challenges facing the hydrogen pipeline market is competition from alternative hydrogen transport modes. Liquefied hydrogen tankers and hydrogen carriers like ammonia or liquid organic hydrogen carriers (LOHCs) are flexible and scalable technologies that can be used for long-distance and cross-border hydrogen transport. These new alternatives may be more cost such in regions with no current pipeline in place or territories where piping is not viable due to terrain, urban development or geopolitical borders. Moreover, such carriers, like ammonia, are easier to store and convert into hydrogen, which makes these carriers more attractive options to move hydrogen through international supply chains. Such methods may prove more cost-effective than designing new pipelines, countries and companies that have stated an interest in hydrogen exports. This competitive pressure may hinder investment in pipeline infrastructure, particularly in nascent markets, unless economic or strategic benefits of pipelines within certain regions or applications are demonstrated.

Segmentation Analysis

By Type

The fixed pipelines emerged as the dominant and fastest-growing segment, accounting for approximately 62% of the market share in 2023. The pipelines are permanently laid down, usually underground, and often constructed from some robust material such as steel or plastic. They can transport hydrogen in a safe and long-term process. Fixed pipelines are particularly cost-effective for those sectors that use hydrogen continuously as a high-volume feedstock, including chemical manufacturing, refining and energy generation. Increasing global demand for clean energy means raising the presence of robust hydrogen infrastructure, too and stimulating the fast-growing global market for hydrogen pipelines. We drive demand for hydrogen, and the reliability, scalability, and capacity necessary to serve a large-scale hydrogen economy make them a key piece of the future.

By Distance

The Upto 300 km segment dominated with a market share of over 38% in 2023.  Long cross-country pipelines have a key role to play in delivering hydrogen from centralized production sites typically positioned in proximity to renewable and industrial hubs to the major consumption centers that exist throughout the regions. Their high scale capacity and long range contribute to the development of a connected hydrogen infrastructure that is essential in scaling hydrogen applications in power generation, mobility and heavy industry. Moreover, such pipelines facilitate the export of hydrogen across borders, contributing to energy diversification and security. The demand for long-distance hydrogen pipelines will remain strong as nations invest in decarbonization and transition to clean energy, cementing their place as the market-leading segment in the hydrogen pipeline market.

By Hydrogen

The gas segment dominated with a 58% share in 2023 and continues to hold the largest market position. This is largely attributed to the relative energy efficiency and low operational costs associated with transporting hydrogen in its gaseous state via dedicated pipelines. Gaseous hydrogen piping is a well-understood, robust molecular infrastructure because piping prevents hydrogen explosions since it has similar flow properties to combustible gases. Moreover, unlike hydrogen, transporting it as a gas avoids energy-intensive liquefaction processes, which can lower operational expenses. These elements also extend the firm grip of gas segment in the market. If gas is the king, the liquid sector is something of a young prince, with rapid growth due to its long-distance transport and increasing use in energy and industrial applications.

By Pipeline Structure

The metal pipelines dominated with a 72% share in 2023 and currently hold the largest market share.  This dominance is due to the availability of extant metal pipeline infrastructure and their established strength and durability in transporting hydrogen over long distances. For example, the materials with high-pressure tolerance and structural integrity for large-scale hydrogen transmission networks are mostly steel and other types of metals. Moreover, due processes and the ongoing preference of industry actors for metal pipeline technology are expected to support their familiarity. The market is, however, gradually changing as plastics and composites is the fastest growing segment due to innovative lightweight corrosion-resistant materials which are now being considered as an available alternative to metals for potential future hydrogen transport systems.

Regional Analysis

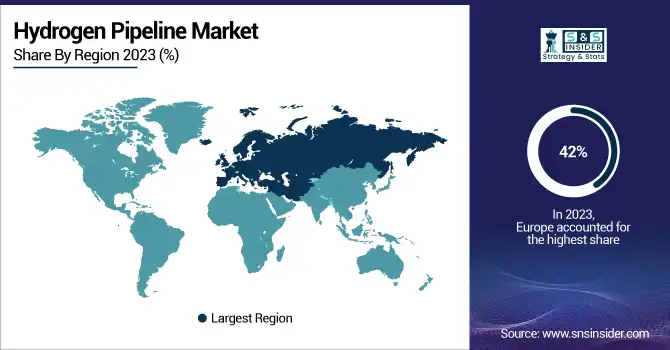
The Europe region dominated with a market share of over 42% in 2023, driven by robust government regulations and high investments aimed at reducing carbon emissions. This vision of the region focuses on building renewable hydrogen infrastructure and long-distance pipelines to enable reliable distribution. Various initiatives in several countries seek to establish hydrogen production hubs near points of demand, contributing to regional integration and the security of energy supply. Joint ventures across European countries and private sector players are also speeding up the hydrogen projects. This unified approach underlines Europe’s will to be the world leader in clean energy, especially hydrogen, placing it at the leading edge of constructing a greener energy future with advanced pipelines and cross-border collaboration.

The Middle East and Africa are rapidly emerging as the fastest-growing regions in the hydrogen pipeline market. This expansion is fueled by a surplus of renewable power, increasing need for clean H2, and beneficial government policies that promote domestic green energy production. There’s also well-established oil and gas infrastructure in the region that provides a solid foundation for the transition to hydrogen transport. Hydrogen infrastructure is receiving a clear commitment from countries such as Oman that are embarking on large-scale pipeline projects to connect production hubs to export points. With an accelerating global push for clean energy, the Middle East and Africa are discovering themselves as strategic players in the hydrogen economy, utilising their natural resources and prime geographical location to contribute to wider energy transitions around the world.

Key Players

  • Cenergy Holdings (composite and steel pipeline systems for hydrogen transport)

  • SoluForce B.V. (flexible reinforced thermoplastic hydrogen pipelines)

  • Salzgitter AG (hydrogen-ready steel pipes and tubes)

  • Gruppo Sarplast S.r.l (GRP and thermoplastic piping systems for hydrogen applications)

  • Tenaris (high-pressure hydrogen transmission pipes)

  • Hexagon Purus (hydrogen distribution pipe systems and Type 4 composite pressure vessels)

  • Pipelife International GmbH (plastic hydrogen pipeline solutions)

  • Europe Technologies (pipeline welding and inspection technologies for hydrogen infrastructure)

  • H2 Clipper, Inc. (long-distance hydrogen transport systems including pipelines and airships)

  • NPROXX (high-pressure hydrogen storage and pipeline components)

  • GF Piping Systems (polymer-based pipeline systems suitable for hydrogen transport)

  • ArcelorMittal (hydrogen-compatible steel pipeline products)

  • Jindal Saw Limited (welded and seamless pipes for hydrogen infrastructure)

  • Vallourec (seamless pipes for hydrogen transport and storage)

  • Tata Steel (hydrogen-ready pipeline steel solutions)

  • Liberty Steel Group (pipeline products for hydrogen energy systems)

  • ILJIN Steel (specialized steel pipelines for hydrogen applications)

  • Butting Group (corrosion-resistant stainless steel pipelines for hydrogen)

  • Welspun Corp (large-diameter hydrogen pipeline manufacturing)

  • Tubacex Group (high-alloy and stainless-steel piping for hydrogen transport)

Suppliers for (Strong in hydrogen production, liquefaction, and an extensive hydrogen pipeline network globally) on the Hydrogen Pipeline Market

  • Air Liquide

  • Linde plc

  • Air Products and Chemicals, Inc.

  • NEL ASA

  • Plug Power Inc.

  • Cummins Inc.

  • McDermott International, Ltd.

  • Tenaris S.A.

  • Enbridge Inc.

  • Kinder Morgan, Inc.

Recent Development

  • In November 19, 2024: Cenergy Holdings’ subsidiary, Corinth Pipeworks, enhanced its production facility by installing a new finishing line to address the growing demand for steel pipes. This upgrade has increased efficiency by enabling the LSAW and HSAW mills to operate independently.

Hydrogen Pipeline Market Report Scope:

Report Attributes Details
Market Size in 2023 USD 9.25 Billion
Market Size by 2032 USD 35.43 Billion
CAGR CAGR of 16.09% From 2024 to 2032
Base Year 2023
Forecast Period 2024-2032
Historical Data 2020-2022
Report Scope & Coverage Market Size, Segments Analysis, Competitive  Landscape, Regional Analysis, DROC & SWOT Analysis, Forecast Outlook
Key Segments • By Type (Mobile Pipelines, Fixed Pipelines)
• By Distance (Upto 300 Km, More than 300 Km)
• By Hydrogen (Gas, Liquid)
• By Pipeline Structure (Metal, Plastics & Composites)
Regional Analysis/Coverage North America (US, Canada, Mexico), Europe (Eastern Europe [Poland, Romania, Hungary, Turkey, Rest of Eastern Europe] Western Europe] Germany, France, UK, Italy, Spain, Netherlands, Switzerland, Austria, Rest of Western Europe]), Asia Pacific (China, India, Japan, South Korea, Vietnam, Singapore, Australia, Rest of Asia Pacific), Middle East & Africa (Middle East [UAE, Egypt, Saudi Arabia, Qatar, Rest of Middle East], Africa [Nigeria, South Africa, Rest of Africa], Latin America (Brazil, Argentina, Colombia, Rest of Latin America)
Company Profiles Cenergy Holdings, SoluForce B.V., Salzgitter AG, Gruppo Sarplast S.r.l, Tenaris, Hexagon Purus, Pipelife International GmbH, Europe Technologies, H2 Clipper, Inc., NPROXX, GF Piping Systems, ArcelorMittal, Jindal Saw Limited, Vallourec, Tata Steel, Liberty Steel Group, ILJIN Steel, Butting Group, Welspun Corp, Tubacex Group.

Frequently Asked Questions

Ans:  The Hydrogen Pipeline Market is expected to grow at a CAGR of 16.09% during 2024-2032.

Ans: The Hydrogen Pipeline Market was USD 9.25 billion in 2023 and is expected to reach USD 35.43 billion by 2032.

Ans: Growing concerns over climate change and carbon emissions are accelerating the adoption of hydrogen as a clean fuel, driving demand for dedicated pipeline infrastructure.

Ans: The “fixed pipelines” segment dominated the Hydrogen Pipeline Market.

Ans: Europe dominated the Hydrogen Pipeline Market in 2023.

Table of Contents

1. Introduction

1.1 Market Definition

1.2 Scope (Inclusion and Exclusions)

1.3 Research Assumptions

2. Executive Summary

2.1 Market Overview

2.2 Regional Synopsis

2.3 Competitive Summary

3. Research Methodology

3.1 Top-Down Approach

3.2 Bottom-up Approach

3.3. Data Validation

3.4 Primary Interviews

4. Market Dynamics Impact Analysis

4.1 Market Driving Factors Analysis

4.1.1 Drivers

4.1.2 Restraints

4.1.3 Opportunities

4.1.4 Challenges

4.2 PESTLE Analysis

4.3 Porter’s Five Forces Model

5. Statistical Insights and Trends Reporting

5.1 Pipeline Length Installed, by Region (2020–2023)

5.2 Pipeline Utilization Rates, by Region (2020–2023)

5.3 Technological Adoption Rates 

5.4 Safety and Incident Rates

6. Competitive Landscape

6.1 List of Major Companies, By Region

6.2 Market Share Analysis, By Region

6.3 Product Benchmarking

6.3.1 Product specifications and features

6.3.2 Pricing

6.4 Strategic Initiatives

6.4.1 Marketing and promotional activities

6.4.2 Distribution and supply chain strategies

6.4.3 Expansion plans and new product launches

6.4.4 Strategic partnerships and collaborations

6.5 Technological Advancements

6.6 Market Positioning and Branding

7. Hydrogen Pipeline Market Segmentation, By Type

7.1 Chapter Overview

7.2 Mobile Pipelines

7.2.1 Mobile Pipelines Market Trends Analysis (2020-2032)

7.2.2 Mobile Pipelines Market Size Estimates and Forecasts to 2032 (USD Billion)

7.3 Fixed Pipelines

7.3.1 Fixed Pipelines Market Trends Analysis (2020-2032)

7.3.2 Fixed Pipelines Market Size Estimates and Forecasts to 2032 (USD Billion)

8. Hydrogen Pipeline Market Segmentation, By Distance

8.1 Chapter Overview

8.2 Upto 300 Km

8.2.1 Upto 300 Km Market Trends Analysis (2020-2032)

8.2.2 Upto 300 Km Market Size Estimates and Forecasts to 2032 (USD Billion)

 8.3 More than 300 Km

8.3.1 More than 300 Km Market Trends Analysis (2020-2032)

8.3.2 More than 300 Km Market Size Estimates and Forecasts to 2032 (USD Billion)

9. Hydrogen Pipeline Market Segmentation, By Hydrogen

9.1 Chapter Overview

9.2 Gas

9.2.1 Gas Market Trends Analysis (2020-2032)

9.2.2 Gas Market Size Estimates and Forecasts to 2032 (USD Billion)

9.3 Liquid

9.3.1 Liquid Market Trends Analysis (2020-2032)

9.3.2 Liquid Market Size Estimates and Forecasts to 2032 (USD Billion)

10. Hydrogen Pipeline Market Segmentation, By Pipeline Structure

10.1 Chapter Overview

10.2 Metal

10.2.1 Metal Market Trends Analysis (2020-2032)

10.2.2 Metal Market Size Estimates and Forecasts to 2032 (USD Billion)

10.3 Plastics & Composites

10.3.1 Plastics & Composites Market Trends Analysis (2020-2032)

10.3.2 Plastics & Composites Market Size Estimates and Forecasts to 2032 (USD Billion)

11. Regional Analysis

11.1 Chapter Overview

11.2 North America

11.2.1 Trends Analysis

11.2.2 North America Hydrogen Pipeline Market  Estimates and Forecasts, by Country (2020-2032) (USD Billion)

11.2.3 North America Hydrogen Pipeline Market  Estimates and Forecasts, By Type (2020-2032) (USD Billion) 

11.2.4 North America Hydrogen Pipeline Market  Estimates and Forecasts, By Distance (2020-2032) (USD Billion)

11.2.5 North America Hydrogen Pipeline Market  Estimates and Forecasts, By Hydrogen (2020-2032) (USD Billion)

11.2.6 North America Hydrogen Pipeline Market  Estimates and Forecasts, By Pipeline Structure (2020-2032) (USD Billion)

11.2.7 USA

11.2.7.1 USA Hydrogen Pipeline Market  Estimates and Forecasts, By Type (2020-2032) (USD Billion)

11.2.7.2 USA Hydrogen Pipeline Market  Estimates and Forecasts, By Distance (2020-2032) (USD Billion)

11.2.7.3 USA Hydrogen Pipeline Market  Estimates and Forecasts, By Hydrogen (2020-2032) (USD Billion)

11.2.7.4 USA Hydrogen Pipeline Market  Estimates and Forecasts, By Pipeline Structure (2020-2032) (USD Billion)

11.2.8 Canada

11.2.8.1 Canada Hydrogen Pipeline Market  Estimates and Forecasts, By Type (2020-2032) (USD Billion)

11.2.8.2 Canada Hydrogen Pipeline Market  Estimates and Forecasts, By Distance (2020-2032) (USD Billion)

11.2.8.3 Canada Hydrogen Pipeline Market  Estimates and Forecasts, By Hydrogen (2020-2032) (USD Billion)

11.2.8.4 Canada Hydrogen Pipeline Market  Estimates and Forecasts, By Pipeline Structure (2020-2032) (USD Billion)

11.2.9 Mexico

11.2.9.1 Mexico Hydrogen Pipeline Market  Estimates and Forecasts, By Type (2020-2032) (USD Billion)

11.2.9.2 Mexico Hydrogen Pipeline Market  Estimates and Forecasts, By Distance (2020-2032) (USD Billion)

11.2.9.3 Mexico Hydrogen Pipeline Market  Estimates and Forecasts, By Hydrogen (2020-2032) (USD Billion)

11.2.9.4 Mexico Hydrogen Pipeline Market  Estimates and Forecasts, By Pipeline Structure (2020-2032) (USD Billion)

11.3 Europe

11.3.1 Eastern Europe

11.3.1.1 Trends Analysis

11.3.1.2 Eastern Europe Hydrogen Pipeline Market  Estimates and Forecasts, by Country (2020-2032) (USD Billion)

11.3.1.3 Eastern Europe Hydrogen Pipeline Market  Estimates and Forecasts, By Type (2020-2032) (USD Billion) 

11.3.1.4 Eastern Europe Hydrogen Pipeline Market  Estimates and Forecasts, By Distance (2020-2032) (USD Billion)

11.3.1.5 Eastern Europe Hydrogen Pipeline Market  Estimates and Forecasts, By Hydrogen (2020-2032) (USD Billion)

11.3.1.6 Eastern Europe Hydrogen Pipeline Market  Estimates and Forecasts, By Pipeline Structure (2020-2032) (USD Billion)

11.3.1.7 Poland

11.3.1.7.1 Poland Hydrogen Pipeline Market  Estimates and Forecasts, By Type (2020-2032) (USD Billion)

11.3.1.7.2 Poland Hydrogen Pipeline Market  Estimates and Forecasts, By Distance (2020-2032) (USD Billion)

11.3.1.7.3 Poland Hydrogen Pipeline Market  Estimates and Forecasts, By Hydrogen (2020-2032) (USD Billion)

11.3.1.7.4 Poland Hydrogen Pipeline Market  Estimates and Forecasts, By Pipeline Structure (2020-2032) (USD Billion)

11.3.1.8 Romania

11.3.1.8.1 Romania Hydrogen Pipeline Market  Estimates and Forecasts, By Type (2020-2032) (USD Billion)

11.3.1.8.2 Romania Hydrogen Pipeline Market  Estimates and Forecasts, By Distance (2020-2032) (USD Billion)

11.3.1.8.3 Romania Hydrogen Pipeline Market  Estimates and Forecasts, By Hydrogen (2020-2032) (USD Billion)

11.3.1.8.4 Romania Hydrogen Pipeline Market  Estimates and Forecasts, By Pipeline Structure (2020-2032) (USD Billion)

11.3.1.9 Hungary

11.3.1.9.1 Hungary Hydrogen Pipeline Market  Estimates and Forecasts, By Type (2020-2032) (USD Billion)

11.3.1.9.2 Hungary Hydrogen Pipeline Market  Estimates and Forecasts, By Distance (2020-2032) (USD Billion)

11.3.1.9.3 Hungary Hydrogen Pipeline Market  Estimates and Forecasts, By Hydrogen (2020-2032) (USD Billion)

11.3.1.9.4 Hungary Hydrogen Pipeline Market  Estimates and Forecasts, By Pipeline Structure (2020-2032) (USD Billion)

11.3.1.10 Turkey

11.3.1.10.1 Turkey Hydrogen Pipeline Market  Estimates and Forecasts, By Type (2020-2032) (USD Billion)

11.3.1.10.2 Turkey Hydrogen Pipeline Market  Estimates and Forecasts, By Distance (2020-2032) (USD Billion)

11.3.1.10.3 Turkey Hydrogen Pipeline Market  Estimates and Forecasts, By Hydrogen (2020-2032) (USD Billion)

11.3.1.10.4 Turkey Hydrogen Pipeline Market  Estimates and Forecasts, By Pipeline Structure (2020-2032) (USD Billion)

11.3.1.11 Rest of Eastern Europe

11.3.1.11.1 Rest of Eastern Europe Hydrogen Pipeline Market  Estimates and Forecasts, By Type (2020-2032) (USD Billion)

11.3.1.11.2 Rest of Eastern Europe Hydrogen Pipeline Market  Estimates and Forecasts, By Distance (2020-2032) (USD Billion)

11.3.1.11.3 Rest of Eastern Europe Hydrogen Pipeline Market  Estimates and Forecasts, By Hydrogen (2020-2032) (USD Billion)

11.3.1.11.4 Rest of Eastern Europe Hydrogen Pipeline Market  Estimates and Forecasts, By Pipeline Structure (2020-2032) (USD Billion)

11.3.2 Western Europe

11.3.2.1 Trends Analysis

11.3.2.2 Western Europe Hydrogen Pipeline Market  Estimates and Forecasts, by Country (2020-2032) (USD Billion)

11.3.2.3 Western Europe Hydrogen Pipeline Market  Estimates and Forecasts, By Type (2020-2032) (USD Billion) 

11.3.2.4 Western Europe Hydrogen Pipeline Market  Estimates and Forecasts, By Distance (2020-2032) (USD Billion)

11.3.2.5 Western Europe Hydrogen Pipeline Market  Estimates and Forecasts, By Hydrogen (2020-2032) (USD Billion)

11.3.2.6 Western Europe Hydrogen Pipeline Market  Estimates and Forecasts, By Pipeline Structure (2020-2032) (USD Billion)

11.3.2.7 Germany

11.3.2.7.1 Germany Hydrogen Pipeline Market  Estimates and Forecasts, By Type (2020-2032) (USD Billion)

11.3.2.7.2 Germany Hydrogen Pipeline Market  Estimates and Forecasts, By Distance (2020-2032) (USD Billion)

11.3.2.7.3 Germany Hydrogen Pipeline Market  Estimates and Forecasts, By Hydrogen (2020-2032) (USD Billion)

11.3.2.7.4 Germany Hydrogen Pipeline Market  Estimates and Forecasts, By Pipeline Structure (2020-2032) (USD Billion)

11.3.2.8 France

11.3.2.8.1 France Hydrogen Pipeline Market  Estimates and Forecasts, By Type (2020-2032) (USD Billion)

11.3.2.8.2 France Hydrogen Pipeline Market  Estimates and Forecasts, By Distance (2020-2032) (USD Billion)

11.3.2.8.3 France Hydrogen Pipeline Market  Estimates and Forecasts, By Hydrogen (2020-2032) (USD Billion)

11.3.2.8.4 France Hydrogen Pipeline Market  Estimates and Forecasts, By Pipeline Structure (2020-2032) (USD Billion)

11.3.2.9 UK

11.3.2.9.1 UK Hydrogen Pipeline Market  Estimates and Forecasts, By Type (2020-2032) (USD Billion)

11.3.2.9.2 UK Hydrogen Pipeline Market  Estimates and Forecasts, By Distance (2020-2032) (USD Billion)

11.3.2.9.3 UK Hydrogen Pipeline Market  Estimates and Forecasts, By Hydrogen (2020-2032) (USD Billion)

11.3.2.9.4 UK Hydrogen Pipeline Market  Estimates and Forecasts, By Pipeline Structure (2020-2032) (USD Billion)

11.3.2.10 Italy

11.3.2.10.1 Italy Hydrogen Pipeline Market  Estimates and Forecasts, By Type (2020-2032) (USD Billion)

11.3.2.10.2 Italy Hydrogen Pipeline Market  Estimates and Forecasts, By Distance (2020-2032) (USD Billion)

11.3.2.10.3 Italy Hydrogen Pipeline Market  Estimates and Forecasts, By Hydrogen (2020-2032) (USD Billion)

11.3.2.10.4 Italy Hydrogen Pipeline Market  Estimates and Forecasts, By Pipeline Structure (2020-2032) (USD Billion)

11.3.2.11 Spain

11.3.2.11.1 Spain Hydrogen Pipeline Market  Estimates and Forecasts, By Type (2020-2032) (USD Billion)

11.3.2.11.2 Spain Hydrogen Pipeline Market  Estimates and Forecasts, By Distance (2020-2032) (USD Billion)

11.3.2.11.3 Spain Hydrogen Pipeline Market  Estimates and Forecasts, By Hydrogen (2020-2032) (USD Billion)

11.3.2.11.4 Spain Hydrogen Pipeline Market  Estimates and Forecasts, By Pipeline Structure (2020-2032) (USD Billion)

11.3.2.12 Netherlands

11.3.2.12.1 Netherlands Hydrogen Pipeline Market  Estimates and Forecasts, By Type (2020-2032) (USD Billion)

11.3.2.12.2 Netherlands Hydrogen Pipeline Market  Estimates and Forecasts, By Distance (2020-2032) (USD Billion)

11.3.2.12.3 Netherlands Hydrogen Pipeline Market  Estimates and Forecasts, By Hydrogen (2020-2032) (USD Billion)

11.3.2.12.4 Netherlands Hydrogen Pipeline Market  Estimates and Forecasts, By Pipeline Structure (2020-2032) (USD Billion)

11.3.2.13 Switzerland

11.3.2.13.1 Switzerland Hydrogen Pipeline Market  Estimates and Forecasts, By Type (2020-2032) (USD Billion)

11.3.2.13.2 Switzerland Hydrogen Pipeline Market  Estimates and Forecasts, By Distance (2020-2032) (USD Billion)

11.3.2.13.3 Switzerland Hydrogen Pipeline Market  Estimates and Forecasts, By Hydrogen (2020-2032) (USD Billion)

11.3.2.13.4 Switzerland Hydrogen Pipeline Market  Estimates and Forecasts, By Pipeline Structure (2020-2032) (USD Billion)

11.3.2.14 Austria

11.3.2.14.1 Austria Hydrogen Pipeline Market  Estimates and Forecasts, By Type (2020-2032) (USD Billion)

11.3.2.14.2 Austria Hydrogen Pipeline Market  Estimates and Forecasts, By Distance (2020-2032) (USD Billion)

11.3.2.14.3 Austria Hydrogen Pipeline Market  Estimates and Forecasts, By Hydrogen (2020-2032) (USD Billion)

11.3.2.14.4 Austria Hydrogen Pipeline Market  Estimates and Forecasts, By Pipeline Structure (2020-2032) (USD Billion)

11.3.2.15 Rest of Western Europe

11.3.2.15.1 Rest of Western Europe Hydrogen Pipeline Market  Estimates and Forecasts, By Type (2020-2032) (USD Billion)

11.3.2.15.2 Rest of Western Europe Hydrogen Pipeline Market  Estimates and Forecasts, By Distance (2020-2032) (USD Billion)

11.3.2.15.3 Rest of Western Europe Hydrogen Pipeline Market  Estimates and Forecasts, By Hydrogen (2020-2032) (USD Billion)

11.3.2.15.4 Rest of Western Europe Hydrogen Pipeline Market  Estimates and Forecasts, By Pipeline Structure (2020-2032) (USD Billion)

11.4 Asia Pacific

11.4.1 Trends Analysis

11.4.2 Asia Pacific Hydrogen Pipeline Market  Estimates and Forecasts, by Country (2020-2032) (USD Billion)

11.4.3 Asia Pacific Hydrogen Pipeline Market  Estimates and Forecasts, By Type (2020-2032) (USD Billion) 

11.4.4 Asia Pacific Hydrogen Pipeline Market  Estimates and Forecasts, By Distance (2020-2032) (USD Billion)

11.4.5 Asia Pacific Hydrogen Pipeline Market  Estimates and Forecasts, By Hydrogen (2020-2032) (USD Billion)

11.4.6 Asia Pacific Hydrogen Pipeline Market  Estimates and Forecasts, By Pipeline Structure (2020-2032) (USD Billion)

11.4.7 China

11.4.7.1 China Hydrogen Pipeline Market  Estimates and Forecasts, By Type (2020-2032) (USD Billion)

11.4.7.2 China Hydrogen Pipeline Market  Estimates and Forecasts, By Distance (2020-2032) (USD Billion)

11.4.7.3 China Hydrogen Pipeline Market  Estimates and Forecasts, By Hydrogen (2020-2032) (USD Billion)

11.4.7.4 China Hydrogen Pipeline Market  Estimates and Forecasts, By Pipeline Structure (2020-2032) (USD Billion)

11.4.8 India

11.4.8.1 India Hydrogen Pipeline Market  Estimates and Forecasts, By Type (2020-2032) (USD Billion)

11.4.8.2 India Hydrogen Pipeline Market  Estimates and Forecasts, By Distance (2020-2032) (USD Billion)

11.4.8.3 India Hydrogen Pipeline Market  Estimates and Forecasts, By Hydrogen (2020-2032) (USD Billion)

11.4.8.4 India Hydrogen Pipeline Market  Estimates and Forecasts, By Pipeline Structure (2020-2032) (USD Billion)

11.4.9 Japan

11.4.9.1 Japan Hydrogen Pipeline Market  Estimates and Forecasts, By Type (2020-2032) (USD Billion)

11.4.9.2 Japan Hydrogen Pipeline Market  Estimates and Forecasts, By Distance (2020-2032) (USD Billion)

11.4.9.3 Japan Hydrogen Pipeline Market  Estimates and Forecasts, By Hydrogen (2020-2032) (USD Billion)

11.4.9.4 Japan Hydrogen Pipeline Market  Estimates and Forecasts, By Pipeline Structure (2020-2032) (USD Billion)

11.4.10 South Korea

11.4.10.1 South Korea Hydrogen Pipeline Market  Estimates and Forecasts, By Type (2020-2032) (USD Billion)

11.4.10.2 South Korea Hydrogen Pipeline Market  Estimates and Forecasts, By Distance (2020-2032) (USD Billion)

11.4.10.3 South Korea Hydrogen Pipeline Market  Estimates and Forecasts, By Hydrogen (2020-2032) (USD Billion)

11.4.10.4 South Korea Hydrogen Pipeline Market  Estimates and Forecasts, By Pipeline Structure (2020-2032) (USD Billion)

11.4.11 Vietnam

11.4.11.1 Vietnam Hydrogen Pipeline Market  Estimates and Forecasts, By Type (2020-2032) (USD Billion)

11.4.11.2 Vietnam Hydrogen Pipeline Market  Estimates and Forecasts, By Distance (2020-2032) (USD Billion)

11.4.11.3 Vietnam Hydrogen Pipeline Market  Estimates and Forecasts, By Hydrogen (2020-2032) (USD Billion)

11.4.11.4 Vietnam Hydrogen Pipeline Market  Estimates and Forecasts, By Pipeline Structure (2020-2032) (USD Billion)

11.4.12 Singapore

11.4.12.1 Singapore Hydrogen Pipeline Market  Estimates and Forecasts, By Type (2020-2032) (USD Billion)

11.4.12.2 Singapore Hydrogen Pipeline Market  Estimates and Forecasts, By Distance (2020-2032) (USD Billion)

11.4.12.3 Singapore Hydrogen Pipeline Market  Estimates and Forecasts, By Hydrogen (2020-2032) (USD Billion)

11.4.12.4 Singapore Hydrogen Pipeline Market  Estimates and Forecasts, By Pipeline Structure (2020-2032) (USD Billion)

11.4.13 Australia

11.4.13.1 Australia Hydrogen Pipeline Market  Estimates and Forecasts, By Type (2020-2032) (USD Billion)

11.4.13.2 Australia Hydrogen Pipeline Market  Estimates and Forecasts, By Distance (2020-2032) (USD Billion)

11.4.13.3 Australia Hydrogen Pipeline Market  Estimates and Forecasts, By Hydrogen (2020-2032) (USD Billion)

11.4.13.4 Australia Hydrogen Pipeline Market  Estimates and Forecasts, By Pipeline Structure (2020-2032) (USD Billion)

11.4.14 Rest of Asia Pacific

11.4.14.1 Rest of Asia Pacific Hydrogen Pipeline Market  Estimates and Forecasts, By Type (2020-2032) (USD Billion)

11.4.14.2 Rest of Asia Pacific Hydrogen Pipeline Market  Estimates and Forecasts, By Distance (2020-2032) (USD Billion)

11.4.14.3 Rest of Asia Pacific Hydrogen Pipeline Market  Estimates and Forecasts, By Hydrogen (2020-2032) (USD Billion)

11.4.14.4 Rest of Asia Pacific Hydrogen Pipeline Market  Estimates and Forecasts, By Pipeline Structure (2020-2032) (USD Billion)

11.5 Middle East and Africa

11.5.1 Middle East

11.5.1.1 Trends Analysis

11.5.1.2 Middle East Hydrogen Pipeline Market  Estimates and Forecasts, by Country (2020-2032) (USD Billion)

11.5.1.3 Middle East Hydrogen Pipeline Market  Estimates and Forecasts, By Type (2020-2032) (USD Billion) 

11.5.1.4 Middle East Hydrogen Pipeline Market  Estimates and Forecasts, By Distance (2020-2032) (USD Billion)

11.5.1.5 Middle East Hydrogen Pipeline Market  Estimates and Forecasts, By Hydrogen (2020-2032) (USD Billion)

11.5.1.6 Middle East Hydrogen Pipeline Market  Estimates and Forecasts, By Pipeline Structure (2020-2032) (USD Billion)

11.5.1.7 UAE

11.5.1.7.1 UAE Hydrogen Pipeline Market  Estimates and Forecasts, By Type (2020-2032) (USD Billion)

11.5.1.7.2 UAE Hydrogen Pipeline Market  Estimates and Forecasts, By Distance (2020-2032) (USD Billion)

11.5.1.7.3 UAE Hydrogen Pipeline Market  Estimates and Forecasts, By Hydrogen (2020-2032) (USD Billion)

11.5.1.7.4 UAE Hydrogen Pipeline Market  Estimates and Forecasts, By Pipeline Structure (2020-2032) (USD Billion)

11.5.1.8 Egypt

11.5.1.8.1 Egypt Hydrogen Pipeline Market  Estimates and Forecasts, By Type (2020-2032) (USD Billion)

11.5.1.8.2 Egypt Hydrogen Pipeline Market  Estimates and Forecasts, By Distance (2020-2032) (USD Billion)

11.5.1.8.3 Egypt Hydrogen Pipeline Market  Estimates and Forecasts, By Hydrogen (2020-2032) (USD Billion)

11.5.1.8.4 Egypt Hydrogen Pipeline Market  Estimates and Forecasts, By Pipeline Structure (2020-2032) (USD Billion)

11.5.1.9 Saudi Arabia

11.5.1.9.1 Saudi Arabia Hydrogen Pipeline Market  Estimates and Forecasts, By Type (2020-2032) (USD Billion)

11.5.1.9.2 Saudi Arabia Hydrogen Pipeline Market  Estimates and Forecasts, By Distance (2020-2032) (USD Billion)

11.5.1.9.3 Saudi Arabia Hydrogen Pipeline Market  Estimates and Forecasts, By Hydrogen (2020-2032) (USD Billion)

11.5.1.9.4 Saudi Arabia Hydrogen Pipeline Market  Estimates and Forecasts, By Pipeline Structure (2020-2032) (USD Billion)

11.5.1.10 Qatar

11.5.1.10.1 Qatar Hydrogen Pipeline Market  Estimates and Forecasts, By Type (2020-2032) (USD Billion)

11.5.1.10.2 Qatar Hydrogen Pipeline Market  Estimates and Forecasts, By Distance (2020-2032) (USD Billion)

11.5.1.10.3 Qatar Hydrogen Pipeline Market  Estimates and Forecasts, By Hydrogen (2020-2032) (USD Billion)

11.5.1.10.4 Qatar Hydrogen Pipeline Market  Estimates and Forecasts, By Pipeline Structure (2020-2032) (USD Billion)

11.5.1.11 Rest of Middle East

11.5.1.11.1 Rest of Middle East Hydrogen Pipeline Market  Estimates and Forecasts, By Type (2020-2032) (USD Billion)

11.5.1.11.2 Rest of Middle East Hydrogen Pipeline Market  Estimates and Forecasts, By Distance (2020-2032) (USD Billion)

11.5.1.11.3 Rest of Middle East Hydrogen Pipeline Market  Estimates and Forecasts, By Hydrogen (2020-2032) (USD Billion)

11.5.1.11.4 Rest of Middle East Hydrogen Pipeline Market  Estimates and Forecasts, By Pipeline Structure (2020-2032) (USD Billion)

11.5.2 Africa

11.5.2.1 Trends Analysis

11.5.2.2 Africa Hydrogen Pipeline Market  Estimates and Forecasts, by Country (2020-2032) (USD Billion)

11.5.2.3 Africa Hydrogen Pipeline Market  Estimates and Forecasts, By Type (2020-2032) (USD Billion) 

11.5.2.4 Africa Hydrogen Pipeline Market  Estimates and Forecasts, By Distance (2020-2032) (USD Billion)

11.5.2.5 Africa Hydrogen Pipeline Market  Estimates and Forecasts, By Hydrogen (2020-2032) (USD Billion)

11.5.2.6 Africa Hydrogen Pipeline Market  Estimates and Forecasts, By Pipeline Structure (2020-2032) (USD Billion)

11.5.2.7 South Africa

11.5.2.7.1 South Africa Hydrogen Pipeline Market  Estimates and Forecasts, By Type (2020-2032) (USD Billion)

11.5.2.7.2 South Africa Hydrogen Pipeline Market  Estimates and Forecasts, By Distance (2020-2032) (USD Billion)

11.5.2.7.3 South Africa Hydrogen Pipeline Market  Estimates and Forecasts, By Hydrogen (2020-2032) (USD Billion)

11.5.2.7.4 South Africa Hydrogen Pipeline Market  Estimates and Forecasts, By Pipeline Structure (2020-2032) (USD Billion)

11.5.2.8 Nigeria

11.5.2.8.1 Nigeria Hydrogen Pipeline Market  Estimates and Forecasts, By Type (2020-2032) (USD Billion)

11.5.2.8.2 Nigeria Hydrogen Pipeline Market  Estimates and Forecasts, By Distance (2020-2032) (USD Billion)

11.5.2.8.3 Nigeria Hydrogen Pipeline Market  Estimates and Forecasts, By Hydrogen (2020-2032) (USD Billion)

11.5.2.8.4 Nigeria Hydrogen Pipeline Market  Estimates and Forecasts, By Pipeline Structure (2020-2032) (USD Billion)

11.5.2.9 Rest of Africa

11.5.2.9.1 Rest of Africa Hydrogen Pipeline Market  Estimates and Forecasts, By Type (2020-2032) (USD Billion)

11.5.2.9.2 Rest of Africa Hydrogen Pipeline Market  Estimates and Forecasts, By Distance (2020-2032) (USD Billion)

11.5.2.9.3 Rest of Africa Hydrogen Pipeline Market  Estimates and Forecasts, By Hydrogen (2020-2032) (USD Billion)

11.5.2.9.4 Rest of Africa Hydrogen Pipeline Market  Estimates and Forecasts, By Pipeline Structure (2020-2032) (USD Billion)

11.6 Latin America

11.6.1 Trends Analysis

11.6.2 Latin America Hydrogen Pipeline Market  Estimates and Forecasts, by Country (2020-2032) (USD Billion)

11.6.3 Latin America Hydrogen Pipeline Market  Estimates and Forecasts, By Type (2020-2032) (USD Billion) 

11.6.4 Latin America Hydrogen Pipeline Market  Estimates and Forecasts, By Distance (2020-2032) (USD Billion)

11.6.5 Latin America Hydrogen Pipeline Market  Estimates and Forecasts, By Hydrogen (2020-2032) (USD Billion)

11.6.6 Latin America Hydrogen Pipeline Market  Estimates and Forecasts, By Pipeline Structure (2020-2032) (USD Billion)

11.6.7 Brazil

11.6.7.1 Brazil Hydrogen Pipeline Market  Estimates and Forecasts, By Type (2020-2032) (USD Billion)

11.6.7.2 Brazil Hydrogen Pipeline Market  Estimates and Forecasts, By Distance (2020-2032) (USD Billion)

11.6.7.3 Brazil Hydrogen Pipeline Market  Estimates and Forecasts, By Hydrogen (2020-2032) (USD Billion)

11.6.7.4 Brazil Hydrogen Pipeline Market  Estimates and Forecasts, By Pipeline Structure (2020-2032) (USD Billion)

11.6.8 Argentina

11.6.8.1 Argentina Hydrogen Pipeline Market  Estimates and Forecasts, By Type (2020-2032) (USD Billion)

11.6.8.2 Argentina Hydrogen Pipeline Market  Estimates and Forecasts, By Distance (2020-2032) (USD Billion)

11.6.8.3 Argentina Hydrogen Pipeline Market  Estimates and Forecasts, By Hydrogen (2020-2032) (USD Billion)

11.6.8.4 Argentina Hydrogen Pipeline Market  Estimates and Forecasts, By Pipeline Structure (2020-2032) (USD Billion)

11.6.9 Colombia

11.6.9.1 Colombia Hydrogen Pipeline Market  Estimates and Forecasts, By Type (2020-2032) (USD Billion)

11.6.9.2 Colombia Hydrogen Pipeline Market  Estimates and Forecasts, By Distance (2020-2032) (USD Billion)

11.6.9.3 Colombia Hydrogen Pipeline Market  Estimates and Forecasts, By Hydrogen (2020-2032) (USD Billion)

11.6.9.4 Colombia Hydrogen Pipeline Market  Estimates and Forecasts, By Pipeline Structure (2020-2032) (USD Billion)

11.6.10 Rest of Latin America

11.6.10.1 Rest of Latin America Hydrogen Pipeline Market  Estimates and Forecasts, By Type (2020-2032) (USD Billion)

11.6.10.2 Rest of Latin America Hydrogen Pipeline Market  Estimates and Forecasts, By Distance (2020-2032) (USD Billion)

11.6.10.3 Rest of Latin America Hydrogen Pipeline Market  Estimates and Forecasts, By Hydrogen (2020-2032) (USD Billion)

11.6.10.4 Rest of Latin America Hydrogen Pipeline Market  Estimates and Forecasts, By Pipeline Structure (2020-2032) (USD Billion)

12. Company Profiles

12.1 Cenergy Holdings

12.1.1 Company Overview

12.1.2 Financial

12.1.3 Products/ Services Offered

12.1.4 SWOT Analysis

12.2 SoluForce B.V.

12.2.1 Company Overview

12.2.2 Financial

12.2.3 Products/ Services Offered

12.2.4 SWOT Analysis

12.3 Salzgitter AG

12.3.1 Company Overview

12.3.2 Financial

12.3.3 Products/ Services Offered

12.3.4 SWOT Analysis

12.4 Gruppo Sarplast S.r.l

12.4.1 Company Overview

12.4.2 Financial

12.4.3 Products/ Services Offered

12.4.4 SWOT Analysis

12.5 Tenaris

12.5.1 Company Overview

12.5.2 Financial

12.5.3 Products/ Services Offered

12.5.4 SWOT Analysis

12.6 Hexagon Purus

12.6.1 Company Overview

12.6.2 Financial

12.6.3 Products/ Services Offered

12.6.4 SWOT Analysis

12.7 Pipelife International GmbH

12.7.1 Company Overview

12.7.2 Financial

12.7.3 Products/ Services Offered

12.7.4 SWOT Analysis

12.8 Europe Technologies

12.8.1 Company Overview

12.8.2 Financial

12.8.3 Products/ Services Offered

12.8.4 SWOT Analysis

12.9 H2 Clipper, Inc.

12.9.1 Company Overview

12.9.2 Financial

12.9.3 Products/ Services Offered

12.9.4 SWOT Analysis

12.10 NPROXX

12.10.1 Company Overview

12.10.2 Financial

12.10.3 Products/ Services Offered

12.10.4 SWOT Analysis

13. Use Cases and Best Practices

14. Conclusion

An accurate research report requires proper strategizing as well as implementation. There are multiple factors involved in the completion of good and accurate research report and selecting the best methodology to compete the research is the toughest part. Since the research reports we provide play a crucial role in any company’s decision-making process, therefore we at SNS Insider always believe that we should choose the best method which gives us results closer to reality. This allows us to reach at a stage wherein we can provide our clients best and accurate investment to output ratio.

Each report that we prepare takes a timeframe of 350-400 business hours for production. Starting from the selection of titles through a couple of in-depth brain storming session to the final QC process before uploading our titles on our website we dedicate around 350 working hours. The titles are selected based on their current market cap and the foreseen CAGR and growth.


The 5 steps process:

Step 1: Secondary Research:

Secondary Research or Desk Research is as the name suggests is a research process wherein, we collect data through the readily available information. In this process we use various paid and unpaid databases which our team has access to and gather data through the same. This includes examining of listed companies’ annual reports, Journals, SEC filling etc. Apart from this our team has access to various associations across the globe across different industries. Lastly, we have exchange relationships with various university as well as individual libraries.

Secondary Research

Step 2: Primary Research

When we talk about primary research, it is a type of study in which the researchers collect relevant data samples directly, rather than relying on previously collected data.  This type of research is focused on gaining content specific facts that can be sued to solve specific problems. Since the collected data is fresh and first hand therefore it makes the study more accurate and genuine.

We at SNS Insider have divided Primary Research into 2 parts.

Part 1 wherein we interview the KOLs of major players as well as the upcoming ones across various geographic regions. This allows us to have their view over the market scenario and acts as an important tool to come closer to the accurate market numbers. As many as 45 paid and unpaid primary interviews are taken from both the demand and supply side of the industry to make sure we land at an accurate judgement and analysis of the market.

This step involves the triangulation of data wherein our team analyses the interview transcripts, online survey responses and observation of on filed participants. The below mentioned chart should give a better understanding of the part 1 of the primary interview.

Primary Research

Part 2: In this part of primary research the data collected via secondary research and the part 1 of the primary research is validated with the interviews from individual consultants and subject matter experts.

Consultants are those set of people who have at least 12 years of experience and expertise within the industry whereas Subject Matter Experts are those with at least 15 years of experience behind their back within the same space. The data with the help of two main processes i.e., FGDs (Focused Group Discussions) and IDs (Individual Discussions). This gives us a 3rd party nonbiased primary view of the market scenario making it a more dependable one while collation of the data pointers.

Step 3: Data Bank Validation

Once all the information is collected via primary and secondary sources, we run that information for data validation. At our intelligence centre our research heads track a lot of information related to the market which includes the quarterly reports, the daily stock prices, and other relevant information. Our data bank server gets updated every fortnight and that is how the information which we collected using our primary and secondary information is revalidated in real time.

Data Bank Validation

Step 4: QA/QC Process

After all the data collection and validation our team does a final level of quality check and quality assurance to get rid of any unwanted or undesired mistakes. This might include but not limited to getting rid of the any typos, duplication of numbers or missing of any important information. The people involved in this process include technical content writers, research heads and graphics people. Once this process is completed the title gets uploader on our platform for our clients to read it.

Step 5: Final QC/QA Process:

This is the last process and comes when the client has ordered the study. In this process a final QA/QC is done before the study is emailed to the client. Since we believe in giving our clients a good experience of our research studies, therefore, to make sure that we do not lack at our end in any way humanly possible we do a final round of quality check and then dispatch the study to the client.

Key Segments:

By Type

  • Mobile Pipelines

  • Fixed Pipelines

By Distance

  • Upto 300 Km

  • More than 300 Km

By Hydrogen

  • Gas

  • Liquid

By Pipeline Structure

  • Metal

  • Plastics & Composites

Request for Segment Customization as per your Business Requirement: Segment Customization Request

Regional Coverage:

North America

  • US

  • Canada

  • Mexico

Europe

  • Eastern Europe

    • Poland

    • Romania

    • Hungary

    • Turkey

    • Rest of Eastern Europe

  • Western Europe

    • Germany

    • France

    • UK

    • Italy

    • Spain

    • Netherlands

    • Switzerland

    • Austria

    • Rest of Western Europe

Asia Pacific

  • China

  • India

  • Japan

  • South Korea

  • Vietnam

  • Singapore

  • Australia

  • Rest of Asia Pacific

Middle East & Africa

  • Middle East

    • UAE

    • Egypt

    • Saudi Arabia

    • Qatar

    • Rest of Middle East

  • Africa

    • Nigeria

    • South Africa

    • Rest of Africa

Latin America

  • Brazil

  • Argentina

  • Colombia

  • Rest of Latin America

Request for Country Level Research Report: Country Level Customization Request

Available Customization

With the given market data, SNS Insider offers customization as per the company’s specific needs. The following customization options are available for the report:

  • Detailed Volume Analysis

  • Criss-Cross segment analysis (e.g. Product X Application)

  • Competitive Product Benchmarking

  • Geographic Analysis

  • Additional countries in any of the regions

  • Customized Data Representation

  • Detailed analysis and profiling of additional market players


  •            5000 (33% Discount)


  •            8950 (40% Discount)


  •            3050 (23% Discount)

Start a Conversation

Hi! Click one of our member below to chat on Phone