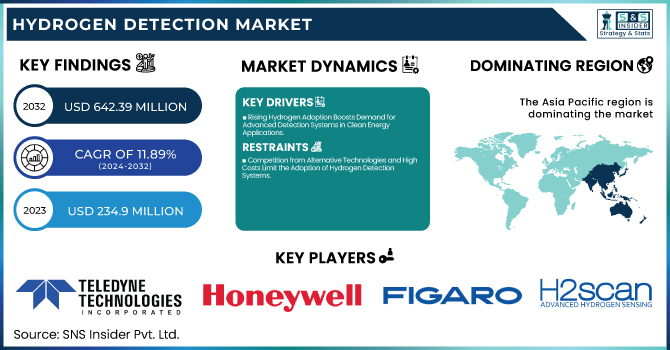
The Hydrogen Detection Market Size was valued at USD 234.9 million in 2023 and is expected to reach USD 642.39 million by 2032, growing at a CAGR of 11.89% from 2024-2032. This report features relevant information about adoption rates, technology developments, regulation effects, investment trends, and cost compositions. Growing demand for hydrogen energy and safety considerations propel market growth. Advances in technology enhance detection system efficiency and reliability, and toughened safety measures promote market adoption. Investments in hydrogen infrastructure and detection techs also continue to grow, further propelling market growth. The breakdown in costs shows a key emphasis on innovative sensor technologies, which affects market dynamics.
To Get more information on Hydrogen Detection Market - Request Free Sample Report
Drivers
Rising Hydrogen Adoption Boosts Demand for Advanced Detection Systems in Clean Energy Applications
The growth of hydrogen use as a clean source of energy across industries such as transportation, electricity generation, and manufacturing is pushing demand for credible detection systems. As the pace of the world's efforts in decarbonizing gathers speed, hydrogen is becoming increasingly popular as a cleaner energy source than traditional fossil fuels. Protection in manufacturing, warehousing, and shipping has taken the highest priority, which in turn has pushed the investment towards newer hydrogen sensing technologies. Further, the extensive development of hydrogen infrastructure such as fueling stations and industrial usage creates the requirement for accurate and efficient leak-detecting technologies. The strong regulatory guidelines further increase the requirement for constant monitoring systems, thus protecting the functioning as well as regulatory compliance. All these factors are jointly driving the uptake of hydrogen detection technologies in different industries.
Restraints
Competition from Alternative Technologies and High Costs Limit the Adoption of Hydrogen Detection Systems
Competition from other detection technologies, e.g., infrared and ultrasonic sensors, may potentially rival hydrogen-specific systems. Although hydrogen detection systems have specialized features, there exist technologies with similar or even more widely applicable detection capacities in certain instances. Furthermore, the exorbitant cost of implementing sophisticated sensors might deter adoption, especially among small businesses. Technological constraints in terms of precision, sensitivity, and longevity in extreme environments also limit the efficiency of certain detection systems. The absence of global standardization of hydrogen detection technologies across sectors also prevents mass adoption. Furthermore, the integration of these systems into current infrastructure is complicated, involving expensive and time-consuming adjustments. Finally, limited knowledge of the significance of hydrogen detection in some industries hinders market penetration.
Opportunities
Technological Advancements and Expanding Infrastructure Drive Growth Opportunities in the Hydrogen Detection Market
The merging of hydrogen detection systems with IoT and smart technologies presents opportunities for more efficient, automated, and real-time monitoring solutions. As hydrogen infrastructure grows, such as refueling stations and production facilities, the demand for robust detection systems increases. Government spending on clean energy initiatives, coupled with increasing safety regulations in industries such as oil & gas and transportation, also drive the demand. Furthermore, technological innovation in sensor precision, miniaturization, and increased sensitivity offer opportunities for enhanced detection ability. Developing markets, particularly in developing countries, provide high growth opportunities as industrialization rises. The synergy of these elements is developing a dynamic landscape for hydrogen detection technologies, putting the market on track for high growth in the next few years.
Challenges
High Costs, Integration Challenges, and Reliability Issues Hinder Growth in the Hydrogen Detection Market
The upfront expense of installing hydrogen detection systems, such as custom sensors, can be exorbitant for most companies. The high cost usually discourages usage, especially in small companies with fewer financial resources. Moreover, hydrogen sensors can be subject to reliability concerns in extreme conditions, including temperatures or chemical exposure, and hence be less effective in certain uses. It is also difficult to integrate these systems into current industrial infrastructures and may involve drastic changes, adding to the cost. The absence of universally recognized standards for hydrogen detection technology brings about inconsistencies and regulatory complications. In addition, several industries remain uninformed about hydrogen leak risks, delaying market growth and inhibiting broad adoption of detection solutions.
By Implementation
The Fixed segment led the Hydrogen Detection Market with the largest revenue share of approximately 71% in 2023 because it has extensive use in industrial environments where constant, real-time detection of hydrogen leaks is important for safety. Fixed systems are generally deployed in high-risk locations like hydrogen production plants, refueling stations, and manufacturing facilities, where they offer continuous monitoring and assured detection, which makes them the first choice for large-scale operations that value safety and regulatory compliance.
The Portable segment is anticipated to grow at the fastest CAGR of approximately 13.67% during the forecast period of 2024-2032 as a result of the rising demand for mobile, on-the-go detection solutions across industries. Portable hydrogen detectors are flexible, user-friendly, and cost-effective, making them perfect for maintenance and inspection work. The rising concern for hydrogen safety hazards and the requirement for portable solutions to inspect confined spaces and temporary installations are fueling the rapid growth of this segment.
By End Use
The Oil & Gas industry led the Hydrogen Detection Market with the largest revenue share of approximately 32% in 2023 on account of the exigent demand for safety in hydrogen storage, transport, and refining operations. The oil and gas sector is deeply engaged in hydrogen manufacturing, storage, and sales, which necessitates ongoing detection of possible hydrogen leaks to avoid accidents. Harsh regulatory specifications and the elevated safety hazards involved in hydrogen necessitate reliable detection systems for this industry.
The Automotive segment is anticipated to grow at the fastest CAGR of roughly 13.71% during the period 2024-2032 owing to the increasing use of hydrogen fuel cell cars. With hydrogen cars gaining popularity as a clean mode of transportation compared to conventional fuel-based vehicles, the demand for hydrogen detection systems is on the rise to provide safety in fuel storage, refueling stations, and vehicle systems. The increased investment in hydrogen infrastructure and the necessity for safety measures in the automotive sector drive this segment's high growth rate.
By Detection Range
The 0-1,000 ppm segment led the Hydrogen Detection Market with the largest revenue share of approximately 41% in 2023 because it is used extensively in commercial and industrial applications where the concentration of hydrogen is generally low to moderate. The range is most suitable to detect hydrogen leaks in settings including laboratories, factories, and fueling stations. The requirement for accurate detection at these levels, along with the need for regulatory compliance for safety, has rendered the 0-1,000 ppm segment the market-leading option.
The 0-5,000 ppm segment is anticipated to register the fastest CAGR of around 12.95% during the forecast period of 2024-2032 owing to the rising use of hydrogen in bigger-scale industries like energy, oil, and gas. With rising production, storage, and transportation of hydrogen in these industries, the detection of increased levels of hydrogen becomes essential. The need for strong detection systems that can properly measure higher ppm levels in these environments is propelling this segment's fast growth.
By Technology
The Electromechanical segment dominated the Hydrogen Detection Market with the largest share of revenue amounting to roughly 35% in 2023 because it has a solid application in the delivery of good and precise hydrogen detection in diversified industries. Electromechanical sensors are more commonly used owing to their documented durability, simpleness of installation, and little maintenance needs. These sensors are suitable for permanent installation in safety-critical applications like hydrogen production, storage, and refueling stations where safety is of paramount concern and compliance with regulations must be ensured.
MEMS segment is predicted to register the fastest CAGR of approximately 15.29% during 2024 to 2032 because of their small size, low power needs, and sensitivity, which render them suitable for portable and combined hydrogen detection devices. MEMS sensors are also increasingly being applied in applications requiring real-time, mobile, and affordable monitoring systems, especially automotive, aerospace, and consumer electronics industries, where energy and space efficiency are most important.
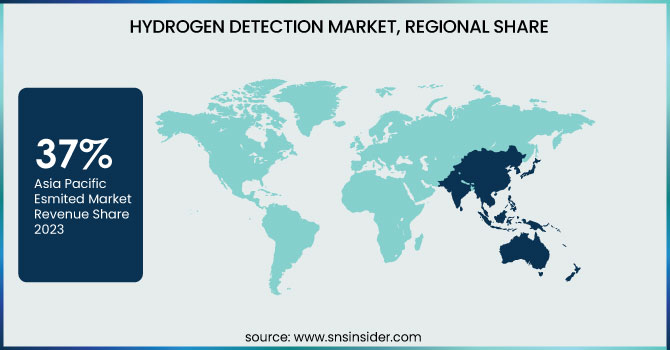
The Asia Pacific region led the Hydrogen Detection Market with the largest revenue share of approximately 37% in 2023 because the region is fast adopting hydrogen as a source of clean energy. Japan, South Korea, and China are making huge investments in hydrogen infrastructure such as production, storage, and transport systems. The increasing industrialization, government support for sustainable energy initiatives, and growing safety standards in sectors like oil, gas, and manufacturing have contributed significantly to the market dominance in this region.
North America is anticipated to grow at the fastest CAGR of approximately 13.43% during the period 2024-2032, owing to high investments in hydrogen energy and fuel cell technology. The U.S. and Canada are developing hydrogen production and infrastructure development as a component of their sustainability strategies. Increasing emphasis on hydrogen as a substitute fuel, especially in transportation and industrial sectors, combined with favorable government policies and advancements in technology, is driving the market growth of the region.
Need any customization research on Gaming Hardware Market - Inquiry Now
Teledyne Technologies (Hydrogen Sensor, Gas Detection Systems)
Honeywell International (Hydrogen Gas Detector, Searchpoint Hydrogen Detector)
Figaro Engineering (TGS Series Sensors, Gas Detection Modules)
H2Scan Corporation (Hydrogen Leak Detector, Hydrogen Sensor)
NevadaNano (MPS Hydrogen Sensor, Molecular Property Spectrometer)
Hydrogen Sense Technology (H2S Detector, Hydrogen Gas Sensors)
Membrapor (Hydrogen Sensor, Gas Detector)
Makel Engineering (Hydrogen Leak Detector, Gas Analyzer)
Archigas (Gas Sensor, Hydrogen Analyzer)
MSA Safety (ALTAIR Hydrogen Detector, Hydrogen Sensor)
Draeger (X-am 5000, DrägerSensor H2)
Riken Keiki (RKI Gas Detectors, H2 Gas Detectors)
RKI Instruments (GX-6000, GX-2009)
Industrial Scientific (GasBadge Pro, Ventis Pro Series)
City Technology (Hydrogen Sensor, Gas Detector Modules)
Teledyne Gas and Flame Detection (Detective+ Series, GasAlertMicro 5)
Crowcon Detection Instruments (Gas-Pro, T4 Multigas Detector)
Sensidyne (GasBadge Pro, Hydrogen Sensor)
GfG Instrumentation (G460, G700 Series)
Det-Tronics (X3301, Flame Detector)
In January 2025, Honeywell showcased its advanced hydrogen solutions at the Hyvolution 2025 event in Paris, highlighting its contributions to the hydrogen economy with innovative technologies for clean energy.
In 2024, Dräger introduced its advanced hydrogen detection solutions as part of its clean energy portfolio, focusing on enhancing safety for hydrogen applications in energy, transportation, and industrial sectors.
| Report Attributes | Details |
|---|---|
| Market Size in 2023 | USD 234.9 Million |
| Market Size by 2032 | USD 642.39 Million |
| CAGR | CAGR of 11.89% From 2024 to 2032 |
| Base Year | 2023 |
| Forecast Period | 2024-2032 |
| Historical Data | 2020-2022 |
| Report Scope & Coverage | Market Size, Segments Analysis, Competitive Landscape, Regional Analysis, DROC & SWOT Analysis, Forecast Outlook |
| Key Segments | • By Implementation (Fixed, Portable) • By Technology (Electromechanical, Catalytic, MOS, Thermal conductivity, MEMS) • By Detection Range (0 - 1,000 ppm, 0 – 5,000 ppm, 0 – 20,000 ppm, > 0 – 20,000 ppm) • By End Use (Oil & Gas, Automotive, Chemicals, Metal & Mining, Energy & Power, Others) |
| Regional Analysis/Coverage | North America (US, Canada, Mexico), Europe (Eastern Europe [Poland, Romania, Hungary, Turkey, Rest of Eastern Europe] Western Europe] Germany, France, UK, Italy, Spain, Netherlands, Switzerland, Austria, Rest of Western Europe]), Asia Pacific (China, India, Japan, South Korea, Vietnam, Singapore, Australia, Rest of Asia Pacific), Middle East & Africa (Middle East [UAE, Egypt, Saudi Arabia, Qatar, Rest of Middle East], Africa [Nigeria, South Africa, Rest of Africa], Latin America (Brazil, Argentina, Colombia, Rest of Latin America) |
| Company Profiles | Teledyne Technologies, Honeywell International, Figaro Engineering, H2Scan Corporation, NevadaNano, Hydrogen Sense Technology, Membrapor, Makel Engineering, Archigas, MSA Safety, Draeger, Riken Keiki, RKI Instruments, Industrial Scientific, City Technology, Teledyne Gas and Flame Detection, Crowcon Detection Instruments, Sensidyne, GfG Instrumentation, Det-Tronics. |
ANS: Hydrogen Detection Market was valued at USD 234.9 million in 2023 and is expected to reach USD 642.39 million by 2032, growing at a CAGR of 11.89% from 2024-2032.
ANS: Key drivers include rising hydrogen adoption, technological advancements, and growing safety regulations across various industries.
ANS: The Fixed segment dominated with a revenue share of approximately 71% in 2023.
ANS: The Oil & Gas industry led with a revenue share of about 32% in 2023.
ANS: North America is expected to grow at a CAGR of 13.43% from 2024 to 2032.
1. Introduction
1.1 Market Definition
1.2 Scope (Inclusion and Exclusions)
1.3 Research Assumptions
2. Executive Summary
2.1 Market Overview
2.2 Regional Synopsis
2.3 Competitive Summary
3. Research Methodology
3.1 Top-Down Approach
3.2 Bottom-up Approach
3.3. Data Validation
3.4 Primary Interviews
4. Market Dynamics Impact Analysis
4.1 Market Driving Factors Analysis
4.1.1 Drivers
4.1.2 Restraints
4.1.3 Opportunities
4.1.4 Challenges
4.2 PESTLE Analysis
4.3 Porter’s Five Forces Model
5. Statistical Insights and Trends Reporting
5.1 Adoption Rate
5.2 Technological Advancements
5.3 Regulatory Impact
5.4 Investment Trends
5.5 Cost Breakdown
6. Competitive Landscape
6.1 List of Major Companies, By Region
6.2 Market Share Analysis, By Region
6.3 Product Benchmarking
6.3.1 Product specifications and features
6.3.2 Pricing
6.4 Strategic Initiatives
6.4.1 Marketing and promotional activities
6.4.2 Distribution and supply chain strategies
6.4.3 Expansion plans and new product launches
6.4.4 Strategic partnerships and collaborations
6.5 Technological Advancements
6.6 Market Positioning and Branding
7. Hydrogen Detection Market Segmentation, By Implementation
7.1 Chapter Overview
7.2 Fixed
7.2.1 Fixed Market Trends Analysis (2020-2032)
7.2.2 Fixed Market Size Estimates and Forecasts to 2032 (USD Million)
7.3 Portable
7.3.1 Portable Market Trends Analysis (2020-2032)
7.3.2 Portable Market Size Estimates and Forecasts to 2032 (USD Million)
8. Hydrogen Detection Market Segmentation, By Technology
8.1 Chapter Overview
8.2 Electromechanical
8.2.1 Electromechanical Market Trends Analysis (2020-2032)
8.2.2 Electromechanical Market Size Estimates and Forecasts to 2032 (USD Million)
8.3 Catalytic
8.3.1 Catalytic Market Trends Analysis (2020-2032)
8.3.2 Catalytic Market Size Estimates and Forecasts to 2032 (USD Million)
8.4 MOS
8.4.1 MOS Market Trends Analysis (2020-2032)
8.4.2 MOS Market Size Estimates and Forecasts to 2032 (USD Million)
8.5 Thermal conductivity
8.5.1 Thermal conductivity Market Trends Analysis (2020-2032)
8.5.2 Thermal conductivity Market Size Estimates and Forecasts to 2032 (USD Million)
8.6 MEMS
8.6.1 MEMS Market Trends Analysis (2020-2032)
8.6.2 MEMS Market Size Estimates and Forecasts to 2032 (USD Million)
9. Hydrogen Detection Market Segmentation, By End Use
9.1 Chapter Overview
9.2 Oil & gas
9.2.1 Oil & gas Market Trends Analysis (2020-2032)
9.2.2 Oil & gas Market Size Estimates and Forecasts to 2032 (USD Million)
9.3 Automotive
9.3.1 Automotive Market Trends Analysis (2020-2032)
9.3.2 Automotive Market Size Estimates and Forecasts to 2032 (USD Million)
9.4 Chemicals
9.4.1 Chemicals Market Trends Analysis (2020-2032)
9.4.2 Chemicals Market Size Estimates and Forecasts to 2032 (USD Million)
9.5 Metal & mining
9.5.1 Metal & mining Market Trends Analysis (2020-2032)
9.5.2 Metal & mining Market Size Estimates and Forecasts to 2032 (USD Million)
9.6 Energy & power
9.6.1 Energy & power Market Trends Analysis (2020-2032)
9.6.2 Energy & power Market Size Estimates and Forecasts to 2032 (USD Million)
9.6 Others
9.6.1 Others Market Trends Analysis (2020-2032)
9.6.2 Others Market Size Estimates and Forecasts to 2032 (USD Million)
10. Hydrogen Detection Market Segmentation, By Detection Range
10.1 Chapter Overview
10.2 0 -1,000 ppm
10.2.1 0 -1,000 ppm Market Trends Analysis (2020-2032)
10.2.2 0 -1,000 ppm Market Size Estimates and Forecasts to 2032 (USD Million)
10.3 0 – 5,000 ppm
10.3.1 0 – 5,000 ppm Market Trends Analysis (2020-2032)
10.3.2 0 – 5,000 ppm Market Size Estimates and Forecasts to 2032 (USD Million)
10.4 0 – 20,000 ppm
10.4.1 0 – 20,000 ppm Market Trends Analysis (2020-2032)
10.4.2 0 – 20,000 ppm Market Size Estimates and Forecasts to 2032 (USD Million)
10.5 > 0 – 20,000 ppm
10.5.1 > 0 – 20,000 ppm Market Trends Analysis (2020-2032)
10.5.2 > 0 – 20,000 ppm Market Size Estimates and Forecasts to 2032 (USD Million)
11. Regional Analysis
11.1 Chapter Overview
11.2 North America
11.2.1 Trends Analysis
11.2.2 North America Hydrogen Detection Market Estimates and Forecasts, by Country (2020-2032) (USD Million)
11.2.3 North America Hydrogen Detection Market Estimates and Forecasts, By Implementation (2020-2032) (USD Million)
11.2.4 North America Hydrogen Detection Market Estimates and Forecasts, By Technology (2020-2032) (USD Million)
11.2.5 North America Hydrogen Detection Market Estimates and Forecasts, By End Use (2020-2032) (USD Million)
11.2.6 North America Hydrogen Detection Market Estimates and Forecasts, By Detection Range (2020-2032) (USD Million)
11.2.7 USA
11.2.7.1 USA Hydrogen Detection Market Estimates and Forecasts, By Implementation (2020-2032) (USD Million)
11.2.7.2 USA Hydrogen Detection Market Estimates and Forecasts, By Technology (2020-2032) (USD Million)
11.2.7.3 USA Hydrogen Detection Market Estimates and Forecasts, By End Use (2020-2032) (USD Million)
11.2.7.4 USA Hydrogen Detection Market Estimates and Forecasts, By Detection Range (2020-2032) (USD Million)
11.2.8 Canada
11.2.8.1 Canada Hydrogen Detection Market Estimates and Forecasts, By Implementation (2020-2032) (USD Million)
11.2.8.2 Canada Hydrogen Detection Market Estimates and Forecasts, By Technology (2020-2032) (USD Million)
11.2.8.3 Canada Hydrogen Detection Market Estimates and Forecasts, By End Use (2020-2032) (USD Million)
11.2.8.4 Canada Hydrogen Detection Market Estimates and Forecasts, By Detection Range (2020-2032) (USD Million)
11.2.9 Mexico
11.2.9.1 Mexico Hydrogen Detection Market Estimates and Forecasts, By Implementation (2020-2032) (USD Million)
11.2.9.2 Mexico Hydrogen Detection Market Estimates and Forecasts, By Technology (2020-2032) (USD Million)
11.2.9.3 Mexico Hydrogen Detection Market Estimates and Forecasts, By End Use (2020-2032) (USD Million)
11.2.9.4 Mexico Hydrogen Detection Market Estimates and Forecasts, By Detection Range (2020-2032) (USD Million)
11.3 Europe
11.3.1 Eastern Europe
11.3.1.1 Trends Analysis
11.3.1.2 Eastern Europe Hydrogen Detection Market Estimates and Forecasts, by Country (2020-2032) (USD Million)
11.3.1.3 Eastern Europe Hydrogen Detection Market Estimates and Forecasts, By Implementation (2020-2032) (USD Million)
11.3.1.4 Eastern Europe Hydrogen Detection Market Estimates and Forecasts, By Technology (2020-2032) (USD Million)
11.3.1.5 Eastern Europe Hydrogen Detection Market Estimates and Forecasts, By End Use (2020-2032) (USD Million)
11.3.1.6 Eastern Europe Hydrogen Detection Market Estimates and Forecasts, By Detection Range (2020-2032) (USD Million)
11.3.1.7 Poland
11.3.1.7.1 Poland Hydrogen Detection Market Estimates and Forecasts, By Implementation (2020-2032) (USD Million)
11.3.1.7.2 Poland Hydrogen Detection Market Estimates and Forecasts, By Technology (2020-2032) (USD Million)
11.3.1.7.3 Poland Hydrogen Detection Market Estimates and Forecasts, By End Use (2020-2032) (USD Million)
11.3.1.7.4 Poland Hydrogen Detection Market Estimates and Forecasts, By Detection Range (2020-2032) (USD Million)
11.3.1.8 Romania
11.3.1.8.1 Romania Hydrogen Detection Market Estimates and Forecasts, By Implementation (2020-2032) (USD Million)
11.3.1.8.2 Romania Hydrogen Detection Market Estimates and Forecasts, By Technology (2020-2032) (USD Million)
11.3.1.8.3 Romania Hydrogen Detection Market Estimates and Forecasts, By End Use (2020-2032) (USD Million)
11.3.1.8.4 Romania Hydrogen Detection Market Estimates and Forecasts, By Detection Range (2020-2032) (USD Million)
11.3.1.9 Hungary
11.3.1.9.1 Hungary Hydrogen Detection Market Estimates and Forecasts, By Implementation (2020-2032) (USD Million)
11.3.1.9.2 Hungary Hydrogen Detection Market Estimates and Forecasts, By Technology (2020-2032) (USD Million)
11.3.1.9.3 Hungary Hydrogen Detection Market Estimates and Forecasts, By End Use (2020-2032) (USD Million)
11.3.1.9.4 Hungary Hydrogen Detection Market Estimates and Forecasts, By Detection Range (2020-2032) (USD Million)
11.3.1.10 Turkey
11.3.1.10.1 Turkey Hydrogen Detection Market Estimates and Forecasts, By Implementation (2020-2032) (USD Million)
11.3.1.10.2 Turkey Hydrogen Detection Market Estimates and Forecasts, By Technology (2020-2032) (USD Million)
11.3.1.10.3 Turkey Hydrogen Detection Market Estimates and Forecasts, By End Use (2020-2032) (USD Million)
11.3.1.10.4 Turkey Hydrogen Detection Market Estimates and Forecasts, By Detection Range (2020-2032) (USD Million)
11.3.1.11 Rest of Eastern Europe
11.3.1.11.1 Rest of Eastern Europe Hydrogen Detection Market Estimates and Forecasts, By Implementation (2020-2032) (USD Million)
11.3.1.11.2 Rest of Eastern Europe Hydrogen Detection Market Estimates and Forecasts, By Technology (2020-2032) (USD Million)
11.3.1.11.3 Rest of Eastern Europe Hydrogen Detection Market Estimates and Forecasts, By End Use (2020-2032) (USD Million)
11.3.1.11.4 Rest of Eastern Europe Hydrogen Detection Market Estimates and Forecasts, By Detection Range (2020-2032) (USD Million)
11.3.2 Western Europe
11.3.2.1 Trends Analysis
11.3.2.2 Western Europe Hydrogen Detection Market Estimates and Forecasts, by Country (2020-2032) (USD Million)
11.3.2.3 Western Europe Hydrogen Detection Market Estimates and Forecasts, By Implementation (2020-2032) (USD Million)
11.3.2.4 Western Europe Hydrogen Detection Market Estimates and Forecasts, By Technology (2020-2032) (USD Million)
11.3.2.5 Western Europe Hydrogen Detection Market Estimates and Forecasts, By End Use (2020-2032) (USD Million)
11.3.2.6 Western Europe Hydrogen Detection Market Estimates and Forecasts, By Detection Range (2020-2032) (USD Million)
11.3.2.7 Germany
11.3.2.7.1 Germany Hydrogen Detection Market Estimates and Forecasts, By Implementation (2020-2032) (USD Million)
11.3.2.7.2 Germany Hydrogen Detection Market Estimates and Forecasts, By Technology (2020-2032) (USD Million)
11.3.2.7.3 Germany Hydrogen Detection Market Estimates and Forecasts, By End Use (2020-2032) (USD Million)
11.3.2.7.4 Germany Hydrogen Detection Market Estimates and Forecasts, By Detection Range (2020-2032) (USD Million)
11.3.2.8 France
11.3.2.8.1 France Hydrogen Detection Market Estimates and Forecasts, By Implementation (2020-2032) (USD Million)
11.3.2.8.2 France Hydrogen Detection Market Estimates and Forecasts, By Technology (2020-2032) (USD Million)
11.3.2.8.3 France Hydrogen Detection Market Estimates and Forecasts, By End Use (2020-2032) (USD Million)
11.3.2.8.4 France Hydrogen Detection Market Estimates and Forecasts, By Detection Range (2020-2032) (USD Million)
11.3.2.9 UK
11.3.2.9.1 UK Hydrogen Detection Market Estimates and Forecasts, By Implementation (2020-2032) (USD Million)
11.3.2.9.2 UK Hydrogen Detection Market Estimates and Forecasts, By Technology (2020-2032) (USD Million)
11.3.2.9.3 UK Hydrogen Detection Market Estimates and Forecasts, By End Use (2020-2032) (USD Million)
11.3.2.9.4 UK Hydrogen Detection Market Estimates and Forecasts, By Detection Range (2020-2032) (USD Million)
11.3.2.10 Italy
11.3.2.10.1 Italy Hydrogen Detection Market Estimates and Forecasts, By Implementation (2020-2032) (USD Million)
11.3.2.10.2 Italy Hydrogen Detection Market Estimates and Forecasts, By Technology (2020-2032) (USD Million)
11.3.2.10.3 Italy Hydrogen Detection Market Estimates and Forecasts, By End Use (2020-2032) (USD Million)
11.3.2.10.4 Italy Hydrogen Detection Market Estimates and Forecasts, By Detection Range (2020-2032) (USD Million)
11.3.2.11 Spain
11.3.2.11.1 Spain Hydrogen Detection Market Estimates and Forecasts, By Implementation (2020-2032) (USD Million)
11.3.2.11.2 Spain Hydrogen Detection Market Estimates and Forecasts, By Technology (2020-2032) (USD Million)
11.3.2.11.3 Spain Hydrogen Detection Market Estimates and Forecasts, By End Use (2020-2032) (USD Million)
11.3.2.11.4 Spain Hydrogen Detection Market Estimates and Forecasts, By Detection Range (2020-2032) (USD Million)
11.3.2.12 Netherlands
11.3.2.12.1 Netherlands Hydrogen Detection Market Estimates and Forecasts, By Implementation (2020-2032) (USD Million)
11.3.2.12.2 Netherlands Hydrogen Detection Market Estimates and Forecasts, By Technology (2020-2032) (USD Million)
11.3.2.12.3 Netherlands Hydrogen Detection Market Estimates and Forecasts, By End Use (2020-2032) (USD Million)
11.3.2.12.4 Netherlands Hydrogen Detection Market Estimates and Forecasts, By Detection Range (2020-2032) (USD Million)
11.3.2.13 Switzerland
11.3.2.13.1 Switzerland Hydrogen Detection Market Estimates and Forecasts, By Implementation (2020-2032) (USD Million)
11.3.2.13.2 Switzerland Hydrogen Detection Market Estimates and Forecasts, By Technology (2020-2032) (USD Million)
11.3.2.13.3 Switzerland Hydrogen Detection Market Estimates and Forecasts, By End Use (2020-2032) (USD Million)
11.3.2.13.4 Switzerland Hydrogen Detection Market Estimates and Forecasts, By Detection Range (2020-2032) (USD Million)
11.3.2.14 Austria
11.3.2.14.1 Austria Hydrogen Detection Market Estimates and Forecasts, By Implementation (2020-2032) (USD Million)
11.3.2.14.2 Austria Hydrogen Detection Market Estimates and Forecasts, By Technology (2020-2032) (USD Million)
11.3.2.14.3 Austria Hydrogen Detection Market Estimates and Forecasts, By End Use (2020-2032) (USD Million)
11.3.2.14.4 Austria Hydrogen Detection Market Estimates and Forecasts, By Detection Range (2020-2032) (USD Million)
11.3.2.15 Rest of Western Europe
11.3.2.15.1 Rest of Western Europe Hydrogen Detection Market Estimates and Forecasts, By Implementation (2020-2032) (USD Million)
11.3.2.15.2 Rest of Western Europe Hydrogen Detection Market Estimates and Forecasts, By Technology (2020-2032) (USD Million)
11.3.2.15.3 Rest of Western Europe Hydrogen Detection Market Estimates and Forecasts, By End Use (2020-2032) (USD Million)
11.3.2.15.4 Rest of Western Europe Hydrogen Detection Market Estimates and Forecasts, By Detection Range (2020-2032) (USD Million)
11.4 Asia Pacific
11.4.1 Trends Analysis
11.4.2 Asia Pacific Hydrogen Detection Market Estimates and Forecasts, by Country (2020-2032) (USD Million)
11.4.3 Asia Pacific Hydrogen Detection Market Estimates and Forecasts, By Implementation (2020-2032) (USD Million)
11.4.4 Asia Pacific Hydrogen Detection Market Estimates and Forecasts, By Technology (2020-2032) (USD Million)
11.4.5 Asia Pacific Hydrogen Detection Market Estimates and Forecasts, By End Use (2020-2032) (USD Million)
11.4.6 Asia Pacific Hydrogen Detection Market Estimates and Forecasts, By Detection Range (2020-2032) (USD Million)
11.4.7 China
11.4.7.1 China Hydrogen Detection Market Estimates and Forecasts, By Implementation (2020-2032) (USD Million)
11.4.7.2 China Hydrogen Detection Market Estimates and Forecasts, By Technology (2020-2032) (USD Million)
11.4.7.3 China Hydrogen Detection Market Estimates and Forecasts, By End Use (2020-2032) (USD Million)
11.4.7.4 China Hydrogen Detection Market Estimates and Forecasts, By Detection Range (2020-2032) (USD Million)
11.4.8 India
11.4.8.1 India Hydrogen Detection Market Estimates and Forecasts, By Implementation (2020-2032) (USD Million)
11.4.8.2 India Hydrogen Detection Market Estimates and Forecasts, By Technology (2020-2032) (USD Million)
11.4.8.3 India Hydrogen Detection Market Estimates and Forecasts, By End Use (2020-2032) (USD Million)
11.4.8.4 India Hydrogen Detection Market Estimates and Forecasts, By Detection Range (2020-2032) (USD Million)
11.4.9 Japan
11.4.9.1 Japan Hydrogen Detection Market Estimates and Forecasts, By Implementation (2020-2032) (USD Million)
11.4.9.2 Japan Hydrogen Detection Market Estimates and Forecasts, By Technology (2020-2032) (USD Million)
11.4.9.3 Japan Hydrogen Detection Market Estimates and Forecasts, By End Use (2020-2032) (USD Million)
11.4.9.4 Japan Hydrogen Detection Market Estimates and Forecasts, By Detection Range (2020-2032) (USD Million)
11.4.10 South Korea
11.4.10.1 South Korea Hydrogen Detection Market Estimates and Forecasts, By Implementation (2020-2032) (USD Million)
11.4.10.2 South Korea Hydrogen Detection Market Estimates and Forecasts, By Technology (2020-2032) (USD Million)
11.4.10.3 South Korea Hydrogen Detection Market Estimates and Forecasts, By End Use (2020-2032) (USD Million)
11.4.10.4 South Korea Hydrogen Detection Market Estimates and Forecasts, By Detection Range (2020-2032) (USD Million)
11.4.11 Vietnam
11.4.11.1 Vietnam Hydrogen Detection Market Estimates and Forecasts, By Implementation (2020-2032) (USD Million)
11.4.11.2 Vietnam Hydrogen Detection Market Estimates and Forecasts, By Technology (2020-2032) (USD Million)
11.4.11.3 Vietnam Hydrogen Detection Market Estimates and Forecasts, By End Use (2020-2032) (USD Million)
11.4.11.4 Vietnam Hydrogen Detection Market Estimates and Forecasts, By Detection Range (2020-2032) (USD Million)
11.4.12 Singapore
11.4.12.1 Singapore Hydrogen Detection Market Estimates and Forecasts, By Implementation (2020-2032) (USD Million)
11.4.12.2 Singapore Hydrogen Detection Market Estimates and Forecasts, By Technology (2020-2032) (USD Million)
11.4.12.3 Singapore Hydrogen Detection Market Estimates and Forecasts, By End Use (2020-2032) (USD Million)
11.4.12.4 Singapore Hydrogen Detection Market Estimates and Forecasts, By Detection Range (2020-2032) (USD Million)
11.4.13 Australia
11.4.13.1 Australia Hydrogen Detection Market Estimates and Forecasts, By Implementation (2020-2032) (USD Million)
11.4.13.2 Australia Hydrogen Detection Market Estimates and Forecasts, By Technology (2020-2032) (USD Million)
11.4.13.3 Australia Hydrogen Detection Market Estimates and Forecasts, By End Use (2020-2032) (USD Million)
11.4.13.4 Australia Hydrogen Detection Market Estimates and Forecasts, By Detection Range (2020-2032) (USD Million)
11.4.14 Rest of Asia Pacific
11.4.14.1 Rest of Asia Pacific Hydrogen Detection Market Estimates and Forecasts, By Implementation (2020-2032) (USD Million)
11.4.14.2 Rest of Asia Pacific Hydrogen Detection Market Estimates and Forecasts, By Technology (2020-2032) (USD Million)
11.4.14.3 Rest of Asia Pacific Hydrogen Detection Market Estimates and Forecasts, By End Use (2020-2032) (USD Million)
11.4.14.4 Rest of Asia Pacific Hydrogen Detection Market Estimates and Forecasts, By Detection Range (2020-2032) (USD Million)
11.5 Middle East and Africa
11.5.1 Middle East
11.5.1.1 Trends Analysis
11.5.1.2 Middle East Hydrogen Detection Market Estimates and Forecasts, by Country (2020-2032) (USD Million)
11.5.1.3 Middle East Hydrogen Detection Market Estimates and Forecasts, By Implementation (2020-2032) (USD Million)
11.5.1.4 Middle East Hydrogen Detection Market Estimates and Forecasts, By Technology (2020-2032) (USD Million)
11.5.1.5 Middle East Hydrogen Detection Market Estimates and Forecasts, By End Use (2020-2032) (USD Million)
11.5.1.6 Middle East Hydrogen Detection Market Estimates and Forecasts, By Detection Range (2020-2032) (USD Million)
11.5.1.7 UAE
11.5.1.7.1 UAE Hydrogen Detection Market Estimates and Forecasts, By Implementation (2020-2032) (USD Million)
11.5.1.7.2 UAE Hydrogen Detection Market Estimates and Forecasts, By Technology (2020-2032) (USD Million)
11.5.1.7.3 UAE Hydrogen Detection Market Estimates and Forecasts, By End Use (2020-2032) (USD Million)
11.5.1.7.4 UAE Hydrogen Detection Market Estimates and Forecasts, By Detection Range (2020-2032) (USD Million)
11.5.1.8 Egypt
11.5.1.8.1 Egypt Hydrogen Detection Market Estimates and Forecasts, By Implementation (2020-2032) (USD Million)
11.5.1.8.2 Egypt Hydrogen Detection Market Estimates and Forecasts, By Technology (2020-2032) (USD Million)
11.5.1.8.3 Egypt Hydrogen Detection Market Estimates and Forecasts, By End Use (2020-2032) (USD Million)
11.5.1.8.4 Egypt Hydrogen Detection Market Estimates and Forecasts, By Detection Range (2020-2032) (USD Million)
11.5.1.9 Saudi Arabia
11.5.1.9.1 Saudi Arabia Hydrogen Detection Market Estimates and Forecasts, By Implementation (2020-2032) (USD Million)
11.5.1.9.2 Saudi Arabia Hydrogen Detection Market Estimates and Forecasts, By Technology (2020-2032) (USD Million)
11.5.1.9.3 Saudi Arabia Hydrogen Detection Market Estimates and Forecasts, By End Use (2020-2032) (USD Million)
11.5.1.9.4 Saudi Arabia Hydrogen Detection Market Estimates and Forecasts, By Detection Range (2020-2032) (USD Million)
11.5.1.10 Qatar
11.5.1.10.1 Qatar Hydrogen Detection Market Estimates and Forecasts, By Implementation (2020-2032) (USD Million)
11.5.1.10.2 Qatar Hydrogen Detection Market Estimates and Forecasts, By Technology (2020-2032) (USD Million)
11.5.1.10.3 Qatar Hydrogen Detection Market Estimates and Forecasts, By End Use (2020-2032) (USD Million)
11.5.1.10.4 Qatar Hydrogen Detection Market Estimates and Forecasts, By Detection Range (2020-2032) (USD Million)
11.5.1.11 Rest of Middle East
11.5.1.11.1 Rest of Middle East Hydrogen Detection Market Estimates and Forecasts, By Implementation (2020-2032) (USD Million)
11.5.1.11.2 Rest of Middle East Hydrogen Detection Market Estimates and Forecasts, By Technology (2020-2032) (USD Million)
11.5.1.11.3 Rest of Middle East Hydrogen Detection Market Estimates and Forecasts, By End Use (2020-2032) (USD Million)
11.5.1.11.4 Rest of Middle East Hydrogen Detection Market Estimates and Forecasts, By Detection Range (2020-2032) (USD Million)
11.5.2 Africa
11.5.2.1 Trends Analysis
11.5.2.2 Africa Hydrogen Detection Market Estimates and Forecasts, by Country (2020-2032) (USD Million)
11.5.2.3 Africa Hydrogen Detection Market Estimates and Forecasts, By Implementation (2020-2032) (USD Million)
11.5.2.4 Africa Hydrogen Detection Market Estimates and Forecasts, By Technology (2020-2032) (USD Million)
11.5.2.5 Africa Hydrogen Detection Market Estimates and Forecasts, By End Use (2020-2032) (USD Million)
11.5.2.6 Africa Hydrogen Detection Market Estimates and Forecasts, By Detection Range (2020-2032) (USD Million)
11.5.2.7 South Africa
11.5.2.7.1 South Africa Hydrogen Detection Market Estimates and Forecasts, By Implementation (2020-2032) (USD Million)
11.5.2.7.2 South Africa Hydrogen Detection Market Estimates and Forecasts, By Technology (2020-2032) (USD Million)
11.5.2.7.3 South Africa Hydrogen Detection Market Estimates and Forecasts, By End Use (2020-2032) (USD Million)
11.5.2.7.4 South Africa Hydrogen Detection Market Estimates and Forecasts, By Detection Range (2020-2032) (USD Million)
11.5.2.8 Nigeria
11.5.2.8.1 Nigeria Hydrogen Detection Market Estimates and Forecasts, By Implementation (2020-2032) (USD Million)
11.5.2.8.2 Nigeria Hydrogen Detection Market Estimates and Forecasts, By Technology (2020-2032) (USD Million)
11.5.2.8.3 Nigeria Hydrogen Detection Market Estimates and Forecasts, By End Use (2020-2032) (USD Million)
11.5.2.8.4 Nigeria Hydrogen Detection Market Estimates and Forecasts, By Detection Range (2020-2032) (USD Million)
11.5.2.9 Rest of Africa
11.5.2.9.1 Rest of Africa Hydrogen Detection Market Estimates and Forecasts, By Implementation (2020-2032) (USD Million)
11.5.2.9.2 Rest of Africa Hydrogen Detection Market Estimates and Forecasts, By Technology (2020-2032) (USD Million)
11.5.2.9.3 Rest of Africa Hydrogen Detection Market Estimates and Forecasts, By End Use (2020-2032) (USD Million)
11.5.2.9.4 Rest of Africa Hydrogen Detection Market Estimates and Forecasts, By Detection Range (2020-2032) (USD Million)
11.6 Latin America
11.6.1 Trends Analysis
11.6.2 Latin America Hydrogen Detection Market Estimates and Forecasts, by Country (2020-2032) (USD Million)
11.6.3 Latin America Hydrogen Detection Market Estimates and Forecasts, By Implementation (2020-2032) (USD Million)
11.6.4 Latin America Hydrogen Detection Market Estimates and Forecasts, By Technology (2020-2032) (USD Million)
11.6.5 Latin America Hydrogen Detection Market Estimates and Forecasts, By End Use (2020-2032) (USD Million)
11.6.6 Latin America Hydrogen Detection Market Estimates and Forecasts, By Detection Range (2020-2032) (USD Million)
11.6.7 Brazil
11.6.7.1 Brazil Hydrogen Detection Market Estimates and Forecasts, By Implementation (2020-2032) (USD Million)
11.6.7.2 Brazil Hydrogen Detection Market Estimates and Forecasts, By Technology (2020-2032) (USD Million)
11.6.7.3 Brazil Hydrogen Detection Market Estimates and Forecasts, By End Use (2020-2032) (USD Million)
11.6.7.4 Brazil Hydrogen Detection Market Estimates and Forecasts, By Detection Range (2020-2032) (USD Million)
11.6.8 Argentina
11.6.8.1 Argentina Hydrogen Detection Market Estimates and Forecasts, By Implementation (2020-2032) (USD Million)
11.6.8.2 Argentina Hydrogen Detection Market Estimates and Forecasts, By Technology (2020-2032) (USD Million)
11.6.8.3 Argentina Hydrogen Detection Market Estimates and Forecasts, By End Use (2020-2032) (USD Million)
11.6.8.4 Argentina Hydrogen Detection Market Estimates and Forecasts, By Detection Range (2020-2032) (USD Million)
11.6.9 Colombia
11.6.9.1 Colombia Hydrogen Detection Market Estimates and Forecasts, By Implementation (2020-2032) (USD Million)
11.6.9.2 Colombia Hydrogen Detection Market Estimates and Forecasts, By Technology (2020-2032) (USD Million)
11.6.9.3 Colombia Hydrogen Detection Market Estimates and Forecasts, By End Use (2020-2032) (USD Million)
11.6.9.4 Colombia Hydrogen Detection Market Estimates and Forecasts, By Detection Range (2020-2032) (USD Million)
11.6.10 Rest of Latin America
11.6.10.1 Rest of Latin America Hydrogen Detection Market Estimates and Forecasts, By Implementation (2020-2032) (USD Million)
11.6.10.2 Rest of Latin America Hydrogen Detection Market Estimates and Forecasts, By Technology (2020-2032) (USD Million)
11.6.10.3 Rest of Latin America Hydrogen Detection Market Estimates and Forecasts, By End Use (2020-2032) (USD Million)
11.6.10.4 Rest of Latin America Hydrogen Detection Market Estimates and Forecasts, By Detection Range (2020-2032) (USD Million)
12. Company Profiles
12.1 Teledyne Technologies
12.1.1 Company Overview
12.1.2 Financial
12.1.3 Products/ Services Offered
12.1.4 SWOT Analysis
12.2 Honeywell International
12.2.1 Company Overview
12.2.2 Financial
12.2.3 Products/ Services Offered
12.2.4 SWOT Analysis
12.3 Figaro Engineering
12.3.1 Company Overview
12.3.2 Financial
12.3.3 Products/ Services Offered
12.3.4 SWOT Analysis
12.4 H2Scan Corporation
12.4.1 Company Overview
12.4.2 Financial
12.4.3 Products/ Services Offered
12.4.4 SWOT Analysis
12.5 NevadaNano
12.5.1 Company Overview
12.5.2 Financial
12.5.3 Products/ Services Offered
12.5.4 SWOT Analysis
12.6 Hydrogen Sense Technology
12.6.1 Company Overview
12.6.2 Financial
12.6.3 Products/ Services Offered
12.6.4 SWOT Analysis
12.7 Membrapor
12.7.1 Company Overview
12.7.2 Financial
12.7.3 Products/ Services Offered
12.7.4 SWOT Analysis
12.8 Makel Engineering
12.8.1 Company Overview
12.8.2 Financial
12.8.3 Products/ Services Offered
12.8.4 SWOT Analysis
12.9 Archigas
12.9.1 Company Overview
12.9.2 Financial
12.9.3 Products/ Services Offered
12.9.4 SWOT Analysis
12.10 MSA Safety
12.10.1 Company Overview
12.10.2 Financial
12.10.3 Products/ Services Offered
12.10.4 SWOT Analysis
13. Use Cases and Best Practices
14. Conclusion
An accurate research report requires proper strategizing as well as implementation. There are multiple factors involved in the completion of good and accurate research report and selecting the best methodology to compete the research is the toughest part. Since the research reports we provide play a crucial role in any company’s decision-making process, therefore we at SNS Insider always believe that we should choose the best method which gives us results closer to reality. This allows us to reach at a stage wherein we can provide our clients best and accurate investment to output ratio.
Each report that we prepare takes a timeframe of 350-400 business hours for production. Starting from the selection of titles through a couple of in-depth brain storming session to the final QC process before uploading our titles on our website we dedicate around 350 working hours. The titles are selected based on their current market cap and the foreseen CAGR and growth.
The 5 steps process:
Step 1: Secondary Research:
Secondary Research or Desk Research is as the name suggests is a research process wherein, we collect data through the readily available information. In this process we use various paid and unpaid databases which our team has access to and gather data through the same. This includes examining of listed companies’ annual reports, Journals, SEC filling etc. Apart from this our team has access to various associations across the globe across different industries. Lastly, we have exchange relationships with various university as well as individual libraries.

Step 2: Primary Research
When we talk about primary research, it is a type of study in which the researchers collect relevant data samples directly, rather than relying on previously collected data. This type of research is focused on gaining content specific facts that can be sued to solve specific problems. Since the collected data is fresh and first hand therefore it makes the study more accurate and genuine.
We at SNS Insider have divided Primary Research into 2 parts.
Part 1 wherein we interview the KOLs of major players as well as the upcoming ones across various geographic regions. This allows us to have their view over the market scenario and acts as an important tool to come closer to the accurate market numbers. As many as 45 paid and unpaid primary interviews are taken from both the demand and supply side of the industry to make sure we land at an accurate judgement and analysis of the market.
This step involves the triangulation of data wherein our team analyses the interview transcripts, online survey responses and observation of on filed participants. The below mentioned chart should give a better understanding of the part 1 of the primary interview.

Part 2: In this part of primary research the data collected via secondary research and the part 1 of the primary research is validated with the interviews from individual consultants and subject matter experts.
Consultants are those set of people who have at least 12 years of experience and expertise within the industry whereas Subject Matter Experts are those with at least 15 years of experience behind their back within the same space. The data with the help of two main processes i.e., FGDs (Focused Group Discussions) and IDs (Individual Discussions). This gives us a 3rd party nonbiased primary view of the market scenario making it a more dependable one while collation of the data pointers.
Step 3: Data Bank Validation
Once all the information is collected via primary and secondary sources, we run that information for data validation. At our intelligence centre our research heads track a lot of information related to the market which includes the quarterly reports, the daily stock prices, and other relevant information. Our data bank server gets updated every fortnight and that is how the information which we collected using our primary and secondary information is revalidated in real time.

Step 4: QA/QC Process
After all the data collection and validation our team does a final level of quality check and quality assurance to get rid of any unwanted or undesired mistakes. This might include but not limited to getting rid of the any typos, duplication of numbers or missing of any important information. The people involved in this process include technical content writers, research heads and graphics people. Once this process is completed the title gets uploader on our platform for our clients to read it.
Step 5: Final QC/QA Process:
This is the last process and comes when the client has ordered the study. In this process a final QA/QC is done before the study is emailed to the client. Since we believe in giving our clients a good experience of our research studies, therefore, to make sure that we do not lack at our end in any way humanly possible we do a final round of quality check and then dispatch the study to the client.
By Implementation
Fixed
Portable
By Technology
Electromechanical
Catalytic
MOS
Thermal conductivity
MEMS
By Detection Range
0 -1,000 ppm
0 – 5,000 ppm
0 – 20,000 ppm
> 0 – 20,000 ppm
By End Use
Oil & gas
Automotive
Chemicals
Metal & mining
Energy & power
Others
Request for Segment Customization as per your Business Requirement: Segment Customization Request
Regional Coverage:
North America
US
Canada
Mexico
Europe
Eastern Europe
Poland
Romania
Hungary
Turkey
Rest of Eastern Europe
Western Europe
Germany
France
UK
Italy
Spain
Netherlands
Switzerland
Austria
Rest of Western Europe
Asia Pacific
China
India
Japan
South Korea
Vietnam
Singapore
Australia
Rest of Asia Pacific
Middle East & Africa
Middle East
UAE
Egypt
Saudi Arabia
Qatar
Rest of Middle East
Africa
Nigeria
South Africa
Rest of Africa
Latin America
Brazil
Argentina
Colombia
Rest of Latin America
Request for Country Level Research Report: Country Level Customization Request
Available Customization
With the given market data, SNS Insider offers customization as per the company’s specific needs. The following customization options are available for the report:
Detailed Volume Analysis
Criss-Cross segment analysis (e.g. Product X Application)
Competitive Product Benchmarking
Geographic Analysis
Additional countries in any of the regions
Customized Data Representation
Detailed analysis and profiling of additional market players
The Semiconductor Foundry Market size is expected to be valued at USD 118.60 Billion in 2023. It is estimated to reach USD 211.34 Billion by 2032 with a CAGR of 6.63% over the forecast period 2024-2032.
The Gas-Insulated Switchgear (GIS) Market size was valued at USD 26.87 billion in 2023 and is expected to reach USD 46.49 billion by 2032. It will grow at a CAGR of 6.32% over the forecast period 2024-2032.
The Instrument Cluster Market size was valued at USD 10.9 billion in 2023 and is expected to grow to USD 15.8 billion by 2032 and grow at a CAGR Of 4.2 % over the forecast period of 2024-2032.
The Electrical Enclosures Market size was $ 7.91 Billion in 2023 and is estimated to Reach USD 13.95 billion by 2032 and grow at a CAGR of 6.56% over the forecast period of 2024-2032.
The Rugged Display Market Size was valued at USD 10.63 Billion in 2023 and is expected to reach USD 18.02 Billion by 2032 and grow at a CAGR of 6.08% over the forecast period 2024-2032.
The Service Robotics Market size was valued at USD 42.13 billion in 2023 and is expected to reach USD 146.82 billion by 2032 and grow at a CAGR of 14.88% over the forecast period 2024-2032.

Hi! Click one of our member below to chat on Phone
© 2025 All Rights Reserved by SNS Insider Pvt Ltd


