Get E-PDF Sample Report on Hydrocolloids Market - Request Sample Report
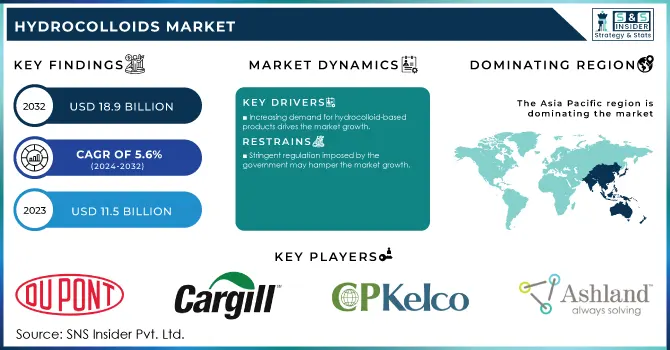
The Hydrocolloids Market was USD 11.5 billion in 2023 and is expected to reach USD 18.9 billion by 2032, growing at a CAGR of 5.6% over the forecast period of 2024-2032.
The hydrocolloids market has witnessed a growing consumer demand for natural ingredients due to an increasing preference for clean-label and plant-based products. With increasing knowledge regarding the health hazards of synthetic additives, consumers now prefer food and drinks with natural ingredients. Hydrocolloids, on the other hand, are more favored since they have a natural origin and functional properties, and these components are obtained from seaweed (carrageenan and agar), plant exudates (gum arabic), and microbial fermentation (xanthan gum). These components improve texture, stability, and shelf life, and have greater stability and shelf life, but they also cater to the trend toward sustainability and environmental responsibility. Growing natural additives acceptance by several regulatory agencies and food safety organizations is also accelerating the hydrocolloids market in various applications including food, beverages, pharmaceuticals, and cosmetics.
The U.S. FDA has enforced stringent guidelines under the Food Allergen Labeling and Consumer Protection Act (FALCPA). This act mandates the declaration of major food allergens on labels, including sesame, which was added as the ninth major allergen in January 2023.
Innovation in food formulation is driving hydrocolloid market for manufacturers who are exploring opportunities for new product functionality, health benefits, and consumer demand for different sensory experiences. Hydrocolloids are widely used for texture modification, stabilization of formulations, and clean-label solutions and are finding new applications in innovative areas, including reduced-calorie and gluten-free products. The progress of technology is allowing the hydrocolloids with specific features, such as temperature-stable or more gelling capacity to be extracted and exploited. Apart from ensuring that food and beverage products are of higher quality, these innovations follow the trend of plant-based diet and sustainability. Furthermore, investigations on blended hydrocolloids are developing synergistic action on textural and shelf-life improvement, thereby broadening the space of utilization of these components in contemporary food formulations. This trend showcases the industry's dedication to satisfying changing consumer preferences while solving technical hurdles.
In 2023, the U.S. Department of Agriculture (USDA) supported research initiatives aimed at enhancing the use of natural hydrocolloids in developing low-fat and gluten-free food products, aligning with dietary trends.
Increasing demand for hydrocolloid-based products drives the market growth.
Rising demand from the cosmetics industry drives the market growth.
The hydrocolloids market is driven in particular by the rising demand for these ingredients from the cosmetics industry, owing to their multifunctional properties in formulating products. In the cosmetics industry, hydrocolloids like xanthan gum, carrageenan, and alginates are used to stabilize emulsions, improve texture, and as thickeners for creams, lotions, and gels. An increase in demand for sustainable and organic cosmetic products that come from natural origin and are compatible with clean-label formulated products is also helping to drive the above-mentioned trend.
In addition, the increasing applications in cosmetic formulations, such as anti-aging and hydration products, are expected to contribute to the demand for hydrocolloids owing to their hydration and film-forming properties. Hydrocolloids also get the edge because they meet safety and efficacy benchmarks, such as the approximate cosmetic safety standards for masking agents that many cosmetics companies in the E.U. must meet and the E.U. Regulations that mandate the use of safe and sustainable ingredients, making the hydrocolloids adoption mandatory under the government regulations such as in the U.S. FDA. Altogether, these factors play role in the expansion of hydrocolloids integration in cosmetics industry and thus support the market growth.
In 2024, Alland & Robert, launched syndeo gelling, a plant-based texture agent to replace such gelatin-based products while ensuring extreme Vegan ability. The natural and sustainable hydrocolloids for cosmetic formulations market is characterized by the presence of leading companies such as CP Kelco, DSM, and Tate & Lyle focusing on expansion and innovation to establish a high market share
Restraint
Stringent regulation imposed by the government may hamper the market growth.
The growth of the hydrocolloids market can be hindered by stringent regulations imposed by the governing bodies. Regulatory frameworks are growing more convoluted, particularly about food safety, labeling, and ingredient approval systems. Hydrocolloids are regulated in several parts of the world, for example, the European Union, and the United States, mainly due to their use in food, cosmetics, and pharmaceutical products. New hydrocolloid-based ingredients require extensive safety assessments and the approval process is costly and time-consuming, heavily regulated by the European Food Safety Authority (EFSA) and the U.S. Food and Drug Administration (FDA). As an illustration, detailed toxicological assessments are required for new food additives (hydrocolloids included) before they can be commercialized which frequently results in extended lead times for approval. Similarly, it has been stressed over the demand for traceability and "clean-label" products from consumers which have driven an increase in the number of regulations imposed by governments to address labeling, thereby increasing compliance costs for manufacturers.
By Product
Gelatin held the largest market share segment around 30% in 2023. The hydrocolloids market is saturated with gelatin which is widely used in food and Pharmaceuticals also in cosmetics, there has been high demand for it, which makes it hold the largest share in the hydrocolloids market. As a gelling agent, stabilizer, or thickener, it is considered a widely used ingredient in a variety of products, such as gummy candies, marshmallows, yogurt, and capsules. The unique properties of gelatin such as gel-forming functionality, texture building, and mouthfeel enhancement property make it an unbeatable option for food manufacturers who look for stability, quality & premium formulations.
By Function
The thickening function segment held the largest market share around 28% in 2023. This is because of its critical use in various industries, especially food, cosmetics, and pharmaceuticals industry. In food processing, they play a vital role in providing such texture and consistency to the products which is otherwise hard to achieve; in saucing, dressing, soup, dairy products, drinks, or anything that the commercial sector beautifies. Such hydrocolloids as xanthan gum, guar gum, and gelatin are widely used for these purposes as the hydrocolloids stabilize and change the viscosity and mouthful of products, and date to date have a constant character and quality.
By Application
Food & Beverage held the largest market share around 65% in 2023. It is owing to its crucial role in improving the texture, stability & functional properties of a variety of food products. Hydrocolloids-xanthan gum, guar gum, pectin, gelatin, etc-are essential for thickening, gelling, stabilizing, and emulsifying functions in the food industry, where the desired consistency and mouthfeel are needed in multiple products, including sauces, dressings, beverages, dairy, and confectionery. However, with the changing demand of consumers who have started to prefer cleaner labels, natural ingredients, and functional foods, this will in turn propel the hydrocolloids demand upward. These ingredients are high in demand because of the rising demand for gluten-free, low calories and plant-based food formulations which makes them widely used over food formulations
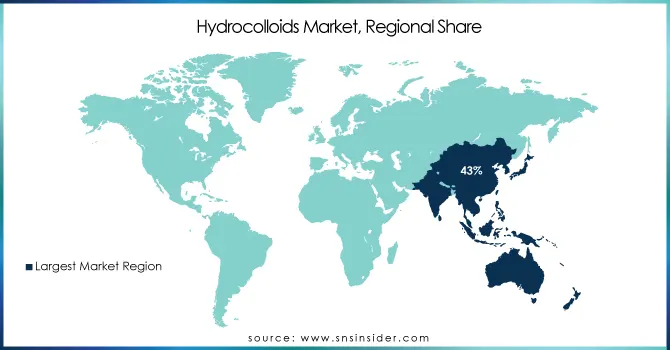
Asia Pacific held the largest market share around 43% in 2023. This is driven by various factors such as the rapid growth in industrial growth, rise in consumer demand for processed and convenience foods, and breakthroughs in food processing technologies. The population in this region is huge with varied demand for different food and beverage products, which will create a need for hydrocolloids used for stabilizers, thickening agents & gelling agents for several applications. China and India are rapidly growing economies having increasing disposable income and a transition phase in dietary habits towards processed, packaged, and convenience foods with high dependency on hydrocolloids for textural, shelf life, and consistency purposes.
Beyond food and beverage, the rising cosmetics and pharmaceutical industries in Asia Pacific further contribute to the market potential for hydrocolloids. Due to increasing consumer familiarity with skincare and personal care products across various countries Japan, South Korea, and China, in particular, the use of hydrocolloids in formulations used in creams, lotions, and gels is on the rise.
Get Customized Report as Per Your Business Requirement - Request For Customized Report
Key Players
E. I. du Pont de Nemours and Company (Xanthan Gum, Guar Gum)
Cargill, Inc. (Hydroxypropyl Distarch Phosphate, Cargill Gelatin)
CP Kelco (Xanthan Gum, Gellan Gum)
Ashland Inc. (Acrylates Copolymer, Hydroxyethylcellulose)
Lubrizol Corporation (Carbopol, Pemulen)
Rousselot S.A.S. (Gelatin, Peptan)
Kerry Group PLC (Kerry Gelatin, Hydrocolloid Blends)
Darling Ingredients Inc. (Gelatin, Collagen Hydrolysates)
Fuerst Day Lawson (Agar, Guar Gum)
TIC GUMS Inc. (TIC Pretested Gums, TIC Organic Gums)
Ingredion Incorporated (Novation, ClearGel)
Tate & Lyle PLC (Tate & Lyle Gellan, Litesse)
DSM Nutritional Products (Keltrol, Gelatine)
Gelita AG (Gelatin, Collagen Peptides)
DuPont Nutrition & Biosciences (E464 Hydroxypropyl Methylcellulose, Xanthan Gum)
Lonza Group (Methylcellulose, Hydroxypropyl Methylcellulose)
The Archer Daniels Midland Company (ADM) (Starch, Xantham Gum)
Naturex (Givaudan) (Pectin, Guar Gum)
FMC Corporation (Xanthan Gum, CMC)
BASF SE (Lupanol, Lupa-Ag)
Recent Development:
In 2023, DuPont launched its new portfolio of sustainable, clean-label ingredients for the food and beverage market seeking replicas of synthetic thickeners and stabilizers. The move towards natural and healthier ingredients have become a wider trend.
In 2024, CP Kelco introduced innovative hydrocolloid-based products to improve product performance in the clean-label segment. Their ingredients are designed to enhance food texture while using natural products.
Report Attributes | Details |
---|---|
Market Size in 2023 | US$ 11.5 Billion |
Market Size by 2032 | US$ 18.9 Billion |
CAGR | CAGR of 5.6% From 2024 to 2032 |
Base Year | 2023 |
Forecast Period | 2024-2032 |
Historical Data | 2020-2022 |
Report Scope & Coverage | Market Size, Segments Analysis, Competitive Landscape, Regional Analysis, DROC & SWOT Analysis, Forecast Outlook |
Key Segments | • By Product (Gelatin, Xanthan Gum, Carrageenan, Alginates, Pectin, Guar Gum, Gum Arabic, Agar, Other) • By Function (Thickening, Gelling, Stabilizing, Fat Replacing, Coating Material, Others) • By Application (Food & Beverage, Pharmaceutical, Personal Care & Cosmetics, Others) |
Regional Analysis/Coverage | North America (US, Canada, Mexico), Europe (Eastern Europe [Poland, Romania, Hungary, Turkey, Rest of Eastern Europe] Western Europe] Germany, France, UK, Italy, Spain, Netherlands, Switzerland, Austria, Rest of Western Europe]), Asia Pacific (China, India, Japan, South Korea, Vietnam, Singapore, Australia, Rest of Asia Pacific), Middle East & Africa (Middle East [UAE, Egypt, Saudi Arabia, Qatar, Rest of Middle East], Africa [Nigeria, South Africa, Rest of Africa], Latin America (Brazil, Argentina, Colombia, Rest of Latin America) |
Company Profiles | E. I. du Pont de Nemours and Company, Cargill, Inc., CP Kelco, Ashland Inc., Lubrizol Corporation, Rousselot S.A.S., Kerry Group PLC, Darling Ingredients Inc., Fuerst Day Lawson, TIC GUMS Inc., Ingredion Incorporated, Tate & Lyle PLC, DSM Nutritional Products, Gelita AG, DuPont Nutrition & Biosciences, Lonza Group, The Archer Daniels Midland Company , Naturex , FMC Corporation, BASF SE, and Others |
Key Drivers | • Increasing demand for hydrocolloid-based products drives the market growth. • Rising demand from the cosmetics industry drives the market growth. |
RESTRAINTS | • Stringent regulation imposed by the government may hamper the market growth. |
The Hydrocolloids Market size is expected to reach USD 18.9 billion in 2032.
The expected CAGR of the global Hydrocolloids Market during the forecast period is 5.6%.
The major key players are E. I. du Pont de Nemours and Company, Cargill, Inc., CP Kelco, Ashland Inc., Lubrizol Corporation, Rousselot S.A.S., Kerry Group PLC., Darling Ingredients Inc., Fuerst Day Lawson, TIC GUMs Inc.
Asia-Pacific contributes major to the Hydrocolloids Market.
Increasing demand for hydrocolloid-based products, Rising demand from the cosmetics industry, Growing utilization as a thickening and gelling applications, Increasing popularity in the food industry, Increasing consumption of clean-label food products, and Increased R&D in the hydrocolloids are the key driving factors of Hydrocolloids Market globally.
Table of Contents:
1. Introduction
1.1 Market Definition
1.2 Scope (Inclusion and Exclusions)
1.3 Research Assumptions
2. Executive Summary
2.1 Market Overview
2.2 Regional Synopsis
2.3 Competitive Summary
3. Research Methodology
3.1 Top-Down Approach
3.2 Bottom-up Approach
3.3. Data Validation
3.4 Primary Interviews
4. Market Dynamics Impact Analysis
4.1 Market Driving Factors Analysis
4.1.1 Drivers
4.1.2 Restraints
4.1.3 Opportunities
4.1.4 Challenges
4.2 PESTLE Analysis
4.3 Porter’s Five Forces Model
5. Statistical Insights and Trends Reporting
5.1 By Production Capacity and Utilization, by Country, By Type, 2023
5.2 Feedstock Prices, by Country, By Type, 2023
5.3 Regulatory Impact, by l Country, By Type, 2023.
5.4 Environmental Metrics: Emissions Data, Waste Management Practices, and Sustainability Initiatives, by Region
5.5 Innovation and R&D, Product, 2023
6. Competitive Landscape
6.1 List of Major Companies, By Region
6.2 Market Share Analysis, By Region
6.3 Product Benchmarking
6.3.1 Product specifications and features
6.3.2 Pricing
6.4 Strategic Initiatives
6.4.1 Marketing and promotional activities
6.4.2 Distribution and Supply Chain Strategies
6.4.3 Expansion plans and new product launches
6.4.4 Strategic partnerships and collaborations
6.5 Technological Advancements
6.6 Market Positioning and Branding
7. Hydrocolloids Market Segmentation, by Product
7.1 Chapter Overview
7.2 Gelatin
7.2.1 Gelatin Market Trends Analysis (2020-2032)
7.2.2 Gelatin Market Size Estimates and Forecasts to 2032 (USD Billion)
7.3 Xanthan Gum
7.3.1 Xanthan Gum Market Trends Analysis (2020-2032)
7.3.2 Xanthan Gum Market Size Estimates and Forecasts to 2032 (USD Billion)
7.4 Carrageenan
7.4.1 Carrageenan Market Trends Analysis (2020-2032)
7.4.2 Carrageenan Market Size Estimates and Forecasts to 2032 (USD Billion)
7.5 Alginates
7.5.1 Alginates Market Trends Analysis (2020-2032)
7.5.2 Alginates Market Size Estimates and Forecasts to 2032 (USD Billion)
7.6 Pectin
7.6.1 Pectin Market Trends Analysis (2020-2032)
7.6.2 Pectin Market Size Estimates and Forecasts to 2032 (USD Billion)
7.7 Guar Gum
7.7.1 Guar Gum Market Trends Analysis (2020-2032)
7.7.2 Guar Gum Market Size Estimates and Forecasts to 2032 (USD Billion)
7.8 Gum Arabic
7.8.1 Gum Arabic Market Trends Analysis (2020-2032)
7.8.2 Gum Arabic Market Size Estimates and Forecasts to 2032 (USD Billion)
7.9 Agar
7.9.1 Agar Market Trends Analysis (2020-2032)
7.9.2 Agar Market Size Estimates and Forecasts to 2032 (USD Billion)
7.10 Others
7.10.1 Others Market Trends Analysis (2020-2032)
7.10.2 Others Market Size Estimates and Forecasts to 2032 (USD Billion)
8. Hydrocolloids Market Segmentation, by Function
8.1 Chapter Overview
8.2 Thickening
8.2.1 Thickening Market Trends Analysis (2020-2032)
8.2.2 Thickening Market Size Estimates and Forecasts to 2032 (USD Billion)
8.3 Gelling
8.3.1 Gelling Market Trends Analysis (2020-2032)
8.3.2 Gelling Market Size Estimates and Forecasts to 2032 (USD Billion)
8.4 Stabilizing
8.4.1 Stabilizing Market Trends Analysis (2020-2032)
8.4.2 Stabilizing Market Size Estimates and Forecasts to 2032 (USD Billion)
8.5 Fat Replacing
8.5.1 Fat Replacing Market Trends Analysis (2020-2032)
8.5.2 Fat Replacing Market Size Estimates and Forecasts to 2032 (USD Billion)
8.6 Coating Material
8.6.1 Coating Material Market Trends Analysis (2020-2032)
8.6.2 Coating Material Market Size Estimates and Forecasts to 2032 (USD Billion)
8.7 Others
8.7.1 Others Market Trends Analysis (2020-2032)
8.7.2 Others Market Size Estimates and Forecasts to 2032 (USD Billion)
9. Hydrocolloids Market Segmentation, by Application
9.1 Chapter Overview
9.2 Food & Beverage
9.2.1 Food & Beverage Market Trends Analysis (2020-2032)
9.2.2 Food & Beverage Market Size Estimates and Forecasts to 2032 (USD Billion)
9.3 Pharmaceutical
9.3.1 Pharmaceutical Market Trends Analysis (2020-2032)
9.3.2 Pharmaceutical Market Size Estimates and Forecasts to 2032 (USD Billion)
9.4 Personal Care & Cosmetics
9.4.1 Personal Care & Cosmetics Market Trends Analysis (2020-2032)
9.4.2 Personal Care & Cosmetics Market Size Estimates and Forecasts to 2032 (USD Billion)
9.4 Others
9.4.1 Others Market Trends Analysis (2020-2032)
9.4.2 Others Market Size Estimates and Forecasts to 2032 (USD Billion)
10. Regional Analysis
10.1 Chapter Overview
10.2 North America
10.2.1 Trends Analysis
10.2.2 North America Hydrocolloids Market Estimates and Forecasts, by Country (2020-2032) (USD Billion)
10.2.3 North America Hydrocolloids Market Estimates and Forecasts, by Product (2020-2032) (USD Billion)
10.2.4 North America Hydrocolloids Market Estimates and Forecasts, by Function (2020-2032) (USD Billion)
10.2.5 North America Hydrocolloids Market Estimates and Forecasts, by Application (2020-2032) (USD Billion)
10.2.6 USA
10.2.6.1 USA Hydrocolloids Market Estimates and Forecasts, by Product (2020-2032) (USD Billion)
10.2.6.2 USA Hydrocolloids Market Estimates and Forecasts, by Function (2020-2032) (USD Billion)
10.2.6.3 USA Hydrocolloids Market Estimates and Forecasts, by Application (2020-2032) (USD Billion)
10.2.7 Canada
10.2.7.1 Canada Hydrocolloids Market Estimates and Forecasts, by Product (2020-2032) (USD Billion)
10.2.7.2 Canada Hydrocolloids Market Estimates and Forecasts, by Function (2020-2032) (USD Billion)
10.2.7.3 Canada Hydrocolloids Market Estimates and Forecasts, by Application (2020-2032) (USD Billion)
10.2.8 Mexico
10.2.8.1 Mexico Hydrocolloids Market Estimates and Forecasts, by Product (2020-2032) (USD Billion)
10.2.8.2 Mexico Hydrocolloids Market Estimates and Forecasts, by Function (2020-2032) (USD Billion)
10.2.8.3 Mexico Hydrocolloids Market Estimates and Forecasts, by Application (2020-2032) (USD Billion)
10.3 Europe
10.3.1 Eastern Europe
10.3.1.1 Trends Analysis
10.3.1.2 Eastern Europe Hydrocolloids Market Estimates and Forecasts, by Country (2020-2032) (USD Billion)
10.3.1.3 Eastern Europe Hydrocolloids Market Estimates and Forecasts, by Product (2020-2032) (USD Billion)
10.3.1.4 Eastern Europe Hydrocolloids Market Estimates and Forecasts, by Function (2020-2032) (USD Billion)
10.3.1.5 Eastern Europe Hydrocolloids Market Estimates and Forecasts, by Application (2020-2032) (USD Billion)
10.3.1.6 Poland
10.3.1.6.1 Poland Hydrocolloids Market Estimates and Forecasts, by Product (2020-2032) (USD Billion)
10.3.1.6.2 Poland Hydrocolloids Market Estimates and Forecasts, by Function (2020-2032) (USD Billion)
10.3.1.6.3 Poland Hydrocolloids Market Estimates and Forecasts, by Application (2020-2032) (USD Billion)
10.3.1.7 Romania
10.3.1.7.1 Romania Hydrocolloids Market Estimates and Forecasts, by Product (2020-2032) (USD Billion)
10.3.1.7.2 Romania Hydrocolloids Market Estimates and Forecasts, by Function (2020-2032) (USD Billion)
10.3.1.7.3 Romania Hydrocolloids Market Estimates and Forecasts, by Application (2020-2032) (USD Billion)
10.3.1.8 Hungary
10.3.1.8.1 Hungary Hydrocolloids Market Estimates and Forecasts, by Product (2020-2032) (USD Billion)
10.3.1.8.2 Hungary Hydrocolloids Market Estimates and Forecasts, by Function (2020-2032) (USD Billion)
10.3.1.8.3 Hungary Hydrocolloids Market Estimates and Forecasts, by Application (2020-2032) (USD Billion)
10.3.1.9 Turkey
10.3.1.9.1 Turkey Hydrocolloids Market Estimates and Forecasts, by Product (2020-2032) (USD Billion)
10.3.1.9.2 Turkey Hydrocolloids Market Estimates and Forecasts, by Function (2020-2032) (USD Billion)
10.3.1.9.3 Turkey Hydrocolloids Market Estimates and Forecasts, by Application (2020-2032) (USD Billion)
10.3.1.10 Rest of Eastern Europe
10.3.1.10.1 Rest of Eastern Europe Hydrocolloids Market Estimates and Forecasts, by Product (2020-2032) (USD Billion)
10.3.1.10.2 Rest of Eastern Europe Hydrocolloids Market Estimates and Forecasts, by Function (2020-2032) (USD Billion)
10.3.1.10.3 Rest of Eastern Europe Hydrocolloids Market Estimates and Forecasts, by Application (2020-2032) (USD Billion)
10.3.2 Western Europe
10.3.2.1 Trends Analysis
10.3.2.2 Western Europe Hydrocolloids Market Estimates and Forecasts, by Country (2020-2032) (USD Billion)
10.3.2.3 Western Europe Hydrocolloids Market Estimates and Forecasts, by Product (2020-2032) (USD Billion)
10.3.2.4 Western Europe Hydrocolloids Market Estimates and Forecasts, by Function (2020-2032) (USD Billion)
10.3.2.5 Western Europe Hydrocolloids Market Estimates and Forecasts, by Application (2020-2032) (USD Billion)
10.3.2.6 Germany
10.3.2.6.1 Germany Hydrocolloids Market Estimates and Forecasts, by Product (2020-2032) (USD Billion)
10.3.2.6.2 Germany Hydrocolloids Market Estimates and Forecasts, by Function (2020-2032) (USD Billion)
10.3.2.6.3 Germany Hydrocolloids Market Estimates and Forecasts, by Application (2020-2032) (USD Billion)
10.3.2.7 France
10.3.2.7.1 France Hydrocolloids Market Estimates and Forecasts, by Product (2020-2032) (USD Billion)
10.3.2.7.2 France Hydrocolloids Market Estimates and Forecasts, by Function (2020-2032) (USD Billion)
10.3.2.7.3 France Hydrocolloids Market Estimates and Forecasts, by Application (2020-2032) (USD Billion)
10.3.2.8 UK
10.3.2.8.1 UK Hydrocolloids Market Estimates and Forecasts, by Product (2020-2032) (USD Billion)
10.3.2.8.2 UK Hydrocolloids Market Estimates and Forecasts, by Function (2020-2032) (USD Billion)
10.3.2.8.3 UK Hydrocolloids Market Estimates and Forecasts, by Application (2020-2032) (USD Billion)
10.3.2.9 Italy
10.3.2.9.1 Italy Hydrocolloids Market Estimates and Forecasts, by Product (2020-2032) (USD Billion)
10.3.2.9.2 Italy Hydrocolloids Market Estimates and Forecasts, by Function (2020-2032) (USD Billion)
10.3.2.9.3 Italy Hydrocolloids Market Estimates and Forecasts, by Application (2020-2032) (USD Billion)
10.3.2.10 Spain
10.3.2.10.1 Spain Hydrocolloids Market Estimates and Forecasts, by Product (2020-2032) (USD Billion)
10.3.2.10.2 Spain Hydrocolloids Market Estimates and Forecasts, by Function (2020-2032) (USD Billion)
10.3.2.10.3 Spain Hydrocolloids Market Estimates and Forecasts, by Application (2020-2032) (USD Billion)
10.3.2.11 Netherlands
10.3.2.11.1 Netherlands Hydrocolloids Market Estimates and Forecasts, by Product (2020-2032) (USD Billion)
10.3.2.11.2 Netherlands Hydrocolloids Market Estimates and Forecasts, by Function (2020-2032) (USD Billion)
10.3.2.11.3 Netherlands Hydrocolloids Market Estimates and Forecasts, by Application (2020-2032) (USD Billion)
10.3.2.12 Switzerland
10.3.2.12.1 Switzerland Hydrocolloids Market Estimates and Forecasts, by Product (2020-2032) (USD Billion)
10.3.2.12.2 Switzerland Hydrocolloids Market Estimates and Forecasts, by Function (2020-2032) (USD Billion)
10.3.2.12.3 Switzerland Hydrocolloids Market Estimates and Forecasts, by Application (2020-2032) (USD Billion)
10.3.2.13 Austria
10.3.2.13.1 Austria Hydrocolloids Market Estimates and Forecasts, by Product (2020-2032) (USD Billion)
10.3.2.13.2 Austria Hydrocolloids Market Estimates and Forecasts, by Function (2020-2032) (USD Billion)
10.3.2.13.3 Austria Hydrocolloids Market Estimates and Forecasts, by Application (2020-2032) (USD Billion)
10.3.2.14 Rest of Western Europe
10.3.2.14.1 Rest of Western Europe Hydrocolloids Market Estimates and Forecasts, by Product (2020-2032) (USD Billion)
10.3.2.14.2 Rest of Western Europe Hydrocolloids Market Estimates and Forecasts, by Function (2020-2032) (USD Billion)
10.3.2.14.3 Rest of Western Europe Hydrocolloids Market Estimates and Forecasts, by Application (2020-2032) (USD Billion)
10.4 Asia Pacific
10.4.1 Trends Analysis
10.4.2 Asia Pacific Hydrocolloids Market Estimates and Forecasts, by Country (2020-2032) (USD Billion)
10.4.3 Asia Pacific Hydrocolloids Market Estimates and Forecasts, by Product (2020-2032) (USD Billion)
10.4.4 Asia Pacific Hydrocolloids Market Estimates and Forecasts, by Function (2020-2032) (USD Billion)
10.4.5 Asia Pacific Hydrocolloids Market Estimates and Forecasts, by Application (2020-2032) (USD Billion)
10.4.6 China
10.4.6.1 China Hydrocolloids Market Estimates and Forecasts, by Product (2020-2032) (USD Billion)
10.4.6.2 China Hydrocolloids Market Estimates and Forecasts, by Function (2020-2032) (USD Billion)
10.4.6.3 China Hydrocolloids Market Estimates and Forecasts, by Application (2020-2032) (USD Billion)
10.4.7 India
10.4.7.1 India Hydrocolloids Market Estimates and Forecasts, by Product (2020-2032) (USD Billion)
10.4.7.2 India Hydrocolloids Market Estimates and Forecasts, by Function (2020-2032) (USD Billion)
10.4.7.3 India Hydrocolloids Market Estimates and Forecasts, by Application (2020-2032) (USD Billion)
10.4.8 Japan
10.4.8.1 Japan Hydrocolloids Market Estimates and Forecasts, by Product (2020-2032) (USD Billion)
10.4.8.2 Japan Hydrocolloids Market Estimates and Forecasts, by Function (2020-2032) (USD Billion)
10.4.8.3 Japan Hydrocolloids Market Estimates and Forecasts, by Application (2020-2032) (USD Billion)
10.4.9 South Korea
10.4.9.1 South Korea Hydrocolloids Market Estimates and Forecasts, by Product (2020-2032) (USD Billion)
10.4.9.2 South Korea Hydrocolloids Market Estimates and Forecasts, by Function (2020-2032) (USD Billion)
10.4.9.3 South Korea Hydrocolloids Market Estimates and Forecasts, by Application (2020-2032) (USD Billion)
10.4.10 Vietnam
10.4.10.1 Vietnam Hydrocolloids Market Estimates and Forecasts, by Product (2020-2032) (USD Billion)
10.4.10.2 Vietnam Hydrocolloids Market Estimates and Forecasts, by Function (2020-2032) (USD Billion)
10.4.10.3 Vietnam Hydrocolloids Market Estimates and Forecasts, by Application (2020-2032) (USD Billion)
10.4.11 Singapore
10.4.11.1 Singapore Hydrocolloids Market Estimates and Forecasts, by Product (2020-2032) (USD Billion)
10.4.11.2 Singapore Hydrocolloids Market Estimates and Forecasts, by Function (2020-2032) (USD Billion)
10.4.11.3 Singapore Hydrocolloids Market Estimates and Forecasts, by Application (2020-2032) (USD Billion)
10.4.12 Australia
10.4.12.1 Australia Hydrocolloids Market Estimates and Forecasts, by Product (2020-2032) (USD Billion)
10.4.12.2 Australia Hydrocolloids Market Estimates and Forecasts, by Function (2020-2032) (USD Billion)
10.4.12.3 Australia Hydrocolloids Market Estimates and Forecasts, by Application (2020-2032) (USD Billion)
10.4.13 Rest of Asia Pacific
10.4.13.1 Rest of Asia Pacific Hydrocolloids Market Estimates and Forecasts, by Product (2020-2032) (USD Billion)
10.4.13.2 Rest of Asia Pacific Hydrocolloids Market Estimates and Forecasts, by Function (2020-2032) (USD Billion)
10.4.13.3 Rest of Asia Pacific Hydrocolloids Market Estimates and Forecasts, by Application (2020-2032) (USD Billion)
10.5 Middle East and Africa
10.5.1 Middle East
10.5.1.1 Trends Analysis
10.5.1.2 Middle East Hydrocolloids Market Estimates and Forecasts, by Country (2020-2032) (USD Billion)
10.5.1.3 Middle East Hydrocolloids Market Estimates and Forecasts, by Product (2020-2032) (USD Billion)
10.5.1.4 Middle East Hydrocolloids Market Estimates and Forecasts, by Function (2020-2032) (USD Billion)
10.5.1.5 Middle East Hydrocolloids Market Estimates and Forecasts, by Application (2020-2032) (USD Billion)
10.5.1.6 UAE
10.5.1.6.1 UAE Hydrocolloids Market Estimates and Forecasts, by Product (2020-2032) (USD Billion)
10.5.1.6.2 UAE Hydrocolloids Market Estimates and Forecasts, by Function (2020-2032) (USD Billion)
10.5.1.6.3 UAE Hydrocolloids Market Estimates and Forecasts, by Application (2020-2032) (USD Billion)
10.5.1.7 Egypt
10.5.1.7.1 Egypt Hydrocolloids Market Estimates and Forecasts, by Product (2020-2032) (USD Billion)
10.5.1.7.2 Egypt Hydrocolloids Market Estimates and Forecasts, by Function (2020-2032) (USD Billion)
10.5.1.7.3 Egypt Hydrocolloids Market Estimates and Forecasts, by Application (2020-2032) (USD Billion)
10.5.1.8 Saudi Arabia
10.5.1.8.1 Saudi Arabia Hydrocolloids Market Estimates and Forecasts, by Product (2020-2032) (USD Billion)
10.5.1.8.2 Saudi Arabia Hydrocolloids Market Estimates and Forecasts, by Function (2020-2032) (USD Billion)
10.5.1.8.3 Saudi Arabia Hydrocolloids Market Estimates and Forecasts, by Application (2020-2032) (USD Billion)
10.5.1.9 Qatar
10.5.1.9.1 Qatar Hydrocolloids Market Estimates and Forecasts, by Product (2020-2032) (USD Billion)
10.5.1.9.2 Qatar Hydrocolloids Market Estimates and Forecasts, by Function (2020-2032) (USD Billion)
10.5.1.9.3 Qatar Hydrocolloids Market Estimates and Forecasts, by Application (2020-2032) (USD Billion)
10.5.1.10 Rest of Middle East
10.5.1.10.1 Rest of Middle East Hydrocolloids Market Estimates and Forecasts, by Product (2020-2032) (USD Billion)
10.5.1.10.2 Rest of Middle East Hydrocolloids Market Estimates and Forecasts, by Function (2020-2032) (USD Billion)
10.5.1.10.3 Rest of Middle East Hydrocolloids Market Estimates and Forecasts, by Application (2020-2032) (USD Billion)
10.5.2 Africa
10.5.2.1 Trends Analysis
10.5.2.2 Africa Hydrocolloids Market Estimates and Forecasts, by Country (2020-2032) (USD Billion)
10.5.2.3 Africa Hydrocolloids Market Estimates and Forecasts, by Product (2020-2032) (USD Billion)
10.5.2.4 Africa Hydrocolloids Market Estimates and Forecasts, by Function (2020-2032) (USD Billion)
10.5.2.5 Africa Hydrocolloids Market Estimates and Forecasts, by Application (2020-2032) (USD Billion)
10.5.2.6 South Africa
10.5.2.6.1 South Africa Hydrocolloids Market Estimates and Forecasts, by Product (2020-2032) (USD Billion)
10.5.2.6.2 South Africa Hydrocolloids Market Estimates and Forecasts, by Function (2020-2032) (USD Billion)
10.5.2.6.3 South Africa Hydrocolloids Market Estimates and Forecasts, by Application (2020-2032) (USD Billion)
10.5.2.7 Nigeria
10.5.2.7.1 Nigeria Hydrocolloids Market Estimates and Forecasts, by Product (2020-2032) (USD Billion)
10.5.2.7.2 Nigeria Hydrocolloids Market Estimates and Forecasts, by Function (2020-2032) (USD Billion)
10.5.2.7.3 Nigeria Hydrocolloids Market Estimates and Forecasts, by Application (2020-2032) (USD Billion)
10.5.2.8 Rest of Africa
10.5.2.8.1 Rest of Africa Hydrocolloids Market Estimates and Forecasts, by Product (2020-2032) (USD Billion)
10.5.2.8.2 Rest of Africa Hydrocolloids Market Estimates and Forecasts, by Function (2020-2032) (USD Billion)
10.5.2.8.3 Rest of Africa Hydrocolloids Market Estimates and Forecasts, by Application (2020-2032) (USD Billion)
10.6 Latin America
10.6.1 Trends Analysis
10.6.2 Latin America Hydrocolloids Market Estimates and Forecasts, by Country (2020-2032) (USD Billion)
10.6.3 Latin America Hydrocolloids Market Estimates and Forecasts, by Product (2020-2032) (USD Billion)
10.6.4 Latin America Hydrocolloids Market Estimates and Forecasts, by Function (2020-2032) (USD Billion)
10.6.5 Latin America Hydrocolloids Market Estimates and Forecasts, by Application (2020-2032) (USD Billion)
10.6.6 Brazil
10.6.6.1 Brazil Hydrocolloids Market Estimates and Forecasts, by Product (2020-2032) (USD Billion)
10.6.6.2 Brazil Hydrocolloids Market Estimates and Forecasts, by Function (2020-2032) (USD Billion)
10.6.6.3 Brazil Hydrocolloids Market Estimates and Forecasts, by Application (2020-2032) (USD Billion)
10.6.7 Argentina
10.6.7.1 Argentina Hydrocolloids Market Estimates and Forecasts, by Product (2020-2032) (USD Billion)
10.6.7.2 Argentina Hydrocolloids Market Estimates and Forecasts, by Function (2020-2032) (USD Billion)
10.6.7.3 Argentina Hydrocolloids Market Estimates and Forecasts, by Application (2020-2032) (USD Billion)
10.6.8 Colombia
10.6.8.1 Colombia Hydrocolloids Market Estimates and Forecasts, by Product (2020-2032) (USD Billion)
10.6.8.2 Colombia Hydrocolloids Market Estimates and Forecasts, by Function (2020-2032) (USD Billion)
10.6.8.3 Colombia Hydrocolloids Market Estimates and Forecasts, by Application (2020-2032) (USD Billion)
10.6.9 Rest of Latin America
10.6.9.1 Rest of Latin America Hydrocolloids Market Estimates and Forecasts, by Product (2020-2032) (USD Billion)
10.6.9.2 Rest of Latin America Hydrocolloids Market Estimates and Forecasts, by Function (2020-2032) (USD Billion)
10.6.9.3 Rest of Latin America Hydrocolloids Market Estimates and Forecasts, by Application (2020-2032) (USD Billion)
11. Company Profiles
11.1 E. I. du Pont de Nemours and Company
11.1.1 Company Overview
11.1.2 Financial
11.1.3 Products/ Services Offered
11.1.4 SWOT Analysis
11.2 Cargill, Inc.
11.2.1 Company Overview
11.2.2 Financial
11.2.3 Products/ Services Offered
11.2.4 SWOT Analysis
11.3 CP Kelco
11.3.1 Company Overview
11.3.2 Financial
11.3.3 Products/ Services Offered
11.3.4 SWOT Analysis
11.4 Ashland Inc.
11.4.1 Company Overview
11.4.2 Financial
11.4.3 Products/ Services Offered
11.4.4 SWOT Analysis
11.5 Lubrizol Corporation
11.5.1 Company Overview
11.5.2 Financial
11.5.3 Products/ Services Offered
11.5.4 SWOT Analysis
11.6 Rousselot S.A.S.
11.6.1 Company Overview
11.6.2 Financial
11.6.3 Products/ Services Offered
11.6.4 SWOT Analysis
11.7 Kerry Group PLC.
11.7.1 Company Overview
11.7.2 Financial
11.7.3 Products/ Services Offered
11.7.4 SWOT Analysis
11.8 Darling Ingredients Inc.
11.8.1 Company Overview
11.8.2 Financial
11.8.3 Products/ Services Offered
11.8.4 SWOT Analysis
11.9 Fuerst Day Lawson
11.9.1 Company Overview
11.9.2 Financial
11.9.3 Products/ Services Offered
11.9.4 SWOT Analysis
11.10 TIC GUMs Inc.
11.10.1 Company Overview
11.10.2 Financial
11.10.3 Products/ Services Offered
11.10.4 SWOT Analysis
12. Use Cases and Best Practices
13. Conclusion
An accurate research report requires proper strategizing as well as implementation. There are multiple factors involved in the completion of good and accurate research report and selecting the best methodology to compete the research is the toughest part. Since the research reports we provide play a crucial role in any company’s decision-making process, therefore we at SNS Insider always believe that we should choose the best method which gives us results closer to reality. This allows us to reach at a stage wherein we can provide our clients best and accurate investment to output ratio.
Each report that we prepare takes a timeframe of 350-400 business hours for production. Starting from the selection of titles through a couple of in-depth brain storming session to the final QC process before uploading our titles on our website we dedicate around 350 working hours. The titles are selected based on their current market cap and the foreseen CAGR and growth.
The 5 steps process:
Step 1: Secondary Research:
Secondary Research or Desk Research is as the name suggests is a research process wherein, we collect data through the readily available information. In this process we use various paid and unpaid databases which our team has access to and gather data through the same. This includes examining of listed companies’ annual reports, Journals, SEC filling etc. Apart from this our team has access to various associations across the globe across different industries. Lastly, we have exchange relationships with various university as well as individual libraries.
Step 2: Primary Research
When we talk about primary research, it is a type of study in which the researchers collect relevant data samples directly, rather than relying on previously collected data. This type of research is focused on gaining content specific facts that can be sued to solve specific problems. Since the collected data is fresh and first hand therefore it makes the study more accurate and genuine.
We at SNS Insider have divided Primary Research into 2 parts.
Part 1 wherein we interview the KOLs of major players as well as the upcoming ones across various geographic regions. This allows us to have their view over the market scenario and acts as an important tool to come closer to the accurate market numbers. As many as 45 paid and unpaid primary interviews are taken from both the demand and supply side of the industry to make sure we land at an accurate judgement and analysis of the market.
This step involves the triangulation of data wherein our team analyses the interview transcripts, online survey responses and observation of on filed participants. The below mentioned chart should give a better understanding of the part 1 of the primary interview.
Part 2: In this part of primary research the data collected via secondary research and the part 1 of the primary research is validated with the interviews from individual consultants and subject matter experts.
Consultants are those set of people who have at least 12 years of experience and expertise within the industry whereas Subject Matter Experts are those with at least 15 years of experience behind their back within the same space. The data with the help of two main processes i.e., FGDs (Focused Group Discussions) and IDs (Individual Discussions). This gives us a 3rd party nonbiased primary view of the market scenario making it a more dependable one while collation of the data pointers.
Step 3: Data Bank Validation
Once all the information is collected via primary and secondary sources, we run that information for data validation. At our intelligence centre our research heads track a lot of information related to the market which includes the quarterly reports, the daily stock prices, and other relevant information. Our data bank server gets updated every fortnight and that is how the information which we collected using our primary and secondary information is revalidated in real time.
Step 4: QA/QC Process
After all the data collection and validation our team does a final level of quality check and quality assurance to get rid of any unwanted or undesired mistakes. This might include but not limited to getting rid of the any typos, duplication of numbers or missing of any important information. The people involved in this process include technical content writers, research heads and graphics people. Once this process is completed the title gets uploader on our platform for our clients to read it.
Step 5: Final QC/QA Process:
This is the last process and comes when the client has ordered the study. In this process a final QA/QC is done before the study is emailed to the client. Since we believe in giving our clients a good experience of our research studies, therefore, to make sure that we do not lack at our end in any way humanly possible we do a final round of quality check and then dispatch the study to the client.
Key Segments:
By Product
Gelatin
Xanthan Gum
Carrageenan
Alginates
Pectin
Guar Gum
Gum Arabic
Agar
Others
By Function
Thickening
Gelling
Stabilizing
Fat Replacing
Coating Material
Others
By Application
Food & Beverage
Pharmaceutical
Personal Care & Cosmetics
Others
Request for Segment Customization as per your Business Requirement: Segment Customization Request
Regional Coverage:
North America
US
Canada
Mexico
Europe
Eastern Europe
Poland
Romania
Hungary
Turkey
Rest of Eastern Europe
Western Europe
Germany
France
UK
Italy
Spain
Netherlands
Switzerland
Austria
Rest of Western Europe
Asia Pacific
China
India
Japan
South Korea
Vietnam
Singapore
Australia
Rest of Asia Pacific
Middle East & Africa
Middle East
UAE
Egypt
Saudi Arabia
Qatar
Rest of Middle East
Africa
Nigeria
South Africa
Rest of Africa
Latin America
Brazil
Argentina
Colombia
Rest of Latin America
Request for Country Level Research Report: Country Level Customization Request
Available Customization
With the given market data, SNS Insider offers customization as per the company’s specific needs. The following customization options are available for the report:
Product Analysis
Criss-Cross segment analysis (e.g. Product X Application)
Product Matrix which gives a detailed comparison of product portfolio of each company
Geographic Analysis
Additional countries in any of the regions
Company Information
Detailed analysis and profiling of additional market players (Up to five)
The Membranes Market size was valued at USD 7.3 Billion in 2023. It is expected to grow to USD 14.2 Billion by 2032 and grow at a CAGR of 7.7% over the forecast period of 2024-2032.
Currently, our team at SNS Insider is in the compilation process of the Anti-fog Additives Market’s upcoming report, set to be released soon.
The Fructooligosaccharides Market Size was valued at USD 2.6 billion in 2023, and is expected to reach USD 5.5 billion by 2032, and grow at a CAGR of 8.7% over the forecast period 2024-2032.
Zero Liquid Discharge Systems Market was valued at USD 7.3 billion in 2023 and is expected to grow to USD 14.6 billion by 2032 at a CAGR of 8.1% by 2024-2032.
The Polyolefin Pipes Market size was USD 20.7 billion in 2023 and is expected to reach USD 32.5 billion by 2032 and grow at a CAGR of 5.1% by 2024-2032.
The Thermal Barrier Coatings Market Size was valued at USD 16.9 Billion in 2023 and is expected to reach USD 25.9 Billion by 2032 and grow at a CAGR of 4.9% over the forecast period 2024-2032.
Hi! Click one of our member below to chat on Phone