To Get More Information on Hydraulic Equipment Market - Request Sample Report
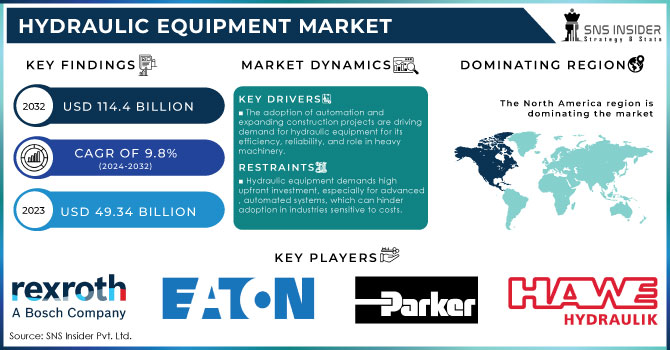
The Hydraulic Equipment Market Size was valued at USD 49.34 Billion in 2023 and is now anticipated to grow to USD 114.4 Billion by 2032, displaying a compound annual growth rate (CAGR) of 9.8% during the forecast Period 2024-2032.
The hydraulic equipment industry is expanding rapidly as a result of the technological advances in this field combined with practical high power & efficient machinery demand in various industrial sectors. Industries that depend heavily on hydraulic cushioning means include construction, manufacturing, agriculture and oil & gas just to name a few. The demand for hydraulic systems is steadily increasing owing to the requirement of high-performance equipment capable of loading excessive weights and providing accurate control. Hydraulic Equipment market has also seen some of the recent dynamic trends that have been evolving in the market such as great shift towards automation and integration of IoT (Internet of Things) Technologies. With the use of these new advancements remote monitoring and control of hydraulic systems in real time has been made possible, which resulted into higher efficiency and lower downtime. Owing to this, manufacturers are concentrating on building smart hydraulic systems that can cater to different operating conditions as well as improve performance and energy efficiency.
In addition, sustainability is growing importance in the market expansion. More and more focus is on developing green hydraulic equipment that uses less energy and make a lesser impact on the environment. Such tendencies are pushing the producers to compel production and design hydraulic structures that use bio-degradable fluids and that also combine energy recovery systems. Moreover, increase in adoption of mobile hydraulic equipment is observed in industries such as agriculture and construction wherein both mobility and versatility are required. A transition to electric and hybrid hydraulic systems is already underway, providing cleaner and more sustainable solutions.
DRIVERS
The increasing adoption of automation technologies across various industries is a key driver in the hydraulic equipment market. As manufacturing and industrial processes evolve towards greater efficiency and precision, hydraulic systems play a crucial role in powering automated machinery. In sectors like automotive, aerospace, and industrial production, hydraulic equipment is widely used for its superior reliability and precision control, particularly in tasks requiring heavy lifting, repetitive motions, or force application. This growing reliance on automation has led to a surge in demand for hydraulic systems, particularly in robotic applications where they offer smooth, consistent operation under high load conditions.
In addition to manufacturing, the construction and infrastructure sectors are also fueling demand for hydraulic equipment. Expanding construction projects, particularly in emerging markets, require heavy machinery such as excavators, loaders, bulldozers, and cranes. These machines rely on hydraulic systems to operate efficiently under challenging conditions, enabling large-scale construction projects, including urban development, transportation networks, and energy infrastructure. Hydraulic equipment’s ability to support industrial automation and power construction machinery highlights its importance in modernizing industries and improving operational efficiencies. As global infrastructure development continues, and industries increasingly adopt automated processes, the demand for hydraulic systems will further accelerate, making them a cornerstone of industrial modernization and growth.
Energy efficiency and technological advancements are key drivers in the hydraulic equipment market. Modern hydraulic systems are being designed to consume less energy, reducing fuel usage and lowering emissions. These innovations align with stricter global environmental regulations, enabling industries to adopt more sustainable solutions. Energy-efficient hydraulics not only help cut operational costs but also contribute to greener practices across sectors such as construction, manufacturing, and agriculture.
Another significant advancement is the integration of smart hydraulics with IoT sensors. These systems allow real-time monitoring of equipment performance, providing data for predictive maintenance and enabling quick detection of potential issues. This reduces downtime and increases overall productivity. The ability to monitor hydraulic systems remotely, adjust parameters, and schedule maintenance efficiently has made smart hydraulic systems attractive for industries looking to optimize operational efficiency while reducing costs. These advancements continue to revolutionize the hydraulic equipment market.
RESTRAIN
Hydraulic equipment often involves a substantial initial investment, particularly when dealing with advanced systems that incorporate automation and smart technologies. These capital-intensive machines, while offering enhanced efficiency, precision, and durability, come with higher costs due to the complex design, robust components, and specialized manufacturing processes. For industries that are highly cost-sensitive, such as small-scale manufacturing or construction firms, this significant upfront expense can be a deterrent.
Moreover, advanced hydraulic systems that integrate IoT sensors and energy-efficient designs may have higher maintenance and training requirements, adding to operational costs. While large corporations in sectors like mining, oil & gas, or large-scale infrastructure projects can often absorb these costs, smaller players might delay or avoid upgrading their equipment, affecting the overall market adoption rate. This cost barrier can also lead companies to explore alternative, less expensive technologies like electric or pneumatic systems.
By Application
The industrial segment is dominated market share over 62.04% in 2023, mainly due to its widespread use in industries like manufacturing, oil and gas, mining, and material processing. These industries require heavy-duty, high-power hydraulic systems for various functions like lifting, pressing, and clamping.
The mobile hydraulic equipment market is projected to grow rapidly, driven by the increasing demand in sectors like construction, agriculture, and material handling. The expansion of infrastructure projects, rising urbanization, and an increase in agricultural mechanization are key factors pushing growth in this segment.
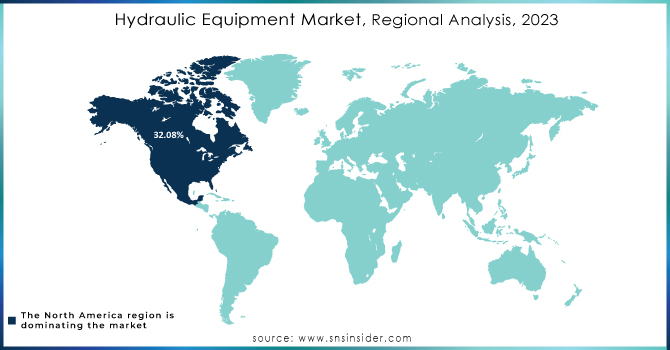
The North American region is dominated market share over 32.08% in 2023. Over the past few years, North America's food and beverage, pharmaceutical, and FMCG businesses have all experienced rapid growth. The demand for hydraulic-operated filling and packing equipment has increased as a result of the rise in FMCG product demand, new manufacturing facilities, and the expansion of existing factories. When filling containers like bags and sacks, the food and beverage industry use conveyors powered by hydraulic motors.
Do You Need any Customization Research on Hydraulic EquipmentMarket - Inquire Now
Some of the major key players of Hydraulic Equipment Market
In June 2023: KTI Hydraulics Inc. unveiled a submerged DC hydraulic power unit (HPU) to enhance the dependability of recycling equipment. The business provides a waterproof HPU equipped with a 1.8-kilowatt, 12-volt, and 24-volt DC motor that has excellent ingress protection ratings. The Hydraulic Power Unit (HPU) consists of a gear pump under pressure, a sealed solenoid, and a reservoir holding five quarts of usable liquid volume.
In April 2023: Bosch Rexroth introduced the Hägglunds Quantum series of hydraulic motors, aimed at improving torque and speed abilities while maintaining efficiency for direct drive use in heavy-duty machinery. Furthermore, these motors can reach speeds exceeding 150 rpm and have a maximum torque of over 350 kNm. Modifications in the design and materials resulted in increased speed and torque, as well as a prolonged lifespan, all while maintaining efficient performance.
| Report Attributes | Details |
|---|---|
| Market Size in 2023 | USD 49.34 Billion |
| Market Size by 2032 | USD 114.4 Billion |
| CAGR | CAGR of 9.8% From 2024 to 2032 |
| Base Year | 2023 |
| Forecast Period | 2024-2032 |
| Historical Data | 2020-2022 |
| Report Scope & Coverage | Market Size, Segments Analysis, Competitive Landscape, Regional Analysis, DROC & SWOT Analysis, Forecast Outlook |
| Key Segments | • By Component (Pumps, Motors, Valves, Cylinder and Accessories) • By Application (Industrial and Mobile) • By End User (Mining & Construction, Agriculture & Forestry, Packaging, Material Handling, Aerospace & defense, Machine Tool, Oil & Gas, Automotive, Others) |
| Regional Analysis/Coverage | North America (US, Canada, Mexico), Europe (Eastern Europe [Poland, Romania, Hungary, Turkey, Rest of Eastern Europe] Western Europe] Germany, France, UK, Italy, Spain, Netherlands, Switzerland, Austria, Rest of Western Europe]), Asia Pacific (China, India, Japan, South Korea, Vietnam, Singapore, Australia, Rest of Asia Pacific), Middle East & Africa (Middle East [UAE, Egypt, Saudi Arabia, Qatar, Rest of Middle East], Africa [Nigeria, South Africa, Rest of Africa], Latin America (Brazil, Argentina, Colombia, Rest of Latin America) |
| Company Profiles | Bosch Rexroth, Eaton Corporation Plc, Parker Hannifin, Kawasaki, HAWE Hydraulik, Hydac, Moog, Inc., Bucher Hydraulics, Daikin Industries Ltd., Concentric AB, Casappa, Nachi-Fujikoshi Corp., Dantal Hydraulics, Fluitronics GmbH, Linde Hydraulics, Danfoss Power Solutions, Komatsu Ltd., Hydreco Hydraulics, Sauer-Danfoss, and Yuken Kogyo Co., Ltd. |
| Key Drivers | •The growing adoption of automation technologies in industrial processes, along with expanding construction projects, is driving demand for hydraulic equipment due to its efficiency, reliability, and essential role in heavy machinery. • Energy-efficient hydraulic systems reduce fuel consumption and emissions, while smart hydraulics with IoT integration enable real-time monitoring and predictive maintenance, enhancing productivity. |
| RESTRAINTS | • Hydraulic equipment demands high upfront investment, especially for advanced, automated systems, which can hinder adoption in industries sensitive to costs. |
Ans: The Hydraulic Equipment Market is expected to grow at a CAGR of 9.8% Over the Forecast Period of 2024-2032.
Ans: Hydraulic Equipment Market size was USD 49.34 Billion in 2023 and is expected to Reach USD 114.4 Billion by 2032.
Ans: Industrial segmentation is the dominating segment by application in the Hydraulic Equipment Market.
Ans: The growing adoption of automation technologies in industrial processes, along with expanding construction projects, is driving demand for hydraulic equipment due to its efficiency, reliability, and essential role in heavy machinery.
Ans: North America is the dominating region in the Hydraulic Equipment Market.
Table of Contents
1. Introduction
1.1 Market Definition
1.2 Scope (Inclusion and Exclusions)
1.3 Research Assumptions
2. Executive Summary
2.1 Market Overview
2.2 Regional Synopsis
2.3 Competitive Summary
3. Research Methodology
3.1 Top-Down Approach
3.2 Bottom-up Approach
3.3. Data Validation
3.4 Primary Interviews
4. Market Dynamics Impact Analysis
3.1 Market Driving Factors Analysis
3.1.2 Drivers
3.1.2 Restraints
3.1.3 Opportunities
3.1.4 Challenges
3.2 PESTLE Analysis
3.3 Porter’s Five Forces Model
5. Statistical Insights and Trends Reporting
5.1 Manufacturing Output, by region, (2020-2023)
5.2 Utilization Rates, by region, (2020-2023)
5.3 Maintenance and Downtime Metrix
5.4 Technological Adoption Rates, by region
5.6 Export/Import Data, by region (2023)
6. Competitive Landscape
6.1 List of Major Companies, By Region
6.2 Market Share Analysis, By Region
6.3 Product Benchmarking
6.3.1 Product specifications and features
6.3.2 Pricing
6.4 Strategic Initiatives
6.4.1 Marketing and promotional activities
6.4.2 Distribution and supply chain strategies
6.4.3 Expansion plans and new product launches
6.4.4 Strategic partnerships and collaborations
6.5 Technological Advancements
6.6 Market Positioning and Branding
7. Hydraulic Equipment Market Segmentation, By Component
7.1 Chapter Overview
7.2 Pumps
7.2.1 Pumps Market Trends Analysis (2020-2032)
7.2.2 Pumps Market Size Estimates and Forecasts to 2032 (USD Billion)
7.3 Motors
7.3.1 Motors Market Trends Analysis (2020-2032)
7.3.2 Motors Market Size Estimates and Forecasts to 2032 (USD Billion)
7.4 Valves
7.4.1 Valves Market Trends Analysis (2020-2032)
7.4.2 Valves Market Size Estimates and Forecasts to 2032 (USD Billion)
7.5 Cylinder
7.5.1 Cylinder Market Trends Analysis (2020-2032)
7.5.2 Cylinder Market Size Estimates and Forecasts to 2032 (USD Billion)
7.6 Accessories
7.6.1 Accessories Market Trends Analysis (2020-2032)
7.6.2 Accessories Market Size Estimates and Forecasts to 2032 (USD Billion)
8. Hydraulic Equipment Market Segmentation, By Application
8.1 Chapter Overview
8.2 Industrial
8.2.1 Industrial Market Trends Analysis (2020-2032)
8.2.2 Industrial Market Size Estimates and Forecasts to 2032 (USD Billion)
8.3 Mobile
8.3.1 Mobile Market Trends Analysis (2020-2032)
8.3.2 Mobile Market Size Estimates and Forecasts to 2032 (USD Billion)
9. Regional Analysis
9.1 Chapter Overview
9.2 North America
9.2.1 Trends Analysis
9.2.2 North America Hydraulic Equipment Market Estimates and Forecasts, by Country (2020-2032) (USD Billion)
9.2.3 North America Hydraulic Equipment Market Estimates and Forecasts, by Component (2020-2032) (USD Billion)
9.2.4 North America Hydraulic Equipment Market Estimates and Forecasts, by Application (2020-2032) (USD Billion)
9.2.5 USA
9.2.5.1 USA Hydraulic Equipment Market Estimates and Forecasts, by Component (2020-2032) (USD Billion)
9.2.5.2 USA Hydraulic Equipment Market Estimates and Forecasts, by Application (2020-2032) (USD Billion)
9.2.6 Canada
9.2.6.1 Canada Hydraulic Equipment Market Estimates and Forecasts, by Component (2020-2032) (USD Billion)
9.2.6.2 Canada Hydraulic Equipment Market Estimates and Forecasts, by Application (2020-2032) (USD Billion)
9.2.7 Mexico
9.2.7.1 Mexico Hydraulic Equipment Market Estimates and Forecasts, by Component (2020-2032) (USD Billion)
9.2.7.2 Mexico Hydraulic Equipment Market Estimates and Forecasts, by Application (2020-2032) (USD Billion)
9.3 Europe
9.3.1 Eastern Europe
9.3.1.1 Trends Analysis
9.3.1.2 Eastern Europe Hydraulic Equipment Market Estimates and Forecasts, by Country (2020-2032) (USD Billion)
9.3.1.3 Eastern Europe Hydraulic Equipment Market Estimates and Forecasts, by Component (2020-2032) (USD Billion)
9.3.1.4 Eastern Europe Hydraulic Equipment Market Estimates and Forecasts, by Application (2020-2032) (USD Billion)
9.3.1.5 Poland
9.3.1.5.1 Poland Hydraulic Equipment Market Estimates and Forecasts, by Component (2020-2032) (USD Billion)
9.3.1.5.2 Poland Hydraulic Equipment Market Estimates and Forecasts, by Application (2020-2032) (USD Billion)
9.3.1.6 Romania
9.3.1.6.1 Romania Hydraulic Equipment Market Estimates and Forecasts, by Component (2020-2032) (USD Billion)
9.3.1.6.2 Romania Hydraulic Equipment Market Estimates and Forecasts, by Application (2020-2032) (USD Billion)
9.3.1.7 Hungary
9.3.1.7.1 Hungary Hydraulic Equipment Market Estimates and Forecasts, by Component (2020-2032) (USD Billion)
9.3.1.7.2 Hungary Hydraulic Equipment Market Estimates and Forecasts, by Application (2020-2032) (USD Billion)
9.3.1.8 Turkey
9.3.1.8.1 Turkey Hydraulic Equipment Market Estimates and Forecasts, by Component (2020-2032) (USD Billion)
9.3.1.8.2 Turkey Hydraulic Equipment Market Estimates and Forecasts, by Application (2020-2032) (USD Billion)
9.3.1.9 Rest of Eastern Europe
9.3.1.9.1 Rest of Eastern Europe Hydraulic Equipment Market Estimates and Forecasts, by Component (2020-2032) (USD Billion)
9.3.1.9.2 Rest of Eastern Europe Hydraulic Equipment Market Estimates and Forecasts, by Application (2020-2032) (USD Billion)
9.3.2 Western Europe
9.3.2.1 Trends Analysis
9.3.2.2 Western Europe Hydraulic Equipment Market Estimates and Forecasts, by Country (2020-2032) (USD Billion)
9.3.2.3 Western Europe Hydraulic Equipment Market Estimates and Forecasts, by Component (2020-2032) (USD Billion)
9.3.2.4 Western Europe Hydraulic Equipment Market Estimates and Forecasts, by Application (2020-2032) (USD Billion)
9.3.2.5 Germany
9.3.2.5.1 Germany Hydraulic Equipment Market Estimates and Forecasts, by Component (2020-2032) (USD Billion)
9.3.2.5.2 Germany Hydraulic Equipment Market Estimates and Forecasts, by Application (2020-2032) (USD Billion)
9.3.2.6 France
9.3.2.6.1 France Hydraulic Equipment Market Estimates and Forecasts, by Component (2020-2032) (USD Billion)
9.3.2.6.2 France Hydraulic Equipment Market Estimates and Forecasts, by Application (2020-2032) (USD Billion)
9.3.2.7 UK
9.3.2.7.1 UK Hydraulic Equipment Market Estimates and Forecasts, by Component (2020-2032) (USD Billion)
9.3.2.7.2 UK Hydraulic Equipment Market Estimates and Forecasts, by Application (2020-2032) (USD Billion)
9.3.2.8 Italy
9.3.2.8.1 Italy Hydraulic Equipment Market Estimates and Forecasts, by Component (2020-2032) (USD Billion)
9.3.2.8.2 Italy Hydraulic Equipment Market Estimates and Forecasts, by Application (2020-2032) (USD Billion)
9.3.2.9 Spain
9.3.2.9.1 Spain Hydraulic Equipment Market Estimates and Forecasts, by Component (2020-2032) (USD Billion)
9.3.2.9.2 Spain Hydraulic Equipment Market Estimates and Forecasts, by Application (2020-2032) (USD Billion)
9.3.2.10 Netherlands
9.3.2.10.1 Netherlands Hydraulic Equipment Market Estimates and Forecasts, by Component (2020-2032) (USD Billion)
9.3.2.10.2 Netherlands Hydraulic Equipment Market Estimates and Forecasts, by Application (2020-2032) (USD Billion)
9.3.2.11 Switzerland
9.3.2.11.1 Switzerland Hydraulic Equipment Market Estimates and Forecasts, by Component (2020-2032) (USD Billion)
9.3.2.11.2 Switzerland Hydraulic Equipment Market Estimates and Forecasts, by Application (2020-2032) (USD Billion)
9.3.2.12 Austria
9.3.2.12.1 Austria Hydraulic Equipment Market Estimates and Forecasts, by Component (2020-2032) (USD Billion)
9.3.2.12.2 Austria Hydraulic Equipment Market Estimates and Forecasts, by Application (2020-2032) (USD Billion)
9.3.2.13 Rest of Western Europe
9.3.2.13.1 Rest of Western Europe Hydraulic Equipment Market Estimates and Forecasts, by Component (2020-2032) (USD Billion)
9.3.2.13.2 Rest of Western Europe Hydraulic Equipment Market Estimates and Forecasts, by Application (2020-2032) (USD Billion)
9.4 Asia-Pacific
9.4.1 Trends Analysis
9.4.2 Asia-Pacific Hydraulic Equipment Market Estimates and Forecasts, by Country (2020-2032) (USD Billion)
9.4.3 Asia-Pacific Hydraulic Equipment Market Estimates and Forecasts, by Component (2020-2032) (USD Billion)
9.4.4 Asia-Pacific Hydraulic Equipment Market Estimates and Forecasts, by Application (2020-2032) (USD Billion)
9.4.5 China
9.4.5.1 China Hydraulic Equipment Market Estimates and Forecasts, by Component (2020-2032) (USD Billion)
9.4.5.2 China Hydraulic Equipment Market Estimates and Forecasts, by Application (2020-2032) (USD Billion)
9.4.6 India
9.4.5.1 India Hydraulic Equipment Market Estimates and Forecasts, by Component (2020-2032) (USD Billion)
9.4.5.2 India Hydraulic Equipment Market Estimates and Forecasts, by Application (2020-2032) (USD Billion)
9.4.5 Japan
9.4.5.1 Japan Hydraulic Equipment Market Estimates and Forecasts, by Component (2020-2032) (USD Billion)
9.4.5.2 Japan Hydraulic Equipment Market Estimates and Forecasts, by Application (2020-2032) (USD Billion)
9.4.6 South Korea
9.4.6.1 South Korea Hydraulic Equipment Market Estimates and Forecasts, by Component (2020-2032) (USD Billion)
9.4.6.2 South Korea Hydraulic Equipment Market Estimates and Forecasts, by Application (2020-2032) (USD Billion)
9.4.7 Vietnam
9.4.7.1 Vietnam Hydraulic Equipment Market Estimates and Forecasts, by Component (2020-2032) (USD Billion)
9.2.7.2 Vietnam Hydraulic Equipment Market Estimates and Forecasts, by Application (2020-2032) (USD Billion)
9.4.8 Singapore
9.4.8.1 Singapore Hydraulic Equipment Market Estimates and Forecasts, by Component (2020-2032) (USD Billion)
9.4.8.2 Singapore Hydraulic Equipment Market Estimates and Forecasts, by Application (2020-2032) (USD Billion)
9.4.9 Australia
9.4.9.1 Australia Hydraulic Equipment Market Estimates and Forecasts, by Component (2020-2032) (USD Billion)
9.4.9.2 Australia Hydraulic Equipment Market Estimates and Forecasts, by Application (2020-2032) (USD Billion)
9.4.10 Rest of Asia-Pacific
9.4.10.1 Rest of Asia-Pacific Hydraulic Equipment Market Estimates and Forecasts, by Component (2020-2032) (USD Billion)
9.4.10.2 Rest of Asia-Pacific Hydraulic Equipment Market Estimates and Forecasts, by Application (2020-2032) (USD Billion)
9.5 Middle East and Africa
9.5.1 Middle East
9.5.1.1 Trends Analysis
9.5.1.2 Middle East Hydraulic Equipment Market Estimates and Forecasts, by Country (2020-2032) (USD Billion)
9.5.1.3 Middle East Hydraulic Equipment Market Estimates and Forecasts, by Component (2020-2032) (USD Billion)
9.5.1.4 Middle East Hydraulic Equipment Market Estimates and Forecasts, by Application (2020-2032) (USD Billion)
9.5.1.5 UAE
9.5.1.5.1 UAE Hydraulic Equipment Market Estimates and Forecasts, by Component (2020-2032) (USD Billion)
9.5.1.5.2 UAE Hydraulic Equipment Market Estimates and Forecasts, by Application (2020-2032) (USD Billion)
9.5.1.6 Egypt
9.5.1.6.1 Egypt Hydraulic Equipment Market Estimates and Forecasts, by Component (2020-2032) (USD Billion)
9.5.1.6.2 Egypt Hydraulic Equipment Market Estimates and Forecasts, by Application (2020-2032) (USD Billion)
9.5.1.7 Saudi Arabia
9.5.1.7.1 Saudi Arabia Hydraulic Equipment Market Estimates and Forecasts, by Component (2020-2032) (USD Billion)
9.5.1.7.2 Saudi Arabia Hydraulic Equipment Market Estimates and Forecasts, by Application (2020-2032) (USD Billion)
9.5.1.8 Qatar
9.5.1.8.1 Qatar Hydraulic Equipment Market Estimates and Forecasts, by Component (2020-2032) (USD Billion)
9.5.1.8.2 Qatar Hydraulic Equipment Market Estimates and Forecasts, by Application (2020-2032) (USD Billion)
9.5.1.9 Rest of Middle East
9.5.1.9.1 Rest of Middle East Hydraulic Equipment Market Estimates and Forecasts, by Component (2020-2032) (USD Billion)
9.5.1.9.2 Rest of Middle East Hydraulic Equipment Market Estimates and Forecasts, by Application (2020-2032) (USD Billion)
9.5.2 Africa
9.5.2.1 Trends Analysis
9.5.2.2 Africa Hydraulic Equipment Market Estimates and Forecasts, by Country (2020-2032) (USD Billion)
9.5.2.3 Africa Hydraulic Equipment Market Estimates and Forecasts, by Component (2020-2032) (USD Billion)
9.5.2.4 Africa Hydraulic Equipment Market Estimates and Forecasts, by Application (2020-2032) (USD Billion)
9.5.2.5 South Africa
9.5.2.5.1 South Africa Hydraulic Equipment Market Estimates and Forecasts, by Component (2020-2032) (USD Billion)
9.5.2.5.2 South Africa Hydraulic Equipment Market Estimates and Forecasts, by Application (2020-2032) (USD Billion)
9.5.2.6 Nigeria
9.5.2.6.1 Nigeria Hydraulic Equipment Market Estimates and Forecasts, by Component (2020-2032) (USD Billion)
9.5.2.6.2 Nigeria Hydraulic Equipment Market Estimates and Forecasts, by Application (2020-2032) (USD Billion)
9.6 Latin America
9.6.1 Trends Analysis
9.6.2 Latin America Hydraulic Equipment Market Estimates and Forecasts, by Country (2020-2032) (USD Billion)
9.6.3 Latin America Hydraulic Equipment Market Estimates and Forecasts, by Component (2020-2032) (USD Billion)
9.6.4 Latin America Hydraulic Equipment Market Estimates and Forecasts, by Application (2020-2032) (USD Billion)
9.6.5 Brazil
9.6.5.1 Brazil Hydraulic Equipment Market Estimates and Forecasts, by Component (2020-2032) (USD Billion)
9.6.5.2 Brazil Hydraulic Equipment Market Estimates and Forecasts, by Application (2020-2032) (USD Billion)
9.6.6 Argentina
9.6.6.1 Argentina Hydraulic Equipment Market Estimates and Forecasts, by Component (2020-2032) (USD Billion)
9.6.6.2 Argentina Hydraulic Equipment Market Estimates and Forecasts, by Application (2020-2032) (USD Billion)
9.6.7 Colombia
9.6.7.1 Colombia Hydraulic Equipment Market Estimates and Forecasts, by Component (2020-2032) (USD Billion)
9.6.7.2 Colombia Hydraulic Equipment Market Estimates and Forecasts, by Application (2020-2032) (USD Billion)
9.6.8 Rest of Latin America
9.6.8.1 Rest of Latin America Hydraulic Equipment Market Estimates and Forecasts, by Component (2020-2032) (USD Billion)
9.6.8.2 Rest of Latin America Hydraulic Equipment Market Estimates and Forecasts, by Application (2020-2032) (USD Billion)
11.1 Bosch Rexroth
11.1.1 Company Overview
11.1.2 Financial
11.1.3 Products/ Services Offered
11.1.4 SWOT Analysis
11.2 Eaton Corporation Plc
11.2.1 Company Overview
11.2.2 Financial
11.2.3 Products/ Services Offered
11.2.4 SWOT Analysis
11.3 Parker Hannifin
11.3.1 Company Overview
11.3.2 Financial
11.3.3 Products/ Services Offered
11.3.4 SWOT Analysis
11.4 Kawasaki
11.4.1 Company Overview
11.4.2 Financial
11.4.3 Products/ Services Offered
11.4.4 SWOT Analysis
11.5 HAWE Hydraulik
11.5.1 Company Overview
11.5.2 Financial
11.5.3 Products/ Services Offered
11.5.4 SWOT Analysis
11.6 Hydac, Moog, Inc.
11.6.1 Company Overview
11.6.2 Financial
11.6.3 Products/ Services Offered
11.6.4 SWOT Analysis
11.7 Bucher Hydraulics
11.7.1 Company Overview
11.7.2 Financial
11.7.3 Products/ Services Offered
11.7.4 SWOT Analysis
11.8 Daikin Industries Ltd.
11.8.1 Company Overview
11.8.2 Financial
11.8.3 Products/ Services Offered
11.8.4 SWOT Analysis
11.9 Concentric AB
11.9.1 Company Overview
11.9.2 Financial
11.9.3 Products/ Services Offered
11.9.4 SWOT Analysis
11.10 Casappa, Nachi-Fujikoshi Corp.
11.10.1 Company Overview
11.10.2 Financial
11.10.3 Products/ Services Offered
11.10.4 SWOT Analysis
12. Use Cases and Best Practices
13. Conclusion
An accurate research report requires proper strategizing as well as implementation. There are multiple factors involved in the completion of good and accurate research report and selecting the best methodology to compete the research is the toughest part. Since the research reports we provide play a crucial role in any company’s decision-making process, therefore we at SNS Insider always believe that we should choose the best method which gives us results closer to reality. This allows us to reach at a stage wherein we can provide our clients best and accurate investment to output ratio.
Each report that we prepare takes a timeframe of 350-400 business hours for production. Starting from the selection of titles through a couple of in-depth brain storming session to the final QC process before uploading our titles on our website we dedicate around 350 working hours. The titles are selected based on their current market cap and the foreseen CAGR and growth.
The 5 steps process:
Step 1: Secondary Research:
Secondary Research or Desk Research is as the name suggests is a research process wherein, we collect data through the readily available information. In this process we use various paid and unpaid databases which our team has access to and gather data through the same. This includes examining of listed companies’ annual reports, Journals, SEC filling etc. Apart from this our team has access to various associations across the globe across different industries. Lastly, we have exchange relationships with various university as well as individual libraries.

Step 2: Primary Research
When we talk about primary research, it is a type of study in which the researchers collect relevant data samples directly, rather than relying on previously collected data. This type of research is focused on gaining content specific facts that can be sued to solve specific problems. Since the collected data is fresh and first hand therefore it makes the study more accurate and genuine.
We at SNS Insider have divided Primary Research into 2 parts.
Part 1 wherein we interview the KOLs of major players as well as the upcoming ones across various geographic regions. This allows us to have their view over the market scenario and acts as an important tool to come closer to the accurate market numbers. As many as 45 paid and unpaid primary interviews are taken from both the demand and supply side of the industry to make sure we land at an accurate judgement and analysis of the market.
This step involves the triangulation of data wherein our team analyses the interview transcripts, online survey responses and observation of on filed participants. The below mentioned chart should give a better understanding of the part 1 of the primary interview.

Part 2: In this part of primary research the data collected via secondary research and the part 1 of the primary research is validated with the interviews from individual consultants and subject matter experts.
Consultants are those set of people who have at least 12 years of experience and expertise within the industry whereas Subject Matter Experts are those with at least 15 years of experience behind their back within the same space. The data with the help of two main processes i.e., FGDs (Focused Group Discussions) and IDs (Individual Discussions). This gives us a 3rd party nonbiased primary view of the market scenario making it a more dependable one while collation of the data pointers.
Step 3: Data Bank Validation
Once all the information is collected via primary and secondary sources, we run that information for data validation. At our intelligence centre our research heads track a lot of information related to the market which includes the quarterly reports, the daily stock prices, and other relevant information. Our data bank server gets updated every fortnight and that is how the information which we collected using our primary and secondary information is revalidated in real time.

Step 4: QA/QC Process
After all the data collection and validation our team does a final level of quality check and quality assurance to get rid of any unwanted or undesired mistakes. This might include but not limited to getting rid of the any typos, duplication of numbers or missing of any important information. The people involved in this process include technical content writers, research heads and graphics people. Once this process is completed the title gets uploader on our platform for our clients to read it.
Step 5: Final QC/QA Process:
This is the last process and comes when the client has ordered the study. In this process a final QA/QC is done before the study is emailed to the client. Since we believe in giving our clients a good experience of our research studies, therefore, to make sure that we do not lack at our end in any way humanly possible we do a final round of quality check and then dispatch the study to the client.
Key Segments
By Component
Pumps
Motors
Valves
Cylinder
Accessories
By Application
Industrial
Mobile
Request for Segment Customization as per your Business Requirement: Segment Customization Request
Regional Coverage
North America
US
Canada
Mexico
Europe
Eastern Europe
Poland
Romania
Hungary
Turkey
Rest of Eastern Europe
Western Europe
Germany
France
UK
Italy
Spain
Netherlands
Switzerland
Austria
Rest of Western Europe
Asia Pacific
China
India
Japan
South Korea
Vietnam
Singapore
Australia
Rest of Asia Pacific
Middle East & Africa
Middle East
UAE
Egypt
Saudi Arabia
Qatar
Rest of the Middle East
Africa
Nigeria
South Africa
Rest of Africa
Latin America
Brazil
Argentina
Colombia
Rest of Latin America
Request for Country Level Research Report: Country Level Customization Request
Available Customization
With the given market data, SNS Insider offers customization as per the company’s specific needs. The following customization options are available for the report:
Product Analysis
Criss-Cross segment analysis (e.g. Product X Application)
Product Matrix which gives a detailed comparison of product portfolio of each company
Geographic Analysis
Additional countries in any of the regions
Company Information
Detailed analysis and profiling of additional market players (Up to five)
The Fluid Handling Systems Market Size was estimated at USD 74.55 billion in 2023 and is expected to arrive at USD 111.28 billion by 2032 with a growing CAGR of 4.55% over the forecast period 2024-2032.
The Oil and Gas Accumulators Market Size was esteemed at USD 2450.5 million in 2023 and is supposed to arrive at USD 4241.9 million by 2031 and develop at a CAGR of 7.1% over the forecast period 2024-2031.
The Elevator and Escalator Market size was estimated at USD 149.2 billion in 2023 and is expected to reach USD 265.2 billion by 2032 at a CAGR of 6.6% during the forecast period of 2024-2032.
The Tension Control Market was estimated at USD 1.07 billion in 2023 and is expected to reach USD 1.78 billion by 2032, with a growing CAGR of 5.83% over the forecast period 2024-2032.
The Material Testing Market Size was estimated at USD 5.98 billion in 2023 and is expected to arrive at USD 8.93 billion by 2032 with a growing CAGR of 4.55% over the forecast period 2024-2032.
The Micromachining Market Size was valued at USD 3 Billion in 2023 and is now anticipated to grow $9.19 Billion by 2031, with a CAGR of 5.26% by 2024-2031.

Hi! Click one of our member below to chat on Phone
© 2025 All Rights Reserved by SNS Insider Pvt Ltd


