image

Hybrid Valve Market Scope & Overview:

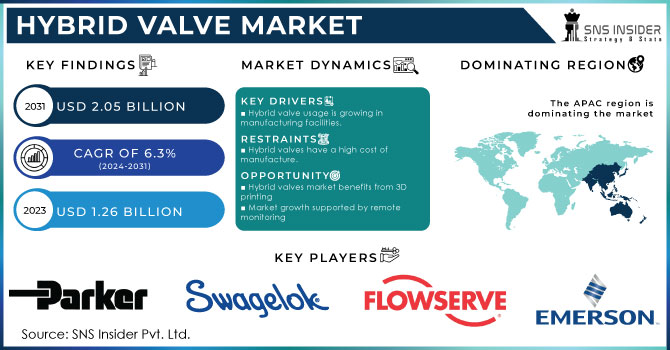
The Hybrid Valve Market Size was esteemed at USD 1.27 billion in 2023 and is supposed to arrive at USD 2.23 billion by 2032 with a growing CAGR of 6.47% over the forecast period 2024-2032. This report offers a detailed analysis of the utilization rates, technological adoption, and export/import data for hybrid valves by region, providing a comprehensive look at market dynamics across various geographies. It also highlights regional trends in hybrid valve innovation, with a focus on R&D investments driving future advancements. Additionally, the report examines the adoption rates of emerging technologies like IoT-enabled hybrid valves, along with insights into supply chain disruptions and their impact on market operations. The trends reflect a growing shift towards automation and sustainability in valve technology, alongside increasing regulatory pressures.

Hybrid Valve Market Revenue Analysis

To get more information on Hybrid Valve Market - Request Free Sample Report

Market Dynamics

Drivers

  • The integration of IoT and automation in hybrid valves is driving market growth by improving control, efficiency, and remote monitoring in key industries.

Technological advancements, particularly the integration of smart technologies like the Internet of Things (IoT) and automation, are significantly driving the demand for hybrid valves. Industries demanding precision and real-time data have been highly attracted to these valves which are now even more effective with improved control, efficiency, and remote monitoring capabilities. IoT-enabled hybrid valves allow operators to monitor the performance of valves remotely, enabling them to reduce downtime and optimize operations by analyzing real-time data for predictive maintenance. Automation simplifies their function with less human involvement for precise valve operations in complex industrial environments. This evolution of technology has resulted in an increase in the hybrid valve market in industries such as oil & gas, water & wastewater, and chemicals where the superior performance of the equipment is a requirement. Furthermore, the current focus on energy efficiency, sustainability, and smart systems is positioning hybrid valves to play a pivotal role in the future of industrial operations, creating additional impetus for the growth of the global hybrid valve market.

Restraint

  • High initial costs of hybrid valves, due to advanced materials and technologies, pose a barrier to adoption, especially for smaller businesses, despite long-term efficiency benefits.

The high initial costs associated with hybrid valves are one of the key factors limiting their widespread adoption, particularly among smaller businesses or those in cost-sensitive industries. Due to their frequent incorporation of sophisticated materials such as tungsten carbide, titanium alloy, or duplex nickel, these valves are relatively expensive to manufacture. Also, hybrid valves have complex technologies like IoT capabilities and automation integrated into them, which hike their price even more. Though more expensive to install in the beginning, these valves can lead to O&Ms decreases and improved reliability that pays for initial costs over the lifespan of the valve. However, despite the price-related challenge, the hybrid valve market is on a path of gradual growth, supported by an increase in industrial demand, where these can be used substantially in sectors such as oil & gas, water & wastewater, and energy. This is also driving up the market for automation and smart infrastructure as industries look for new, smarter ways to work and optimize their performance and sustainability.

Opportunities

  • Emerging markets are driving hybrid valve adoption, fueled by industrial growth, stricter regulations, and the demand for energy-efficient, cost-effective solutions.

Expanding emerging markets present a significant opportunity for the hybrid valve market, driven by rapid industrialization in developing regions such as Asia-Pacific, Latin America, and the Middle East. With the growth in these economies comes a greater need for technologically advanced systems such as hybrid valves to improve operational efficiency, minimize maintenance costs, and comply with strict environmental standards. Hybrid valves are attractive to sectors such as oil & gas, water & wastewater, and chemicals, as they can optimize energy use and improve the way that fluids are controlled. Moreover, hybrid valves offer the perfect answer to reducing energy consumption and carbon emissions, as governments in these regions impose tough environmental policies. This adoption is already driving robust growth for the market through increasing investments in industrial infrastructure and integration of automation technologies. This type of trend suggests that hybrid valve technologies will continue to be developed for more cost-effective and sustainable per market needs in emerging markets.

Challenges

  • Integrating hybrid valves with legacy systems is challenging due to the need for costly modifications and compatibility adjustments, which can hinder adoption.

One of the key challenges in the Hybrid Valve Market is the integration with legacy systems. Other sectors work with existing, aging infrastructure, and it can be expensive and impractical to retrofit their systems with cutting-edge hybrid valves. Hybrid valves typically need alterations to a facility's existing piping, control systems, or valve setups; these changes tend to contribute to increased downtime, maintenance costs, and installation times. Such a price can also discourage companies from harnessing hybrid valves, notably small to medium-sized businesses that likely have limited budgets. However, due to the advancements in automation & IoT and increasing demand for energy efficiency, the Hybrid Valve Market is booming day by day. In this avenue, a clear trend is visible for retrofitting and upgrading legacy systems to incorporate newer technologies. Hybrid valve solutions that can flexibly adapt to company processes are also being developed by manufacturers and can help to overcome this gap between the previous systems and modern innovations. This trend is anticipated to boost the growth of the market, as it will help industries at the time of technological upgrades to transit smoothly in the new market.

Segmentation Analysis

By Material

The Steel segment dominated with a market share of over 32% in 2023, due to its exceptional strength, durability, and cost-effectiveness, making it a go-to option across diverse industries. Steel valves are incredibly versatile and provide reliable performance even in difficult conditions, which is critical in industries like oil and gas, chemicals, and water treatment. Its low cost, corrosion resistance, and ease of manufacturing also support its extensive use. Steel valves continue to be the valve of choice for both critical infrastructure and industrial applications due to their ability to endure extreme levels of pressure and heat. When used in applications that require robust and high-performance valves, its long service life and low maintenance needs help keep steel at the top of most valve markets, supporting the growth of industries dependent on these features.

By Valve Size

The 6" to 25" valve size segment is a significant player in the hybrid valve market due to its essential role in large-scale industrial applications, particularly in chemical operations, oil and gas pipelines, and power plants. These are used for controlling the flow of fluids, gases, and steam through large pipes and similar systems. Because of their size and capacity, they are perfect for handling the large volumes and pressures usually associated with large infrastructure projects. They play a critical role in the safe, efficient, and controlled handling of materials, bridging the gap between complex systems and keeping operations running smoothly and safely. Growth in this segment is fueled by demand in industries where heavy-duty, reliable valves are needed to manage large-scale, high-stakes operations.

By Industry

The chemicals industry segment dominated with a market share of over 34% in 2023, due to its critical role in controlling complex systems within chemical plants. Hybrid valves are commonly used to control the unique sounds and vibrations that are produced by devices such as centrifuge machines, mixers, high-pressure pumps, and pipes. This functionality is critical to ensure optimal performance and prevent mechanical failures. The growing adoption of hybrid valves for various applications is mainly driven by the need for compliance with strict environmental regulations that require efficient as well as sustainable solutions. Besides, Hybrid valves also enhance operational efficiency further by reducing downtime, and saving in performance as well as maintenance costs. Consequently, the chemicals sector remains an influential force in the hybrid valve market.

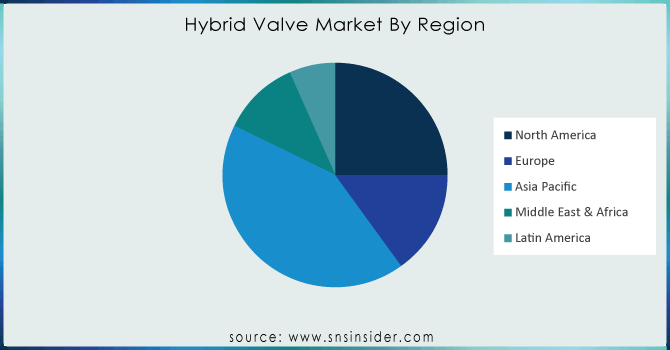
Key Regional Analysis

North America region dominated with a market share of over 38% in 2023, primarily driven by the region's robust industrial infrastructure and the presence of leading valve manufacturers. The combination of automation and smart valve solutions, along with technological advancements, has ensured increased regional dominance. Hybrid valves are gaining traction in all of the above-mentioned key industries that range from oil & gas for sectors that require robust flow control, water treatment for smooth flow management, and laptops leading to the water treatment industry for controlling distribution and as well as the chemical processing, where valves are used to count the flow of chemicals under volatile conditions. Moreover, North America also has strict regulations surrounding the use of industrial processes, about safety and quality standards, which favors the use of high-performance hybrid valves, hence further aiding in the region's dominance in the market.

The Asia-Pacific region is the fastest-growing market for hybrid valves, owing to rapid industrialization and persistent infrastructural developments in emerging economies such as China, India, and Japan. Across the globe, these nations experience higher demand from major industries such as power generation, oil & gas, and chemicals that specialize in hybrid valves to increase efficiency and operational safety. Moreover, the increasing implementation of industrial automation and smart systems across the region is driving market growth. With industries upgrading their infrastructure to keep up with demand, advanced valve technologies see more adoption, and Asia-Pacific is poised to be the epicenter of growth in the hybrid valve market.

Hybrid-Valve-Market-By-Region

Need any customization research on Hybrid Valve Market - Enquiry Now

Some of the major key players in the Hybrid Valve Market

  • Emerson Electric Co. (Fisher Valves, Rosemount Valves)

  • Flowserve Corporation (Valtek Valves, Durco Valves)

  • Parker Hannifin Corporation (Autoclave Engineers, Pneumatic Valves)

  • IMI plc (IMI Critical Engineering, IMI Precision Engineering Valves)

  • Swagelok Company (Swagelok Valves, Tube Fittings)

  • Danfoss A/S (Danfoss Industrial Valves, Pressure Relief Valves)

  • Alfa Laval AB (Alfa Laval Butterfly Valves, Globe Valves)

  • Circor International, Inc. (Varec, Anderson Greenwood Valves)

  • Cameron International Corporation (Cameron Valves, Control Valves)

  • Spirax-Sarco Engineering plc (Spirax-Sarco Steam Valves, Pressure Relief Valves)

  • Pentair plc (Valves, Actuators, & Control Systems)

  • Schlumberger Limited (Hydraulic Valves, Oil & Gas Valves)

  • Kitz Corporation (Kitz Ball Valves, Check Valves)

  • Crane Co. (Crane Valves, Bi-Directional Valves)

  • GE Oil & Gas (Geomechanics, Valve Systems)

  • Samson AG (Samson Pressure Regulating Valves, Control Valves)

  • Curtiss-Wright Corporation (Curtiss-Wright Valves, Pressure Relief Valves)

  • KSB Group (KSB Valves, Control & Safety Valves)

  • Valmet (Valmet Control Valves, Valve Solutions)

  • WIKA Group (WIKA Pressure Relief Valves, Industrial Valves)

Suppliers for (Known for its high-quality engineered valves and actuators, IMI excels in providing reliable and efficient hybrid valve solutions for critical industrial applications) on Hybrid Valve Market

  • Emerson Electric Co.

  • IMI plc

  • Trillium Flow Technologies

  • CIRCOR International, Inc.

  • Parcol S.P.A.

  • Koso Kent Introl Pvt. Ltd.

  • Wuxi Smart Auto-Control Engineering Co. Ltd.

  • Chemtrols Emet Pvt. Ltd.

  • Dymet Alloys

  • Carter Process Control GmbH

Recent Development

In May 2024: Emerson introduced the AVENTICS Series 625 Sentronic Proportional Pressure Control Valves, delivering precision control with less than 0.5% deviation, advanced data acquisition software, and a wide range of flow and pressure capabilities for high-accuracy applications.

In May 2023: Dymet Alloys participated in AlSTech 2023, a conference focused on iron and steel technology. The event provided valuable insights into the engineering and technical expertise needed by steel producers, suppliers, and consultants.

Hybrid Valve Market Report Scope:

Report Attributes Details
Market Size in 2023 USD 1.27 Billion
Market Size by 2032 USD 2.23 Billion
CAGR CAGR of 6.47%  From 2024 to 2032
Base Year 2023
Forecast Period 2024-2032
Historical Data 2020-2022
Report Scope & Coverage Market Size, Segments Analysis, Competitive  Landscape, Regional Analysis, DROC & SWOT Analysis, Forecast Outlook
Key Segments • By Material (Steel, Tungsten Carbide, Duplex Nickel, Titanium Alloy, Others (Brass, Bronze, and Plastic))
• By Valve Size (Up to 1”, 1” to 6”, 6” to 25”, 25” to 50”, 50” and Larger)
• By Industry (Oil & Gas, Energy & Power, Water & Wastewater, Building & Construction, Chemicals, Pharmaceuticals, Agriculture, Metal & Mining, Paper & Pulp, Food & Beverages, Others (Semiconductor, Textile, and Glass)).
Regional Analysis/Coverage North America (US, Canada, Mexico), Europe (Eastern Europe [Poland, Romania, Hungary, Turkey, Rest of Eastern Europe] Western Europe] Germany, France, UK, Italy, Spain, Netherlands, Switzerland, Austria, Rest of Western Europe]), Asia Pacific (China, India, Japan, South Korea, Vietnam, Singapore, Australia, Rest of Asia Pacific), Middle East & Africa (Middle East [UAE, Egypt, Saudi Arabia, Qatar, Rest of Middle East], Africa [Nigeria, South Africa, Rest of Africa], Latin America (Brazil, Argentina, Colombia, Rest of Latin America)
Company Profiles Emerson Electric Co., Flowserve Corporation, Parker Hannifin Corporation, IMI plc, Swagelok Company, Danfoss A/S, Alfa Laval AB, Circor International, Inc., Cameron International Corporation, Spirax-Sarco Engineering plc, Pentair plc, Schlumberger Limited, Kitz Corporation, Crane Co., GE Oil & Gas, Samson AG, Curtiss-Wright Corporation, KSB Group, Valmet, WIKA Group.


Frequently Asked Questions

The Hybrid Valve Market is expected to grow at a CAGR of 6.3% from 2023 to 2030.

According to our analysis, the Hybrid Valve Market is anticipated to reach USD 2.07 billion By 2030.

The market for hybrid valves in the chemical sector is anticipated to expand significantly during the coming years. Due to the enormous number of potential in-situ noise sources and the size of facilities, hybrid valves are increasingly used for regulating distinctive and complicated noises and acoustical problems generated in chemical plants. Centrifugal machines, mixers, high-pressure pumps, valves, and related pipelines all produce noise that could be harmful to workers' health and upset the neighborhood. A further reason boosting demand for hybrid valves in the chemicals industry is the increase in consent decrees on air, noise, and water pollution enforced in refineries.

The leading participants the Emerson Electric Co., Flowserve Corporation, Parker Hannifin Corporation, IMI plc, Swagelok Company, and Danfoss A/S.

Yes, you may request customization based on your company's needs.

TABLE OF CONTENT

1. Introduction

1.1 Market Definition

1.2 Scope (Inclusion and Exclusions)

1.3 Research Assumptions

2. Executive Summary

2.1 Market Overview

2.2 Regional Synopsis

2.3 Competitive Summary

3. Research Methodology

3.1 Top-Down Approach

3.2 Bottom-up Approach

3.3. Data Validation

3.4 Primary Interviews

4. Market Dynamics

4.1 Market Analysis

4.1.1 Drivers

4.1.2 Restraints

4.1.3 Opportunities

4.1.4 Challenges

4.2 PESTLE Analysis

4.3 Porter’s Five Forces Model

5. Statistical Insights and Trends Reporting

5.1 Utilization Rates of Hybrid Valves, by Region (2020-2023)

5.2 Technological Adoption Rates, by Region

5.3 Export/Import Data for Hybrid Valves, by Region (2023)

5.4 Trends in Hybrid Valve Innovation and R&D Investments by Region

6. Competitive Landscape

6.1 List of Major Companies, By Region

6.2 Market Share Analysis, By Region

6.3 Product Benchmarking

6.3.1 Product specifications and features

6.3.2 Pricing

6.4 Strategic Initiatives

6.4.1 Marketing and promotional activities

6.4.2 Distribution and Supply Chain Strategies

6.4.3 Expansion plans and new product launches

6.4.4 Strategic partnerships and collaborations

6.5 Technological Advancements

6.6 Market Positioning and Branding

7. Hybrid Valve Market Segmentation, By Material

7.1 Chapter Overview

7.2 steel

7.2.1 Steel Market Trends Analysis (2020-2032)

7.2.2 Steel Market Size Estimates and Forecasts to 2032 (USD Billion)

7.3 Tungsten Carbide

7.3.1 Tungsten Carbide Market Trends Analysis (2020-2032)

7.3.2 Tungsten Carbide Market Size Estimates and Forecasts to 2032 (USD Billion)

7.4 Duplex Nickel

7.4.1 Duplex Nickel Market Trends Analysis (2020-2032)

7.4.2 Duplex Nickel Market Size Estimates and Forecasts to 2032 (USD Billion)

7.5 Titanium 

7.5.1 Titanium Market Trends Analysis (2020-2032)

7.5.2 Titanium Market Size Estimates and Forecasts to 2032 (USD Billion)

7.6 Alloy

7.6.1 Alloy Market Trends Analysis (2020-2032)

7.6.2 Alloy Market Size Estimates and Forecasts to 2032 (USD Billion)

7.7 Others (Brass, Bronze, and Plastic)

7.7.1 Others (Brass, Bronze, and Plastic) Market Trends Analysis (2020-2032)

7.7.2 Others (Brass, Bronze, and Plastic) Market Size Estimates and Forecasts to 2032 (USD Billion)

8. Hybrid Valve Market Segmentation, By Valve Size

8.1 Chapter Overview

8.2 Up To 1”

8.2.1 Up To 1” Market Trends Analysis (2020-2032)

8.2.2 Up To 1” Market Size Estimates and Forecasts to 2032 (USD Billion)

8.3 1” to 6”

8.3.1 1” to 6” Market Trends Analysis (2020-2032)

8.3.2 1” to 6” Market Size Estimates and Forecasts to 2032 (USD Billion)

8.4 6” to 25”

8.3.1 6” to 25” Market Trends Analysis (2020-2032)

8.3.2 6” to 25” Market Size Estimates and Forecasts to 2032 (USD Billion)

8.5 25” to 50”

8.3.1 25” to 50” Market Trends Analysis (2020-2032)

8.3.2 25” to 50” Market Size Estimates and Forecasts to 2032 (USD Billion)

8.6 50” and Larger

8.6.1 50” and Larger Market Trends Analysis (2020-2032)

8.6.2 50” and Larger Market Size Estimates and Forecasts to 2032 (USD Billion)

9. Hybrid Valve Market Segmentation, By Industry

9.1 Chapter Overview

9.2 Oil & Gas

9.2.1 Oil & Gas Market Trends Analysis (2020-2032)

9.2.2 Oil & Gas Market Size Estimates and Forecasts to 2032 (USD Billion)

9.3 Energy & Power

9.3.1 Energy & Power Market Trends Analysis (2020-2032)

9.3.2 Energy & Power Market Size Estimates and Forecasts to 2032 (USD Billion)

9.4 Water & Wastewater

9.4.1 Water & Wastewater Market Trends Analysis (2020-2032)

9.4.2 Water & Wastewater Market Size Estimates and Forecasts to 2032 (USD Billion)

9.5 Building & Construction

9.5.1 Building & Construction Market Trends Analysis (2020-2032)

9.5.2 Building & Construction Market Size Estimates and Forecasts to 2032 (USD Billion)

9.6 Chemicals

9.6.1 Chemicals Market Trends Analysis (2020-2032)

9.6.2 Chemicals Market Size Estimates and Forecasts to 2032 (USD Billion)

9.7 Pharmaceuticals

9.7.1 Pharmaceuticals Market Trends Analysis (2020-2032)

9.7.2 Pharmaceuticals Market Size Estimates and Forecasts to 2032 (USD Billion)

9.8 Agriculture

9.8.1 Agriculture Market Trends Analysis (2020-2032)

9.8.2 Agriculture Market Size Estimates and Forecasts to 2032 (USD Billion)

9.9 Metal & Mining

9.9.1 Metal & Mining Market Trends Analysis (2020-2032)

9.9.2 Metal & Mining Market Size Estimates and Forecasts to 2032 (USD Billion)

9.10 Paper & Pulp

9.10.1 Paper & Pulp Market Trends Analysis (2020-2032)

9.10.2 Paper & Pulp Market Size Estimates and Forecasts to 2032 (USD Billion)

9.11 Food & Beverages

9.11.1 Food & Beverages Market Trends Analysis (2020-2032)

9.11.2 Food & Beverages Market Size Estimates and Forecasts to 2032 (USD Billion)

9.12 Others (Semiconductor, Textile, and Glass)

9.12.1 Others (Semiconductor, Textile, and Glass) Market Trends Analysis (2020-2032)

9.12.2 Others (Semiconductor, Textile, and Glass) Market Size Estimates and Forecasts to 2032 (USD Billion)

10. Regional Analysis

10.1 Chapter Overview

10.2 North America

10.2.1 Trends Analysis

10.2.2 North America Hybrid Valve Market Estimates and Forecasts, by Country (2020-2032) (USD Billion)

10.2.3 North America Hybrid Valve Market Estimates and Forecasts, By Material (2020-2032) (USD Billion) 

10.2.4 North America Hybrid Valve Market Estimates and Forecasts, By Valve Size (2020-2032) (USD Billion)

10.2.5 North America Hybrid Valve Market Estimates and Forecasts, By Industry (2020-2032) (USD Billion)

10.2.6 USA

10.2.6.1 USA Hybrid Valve Market Estimates and Forecasts, By Material (2020-2032) (USD Billion)

10.2.6.2 USA Hybrid Valve Market Estimates and Forecasts, By Valve Size (2020-2032) (USD Billion)

10.2.6.3 USA Hybrid Valve Market Estimates and Forecasts, By Industry (2020-2032) (USD Billion)

10.2.7 Canada

10.2.7.1 Canada Hybrid Valve Market Estimates and Forecasts, By Material (2020-2032) (USD Billion)

10.2.7.2 Canada Hybrid Valve Market Estimates and Forecasts, By Valve Size (2020-2032) (USD Billion)

10.2.7.3 Canada Hybrid Valve Market Estimates and Forecasts, By Industry (2020-2032) (USD Billion)

10.2.8 Mexico

10.2.8.1 Mexico Hybrid Valve Market Estimates and Forecasts, By Material (2020-2032) (USD Billion)

10.2.8.2 Mexico Hybrid Valve Market Estimates and Forecasts, By Valve Size (2020-2032) (USD Billion)

10.2.8.3 Mexico Hybrid Valve Market Estimates and Forecasts, By Industry (2020-2032) (USD Billion)

10.3 Europe

10.3.1 Eastern Europe

10.3.1.1 Trends Analysis

10.3.1.2 Eastern Europe Hybrid Valve Market Estimates and Forecasts, by Country (2020-2032) (USD Billion)

10.3.1.3 Eastern Europe Hybrid Valve Market Estimates and Forecasts, By Material (2020-2032) (USD Billion) 

10.3.1.4 Eastern Europe Hybrid Valve Market Estimates and Forecasts, By Valve Size (2020-2032) (USD Billion)

10.3.1.5 Eastern Europe Hybrid Valve Market Estimates and Forecasts, By Industry (2020-2032) (USD Billion)

10.3.1.6 Poland

10.3.1.6.1 Poland Hybrid Valve Market Estimates and Forecasts, By Material (2020-2032) (USD Billion)

10.3.1.6.2 Poland Hybrid Valve Market Estimates and Forecasts, By Valve Size (2020-2032) (USD Billion)

10.3.1.6.3 Poland Hybrid Valve Market Estimates and Forecasts, By Industry (2020-2032) (USD Billion)

10.3.1.7 Romania

10.3.1.7.1 Romania Hybrid Valve Market Estimates and Forecasts, By Material (2020-2032) (USD Billion)

10.3.1.7.2 Romania Hybrid Valve Market Estimates and Forecasts, By Valve Size (2020-2032) (USD Billion)

10.3.1.7.3 Romania Hybrid Valve Market Estimates and Forecasts, By Industry (2020-2032) (USD Billion)

10.3.1.8 Hungary

10.3.1.8.1 Hungary Hybrid Valve Market Estimates and Forecasts, By Material (2020-2032) (USD Billion)

10.3.1.8.2 Hungary Hybrid Valve Market Estimates and Forecasts, By Valve Size (2020-2032) (USD Billion)

10.3.1.8.3 Hungary Hybrid Valve Market Estimates and Forecasts, By Industry (2020-2032) (USD Billion)

10.3.1.9 Turkey

10.3.1.9.1 Turkey Hybrid Valve Market Estimates and Forecasts, By Material (2020-2032) (USD Billion)

10.3.1.9.2 Turkey Hybrid Valve Market Estimates and Forecasts, By Valve Size (2020-2032) (USD Billion)

10.3.1.9.3 Turkey Hybrid Valve Market Estimates and Forecasts, By Industry (2020-2032) (USD Billion)

10.3.1.10 Rest of Eastern Europe

10.3.1.10.1 Rest of Eastern Europe Hybrid Valve Market Estimates and Forecasts, By Material (2020-2032) (USD Billion)

10.3.1.10.2 Rest of Eastern Europe Hybrid Valve Market Estimates and Forecasts, By Valve Size (2020-2032) (USD Billion)

10.3.1.10.3 Rest of Eastern Europe Hybrid Valve Market Estimates and Forecasts, By Industry (2020-2032) (USD Billion)

10.3.2 Western Europe

10.3.2.1 Trends Analysis

10.3.2.2 Western Europe Hybrid Valve Market Estimates and Forecasts, by Country (2020-2032) (USD Billion)

10.3.2.3 Western Europe Hybrid Valve Market Estimates and Forecasts, By Material (2020-2032) (USD Billion) 

10.3.2.4 Western Europe Hybrid Valve Market Estimates and Forecasts, By Valve Size (2020-2032) (USD Billion)

10.3.2.5 Western Europe Hybrid Valve Market Estimates and Forecasts, By Industry (2020-2032) (USD Billion)

10.3.2.6 Germany

10.3.2.6.1 Germany Hybrid Valve Market Estimates and Forecasts, By Material (2020-2032) (USD Billion)

10.3.2.6.2 Germany Hybrid Valve Market Estimates and Forecasts, By Valve Size (2020-2032) (USD Billion)

10.3.2.6.3 Germany Hybrid Valve Market Estimates and Forecasts, By Industry (2020-2032) (USD Billion)

10.3.2.7 France

10.3.2.7.1 France Hybrid Valve Market Estimates and Forecasts, By Material (2020-2032) (USD Billion)

10.3.2.7.2 France Hybrid Valve Market Estimates and Forecasts, By Valve Size (2020-2032) (USD Billion)

10.3.2.7.3 France Hybrid Valve Market Estimates and Forecasts, By Industry (2020-2032) (USD Billion)

10.3.2.8 UK

10.3.2.8.1 UK Hybrid Valve Market Estimates and Forecasts, By Material (2020-2032) (USD Billion)

10.3.2.8.2 UK Hybrid Valve Market Estimates and Forecasts, By Valve Size (2020-2032) (USD Billion)

10.3.2.8.3 UK Hybrid Valve Market Estimates and Forecasts, By Industry (2020-2032) (USD Billion)

10.3.2.9 Italy

10.3.2.9.1 Italy Hybrid Valve Market Estimates and Forecasts, By Material (2020-2032) (USD Billion)

10.3.2.9.2 Italy Hybrid Valve Market Estimates and Forecasts, By Valve Size (2020-2032) (USD Billion)

10.3.2.9.3 Italy Hybrid Valve Market Estimates and Forecasts, By Industry (2020-2032) (USD Billion)

10.3.2.10 Spain

10.3.2.10.1 Spain Hybrid Valve Market Estimates and Forecasts, By Material (2020-2032) (USD Billion)

10.3.2.10.2 Spain Hybrid Valve Market Estimates and Forecasts, By Valve Size (2020-2032) (USD Billion)

10.3.2.10.3 Spain Hybrid Valve Market Estimates and Forecasts, By Industry (2020-2032) (USD Billion)

10.3.2.11 Netherlands

10.3.2.11.1 Netherlands Hybrid Valve Market Estimates and Forecasts, By Material (2020-2032) (USD Billion)

10.3.2.11.2 Netherlands Hybrid Valve Market Estimates and Forecasts, By Valve Size (2020-2032) (USD Billion)

10.3.2.11.3 Netherlands Hybrid Valve Market Estimates and Forecasts, By Industry (2020-2032) (USD Billion)

10.3.2.12 Switzerland

10.3.2.12.1 Switzerland Hybrid Valve Market Estimates and Forecasts, By Material (2020-2032) (USD Billion)

10.3.2.12.2 Switzerland Hybrid Valve Market Estimates and Forecasts, By Valve Size (2020-2032) (USD Billion)

10.3.2.12.3 Switzerland Hybrid Valve Market Estimates and Forecasts, By Industry (2020-2032) (USD Billion)

10.3.2.13 Austria

10.3.2.13.1 Austria Hybrid Valve Market Estimates and Forecasts, By Material (2020-2032) (USD Billion)

10.3.2.13.2 Austria Hybrid Valve Market Estimates and Forecasts, By Valve Size (2020-2032) (USD Billion)

10.3.2.13.3 Austria Hybrid Valve Market Estimates and Forecasts, By Industry (2020-2032) (USD Billion)

10.3.2.14 Rest of Western Europe

10.3.2.14.1 Rest of Western Europe Hybrid Valve Market Estimates and Forecasts, By Material (2020-2032) (USD Billion)

10.3.2.14.2 Rest of Western Europe Hybrid Valve Market Estimates and Forecasts, By Valve Size (2020-2032) (USD Billion)

10.3.2.14.3 Rest of Western Europe Hybrid Valve Market Estimates and Forecasts, By Industry (2020-2032) (USD Billion)

10.4 Asia-Pacific

10.4.1 Trends Analysis

10.4.2 Asia-Pacific Hybrid Valve Market Estimates and Forecasts, by Country (2020-2032) (USD Billion)

10.4.3 Asia-Pacific Hybrid Valve Market Estimates and Forecasts, By Material (2020-2032) (USD Billion) 

10.4.4 Asia-Pacific Hybrid Valve Market Estimates and Forecasts, By Valve Size (2020-2032) (USD Billion)

10.4.5 Asia-Pacific Hybrid Valve Market Estimates and Forecasts, By Industry (2020-2032) (USD Billion)

10.4.6 China

10.4.6.1 China Hybrid Valve Market Estimates and Forecasts, By Material (2020-2032) (USD Billion)

10.4.6.2 China Hybrid Valve Market Estimates and Forecasts, By Valve Size (2020-2032) (USD Billion)

10.4.6.3 China Hybrid Valve Market Estimates and Forecasts, By Industry (2020-2032) (USD Billion)

10.4.7 India

10.4.7.1 India Hybrid Valve Market Estimates and Forecasts, By Material (2020-2032) (USD Billion)

10.4.7.2 India Hybrid Valve Market Estimates and Forecasts, By Valve Size (2020-2032) (USD Billion)

10.4.7.3 India Hybrid Valve Market Estimates and Forecasts, By Industry (2020-2032) (USD Billion)

10.4.8 Japan

10.4.8.1 Japan Hybrid Valve Market Estimates and Forecasts, By Material (2020-2032) (USD Billion)

10.4.8.2 Japan Hybrid Valve Market Estimates and Forecasts, By Valve Size (2020-2032) (USD Billion)

10.4.8.3 Japan Hybrid Valve Market Estimates and Forecasts, By Industry (2020-2032) (USD Billion)

10.4.9 South Korea

10.4.9.1 South Korea Hybrid Valve Market Estimates and Forecasts, By Material (2020-2032) (USD Billion)

10.4.9.2 South Korea Hybrid Valve Market Estimates and Forecasts, By Valve Size (2020-2032) (USD Billion)

10.4.9.3 South Korea Hybrid Valve Market Estimates and Forecasts, By Industry (2020-2032) (USD Billion)

10.4.10 Vietnam

10.4.10.1 Vietnam Hybrid Valve Market Estimates and Forecasts, By Material (2020-2032) (USD Billion)

10.4.10.2 Vietnam Hybrid Valve Market Estimates and Forecasts, By Valve Size (2020-2032) (USD Billion)

10.4.10.3 Vietnam Hybrid Valve Market Estimates and Forecasts, By Industry (2020-2032) (USD Billion)

10.4.11 Singapore

10.4.11.1 Singapore Hybrid Valve Market Estimates and Forecasts, By Material (2020-2032) (USD Billion)

10.4.11.2 Singapore Hybrid Valve Market Estimates and Forecasts, By Valve Size (2020-2032) (USD Billion)

10.4.11.3 Singapore Hybrid Valve Market Estimates and Forecasts, By Industry (2020-2032) (USD Billion)

10.4.12 Australia

10.4.12.1 Australia Hybrid Valve Market Estimates and Forecasts, By Material (2020-2032) (USD Billion)

10.4.12.2 Australia Hybrid Valve Market Estimates and Forecasts, By Valve Size (2020-2032) (USD Billion)

10.4.12.3 Australia Hybrid Valve Market Estimates and Forecasts, By Industry (2020-2032) (USD Billion)

10.4.13 Rest of Asia-Pacific

10.4.13.1 Rest of Asia-Pacific Hybrid Valve Market Estimates and Forecasts, By Material (2020-2032) (USD Billion)

10.4.13.2 Rest of Asia-Pacific Hybrid Valve Market Estimates and Forecasts, By Valve Size (2020-2032) (USD Billion)

10.4.13.3 Rest of Asia-Pacific Hybrid Valve Market Estimates and Forecasts, By Industry (2020-2032) (USD Billion)

10.5 Middle East and Africa

10.5.1 Middle East

10.5.1.1 Trends Analysis

10.5.1.2 Middle East Hybrid Valve Market Estimates and Forecasts, by Country (2020-2032) (USD Billion)

10.5.1.3 Middle East Hybrid Valve Market Estimates and Forecasts, By Material (2020-2032) (USD Billion) 

10.5.1.4 Middle East Hybrid Valve Market Estimates and Forecasts, By Valve Size (2020-2032) (USD Billion)

10.5.1.5 Middle East Hybrid Valve Market Estimates and Forecasts, By Industry (2020-2032) (USD Billion)

10.5.1.6 UAE

10.5.1.6.1 UAE Hybrid Valve Market Estimates and Forecasts, By Material (2020-2032) (USD Billion)

10.5.1.6.2 UAE Hybrid Valve Market Estimates and Forecasts, By Valve Size (2020-2032) (USD Billion)

10.5.1.6.3 UAE Hybrid Valve Market Estimates and Forecasts, By Industry (2020-2032) (USD Billion)

10.5.1.7 Egypt

10.5.1.7.1 Egypt Hybrid Valve Market Estimates and Forecasts, By Material (2020-2032) (USD Billion)

10.5.1.7.2 Egypt Hybrid Valve Market Estimates and Forecasts, By Valve Size (2020-2032) (USD Billion)

10.5.1.7.3 Egypt Hybrid Valve Market Estimates and Forecasts, By Industry (2020-2032) (USD Billion)

10.5.1.8 Saudi Arabia

10.5.1.8.1 Saudi Arabia Hybrid Valve Market Estimates and Forecasts, By Material (2020-2032) (USD Billion)

10.5.1.8.2 Saudi Arabia Hybrid Valve Market Estimates and Forecasts, By Valve Size (2020-2032) (USD Billion)

10.5.1.8.3 Saudi Arabia Hybrid Valve Market Estimates and Forecasts, By Industry (2020-2032) (USD Billion)

10.5.1.9 Qatar

10.5.1.9.1 Qatar Hybrid Valve Market Estimates and Forecasts, By Material (2020-2032) (USD Billion)

10.5.1.9.2 Qatar Hybrid Valve Market Estimates and Forecasts, By Valve Size (2020-2032) (USD Billion)

10.5.1.9.3 Qatar Hybrid Valve Market Estimates and Forecasts, By Industry (2020-2032) (USD Billion)

10.5.1.10 Rest of Middle East

10.5.1.10.1 Rest of Middle East Hybrid Valve Market Estimates and Forecasts, By Material (2020-2032) (USD Billion)

10.5.1.10.2 Rest of Middle East Hybrid Valve Market Estimates and Forecasts, By Valve Size (2020-2032) (USD Billion)

10.5.1.10.3 Rest of Middle East Hybrid Valve Market Estimates and Forecasts, By Industry (2020-2032) (USD Billion)

10.5.2 Africa

10.5.2.1 Trends Analysis

10.5.2.2 Africa Hybrid Valve Market Estimates and Forecasts, by Country (2020-2032) (USD Billion)

10.5.2.3 Africa Hybrid Valve Market Estimates and Forecasts, By Material (2020-2032) (USD Billion) 

10.5.2.4 Africa Hybrid Valve Market Estimates and Forecasts, By Valve Size (2020-2032) (USD Billion)

10.5.2.5 Africa Hybrid Valve Market Estimates and Forecasts, By Industry (2020-2032) (USD Billion)

10.5.2.6 South Africa

10.5.2.6.1 South Africa Hybrid Valve Market Estimates and Forecasts, By Material (2020-2032) (USD Billion)

10.5.2.6.2 South Africa Hybrid Valve Market Estimates and Forecasts, By Valve Size (2020-2032) (USD Billion)

10.5.2.6.3 South Africa Hybrid Valve Market Estimates and Forecasts, By Industry (2020-2032) (USD Billion)

10.5.2.7 Nigeria

10.5.2.7.1 Nigeria Hybrid Valve Market Estimates and Forecasts, By Material (2020-2032) (USD Billion)

10.5.2.7.2 Nigeria Hybrid Valve Market Estimates and Forecasts, By Valve Size (2020-2032) (USD Billion)

10.5.2.7.3 Nigeria Hybrid Valve Market Estimates and Forecasts, By Industry (2020-2032) (USD Billion)

10.5.2.8 Rest of Africa

10.5.2.8.1 Rest of Africa Hybrid Valve Market Estimates and Forecasts, By Material (2020-2032) (USD Billion)

10.5.2.8.2 Rest of Africa Hybrid Valve Market Estimates and Forecasts, By Valve Size (2020-2032) (USD Billion)

10.5.2.8.3 Rest of Africa Hybrid Valve Market Estimates and Forecasts, By Industry (2020-2032) (USD Billion)

10.6 Latin America

10.6.1 Trends Analysis

10.6.2 Latin America Hybrid Valve Market Estimates and Forecasts, by Country (2020-2032) (USD Billion)

10.6.3 Latin America Hybrid Valve Market Estimates and Forecasts, By Material (2020-2032) (USD Billion) 

10.6.4 Latin America Hybrid Valve Market Estimates and Forecasts, By Valve Size (2020-2032) (USD Billion)

10.6.5 Latin America Hybrid Valve Market Estimates and Forecasts, By Industry (2020-2032) (USD Billion)

10.6.6 Brazil

10.6.6.1 Brazil Hybrid Valve Market Estimates and Forecasts, By Material (2020-2032) (USD Billion)

10.6.6.2 Brazil Hybrid Valve Market Estimates and Forecasts, By Valve Size (2020-2032) (USD Billion)

10.6.6.3 Brazil Hybrid Valve Market Estimates and Forecasts, By Industry (2020-2032) (USD Billion)

10.6.7 Argentina

10.6.7.1 Argentina Hybrid Valve Market Estimates and Forecasts, By Material (2020-2032) (USD Billion)

10.6.7.2 Argentina Hybrid Valve Market Estimates and Forecasts, By Valve Size (2020-2032) (USD Billion)

10.6.7.3 Argentina Hybrid Valve Market Estimates and Forecasts, By Industry (2020-2032) (USD Billion)

10.6.8 Colombia

10.6.8.1 Colombia Hybrid Valve Market Estimates and Forecasts, By Material (2020-2032) (USD Billion)

10.6.8.2 Colombia Hybrid Valve Market Estimates and Forecasts, By Valve Size (2020-2032) (USD Billion)

10.6.8.3 Colombia Hybrid Valve Market Estimates and Forecasts, By Industry (2020-2032) (USD Billion)

10.6.9 Rest of Latin America

10.6.9.1 Rest of Latin America Hybrid Valve Market Estimates and Forecasts, By Material (2020-2032) (USD Billion)

10.6.9.2 Rest of Latin America Hybrid Valve Market Estimates and Forecasts, By Valve Size (2020-2032) (USD Billion)

10.6.9.3 Rest of Latin America Hybrid Valve Market Estimates and Forecasts, By Industry (2020-2032) (USD Billion)

11. Company Profiles

11.1 Emerson Electric Co.

11.1.1 Company Overview

11.1.2 Financial

11.1.3 Products/ Services Offered

11.1.4 SWOT Analysis

11.2 Flowserve Corporation

             11.2.1 Company Overview

11.2.2 Financial

11.2.3 Products/ Services Offered

11.2.4 SWOT Analysis

11.3 Parker Hannifin Corporation

11.3.1 Company Overview

11.3.2 Financial

11.3.3 Products/ Services Offered

11.3.4 SWOT Analysis

11.4 IMI plc

11.4.1 Company Overview

11.4.2 Financial

11.4.3 Products/ Services Offered

11.4.4 SWOT Analysis

11.5 Swagelok Company

11.5.1 Company Overview

11.5.2 Financial

11.5.3 Products/ Services Offered

11.5.4 SWOT Analysis

11.6 Danfoss A/S

11.6.1 Company Overview

11.6.2 Financial

11.6.3 Products/ Services Offered

11.6.4 SWOT Analysis

11.7 Alfa Laval AB

             11.7.1 Company Overview

11.7.2 Financial

11.7.3 Products/ Services Offered

11.7.4 SWOT Analysis

11.8 Circor International, Inc.

11.8.1 Company Overview

11.8.2 Financial

11.8.3 Products/ Services Offered

11.8.4 SWOT Analysis

11.9 Cameron International Corporation

             11.9.1 Company Overview

11.9.2 Financial

11.9.3 Products/ Services Offered

11.9.4 SWOT Analysis

11.10 Spirax-Sarco Engineering plc

11.10.1 Company Overview

11.10.2 Financial

11.10.3 Products/ Services Offered

11.10.4 SWOT Analysis

12. Use Cases and Best Practices

13. Conclusion

An accurate research report requires proper strategizing as well as implementation. There are multiple factors involved in the completion of good and accurate research report and selecting the best methodology to compete the research is the toughest part. Since the research reports we provide play a crucial role in any company’s decision-making process, therefore we at SNS Insider always believe that we should choose the best method which gives us results closer to reality. This allows us to reach at a stage wherein we can provide our clients best and accurate investment to output ratio.

Each report that we prepare takes a timeframe of 350-400 business hours for production. Starting from the selection of titles through a couple of in-depth brain storming session to the final QC process before uploading our titles on our website we dedicate around 350 working hours. The titles are selected based on their current market cap and the foreseen CAGR and growth.


The 5 steps process:

Step 1: Secondary Research:

Secondary Research or Desk Research is as the name suggests is a research process wherein, we collect data through the readily available information. In this process we use various paid and unpaid databases which our team has access to and gather data through the same. This includes examining of listed companies’ annual reports, Journals, SEC filling etc. Apart from this our team has access to various associations across the globe across different industries. Lastly, we have exchange relationships with various university as well as individual libraries.

Secondary Research

Step 2: Primary Research

When we talk about primary research, it is a type of study in which the researchers collect relevant data samples directly, rather than relying on previously collected data.  This type of research is focused on gaining content specific facts that can be sued to solve specific problems. Since the collected data is fresh and first hand therefore it makes the study more accurate and genuine.

We at SNS Insider have divided Primary Research into 2 parts.

Part 1 wherein we interview the KOLs of major players as well as the upcoming ones across various geographic regions. This allows us to have their view over the market scenario and acts as an important tool to come closer to the accurate market numbers. As many as 45 paid and unpaid primary interviews are taken from both the demand and supply side of the industry to make sure we land at an accurate judgement and analysis of the market.

This step involves the triangulation of data wherein our team analyses the interview transcripts, online survey responses and observation of on filed participants. The below mentioned chart should give a better understanding of the part 1 of the primary interview.

Primary Research

Part 2: In this part of primary research the data collected via secondary research and the part 1 of the primary research is validated with the interviews from individual consultants and subject matter experts.

Consultants are those set of people who have at least 12 years of experience and expertise within the industry whereas Subject Matter Experts are those with at least 15 years of experience behind their back within the same space. The data with the help of two main processes i.e., FGDs (Focused Group Discussions) and IDs (Individual Discussions). This gives us a 3rd party nonbiased primary view of the market scenario making it a more dependable one while collation of the data pointers.

Step 3: Data Bank Validation

Once all the information is collected via primary and secondary sources, we run that information for data validation. At our intelligence centre our research heads track a lot of information related to the market which includes the quarterly reports, the daily stock prices, and other relevant information. Our data bank server gets updated every fortnight and that is how the information which we collected using our primary and secondary information is revalidated in real time.

Data Bank Validation

Step 4: QA/QC Process

After all the data collection and validation our team does a final level of quality check and quality assurance to get rid of any unwanted or undesired mistakes. This might include but not limited to getting rid of the any typos, duplication of numbers or missing of any important information. The people involved in this process include technical content writers, research heads and graphics people. Once this process is completed the title gets uploader on our platform for our clients to read it.

Step 5: Final QC/QA Process:

This is the last process and comes when the client has ordered the study. In this process a final QA/QC is done before the study is emailed to the client. Since we believe in giving our clients a good experience of our research studies, therefore, to make sure that we do not lack at our end in any way humanly possible we do a final round of quality check and then dispatch the study to the client.

Key Segments

By Material

  • Steel

  • Tungsten Carbide

  • Duplex Nickel

  • Titanium  

  • Alloy

  • Others (Brass, Bronze, and Plastic)

By Valve Size

  • Up To 1”

  • 1” to 6”

  • 6” to 25”

  • 25” to 50”

  • 50” and Larger

By Industry

  • Oil & Gas

  • Energy & Power

  • Water & Wastewater

  • Building & Construction

  • Chemicals

  • Pharmaceuticals

  • Agriculture

  • Metal & Mining

  • Paper & Pulp

  • Food & Beverages

  • Others (Semiconductor, Textile, and Glass)

Request for Segment Customization as per your Business Requirement: Segment Customization Request

Regional Coverage: 

North America 

  • US 

  • Canada 

  • Mexico 

Europe 

  • Eastern Europe 

  • Poland 

  • Romania 

  • Hungary 

  • Turkey 

  • Rest of Eastern Europe 

  • Western Europe 

  • Germany 

  • France 

  • UK 

  • Italy 

  • Spain 

  • Netherlands 

  • Switzerland 

  • Austria 

  • Rest of Western Europe 

Asia Pacific 

  • China 

  • India 

  • Japan 

  • South Korea 

  • Vietnam 

  • Singapore 

  • Australia 

  • Rest of Asia Pacific 

Middle East & Africa 

  • Middle East 

  • UAE 

  • Egypt 

  • Saudi Arabia 

  • Qatar 

  • Rest of Middle East 

  • Africa 

  • Nigeria 

  • South Africa 

  • Rest of Africa 

Latin America 

  • Brazil 

  • Argentina 

  • Colombia 

  • Rest of Latin America 

Request for Country Level Research Report: Country Level Customization Request

Available Customization 

With the given market data, SNS Insider offers customization as per the company’s specific needs. The following customization options are available for the report: 

  • Detailed Volume Analysis 

  • Criss-Cross segment analysis (e.g. Product X Application) 

  • Competitive Product Benchmarking 

  • Geographic Analysis 

  • Additional countries in any of the regions 

  • Customized Data Representation 

  • Detailed analysis and profiling of additional market players


  •            5000 (33% Discount)


  •            8950 (40% Discount)


  •            3050 (23% Discount)

Start a Conversation

Hi! Click one of our member below to chat on Phone