Get more information on the Hybrid Devices Market - Request Sample Report
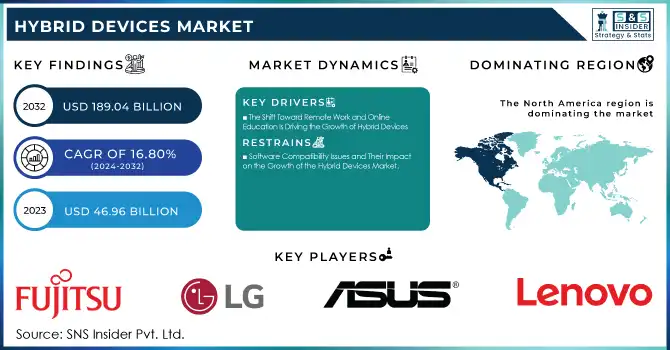
The Hybrid Devices Market Size was valued at USD 46.96 billion in 2023 and is expected to reach USD 189.04 billion by 2032, growing at a CAGR of 16.80% from 2024-2032.
The hybrid devices market has witnessed remarkable growth in recent years, driven by a shift in consumer preferences toward multifunctional and versatile products. As consumers seek devices that blend the capabilities of smartphones, tablets, and laptops, hybrid devices have emerged as a key solution to meet diverse needs. This shift is particularly evident as the demand for seamless integration between personal and professional tasks has intensified, with users increasingly valuing devices that offer both productivity and entertainment features. As a result, hybrid devices have gained significant traction in both consumer and business markets, further fueling their growth.
This surge in demand is largely attributed to the evolving work and lifestyle patterns, particularly with the rise of remote work and mobile computing. Hybrid devices have proven ideal for users who need the flexibility to transition between various tasks, whether for business or personal use. Industries such as education and corporate sectors are embracing these devices, given their ability to support multitasking and offer connectivity across platforms. Moreover, technological advancements such as improved battery life, faster processors, and enhanced 5G capabilities are further elevating the appeal of hybrid devices, ensuring they remain relevant in an increasingly digital and connected world.
Looking ahead, the hybrid devices market is set to continue its upward trajectory, driven by emerging opportunities and ongoing technological innovations. As industries increasingly adopt AI, augmented reality, and cloud computing, hybrid devices are expected to integrate these technologies, offering even greater functionality. A prime example of such innovation is Huawei's Mate XT, unveiled in September 2024. This world's first tri-fold smartphone features a 10.2-inch OLED display when fully unfolded, combining both inward and outward folding designs, demonstrating the potential for new hybrid device forms. As digital transformation accelerates across emerging markets, the demand for flexible and high-performance devices will expand, creating new avenues for growth.
DRIVERS
The Shift Toward Remote Work and Online Education Is Driving the Growth of Hybrid Devices
The growing trend of remote work and online education has drastically changed how people interact with technology. As professionals and students alike require tools that cater to a wide range of activities video conferencing, content creation, document editing, and multimedia consumption there is an increasing demand for versatile devices that seamlessly combine the functionality of a laptop and tablet. Hybrid devices offer the flexibility to switch between work and leisure modes, providing convenience for those juggling multiple tasks throughout the day. With features like touchscreens, detachable keyboards, and long battery life, these devices enable enhanced productivity in various environments, making them essential for both individual and corporate use. This shift in how people work and learn continues to drive the popularity of hybrid devices.
Technological Advancements Are Enhancing Hybrid Devices' Performance, Battery Life, and User Experience
The rapid advancements in key technologies are significantly enhancing the capabilities of hybrid devices. Improvements in processors enable faster performance, allowing users to handle demanding applications and multitask efficiently. Meanwhile, innovations in battery technology have extended the battery life of these devices, ensuring they last longer on a single charge an essential factor for users on the go. Furthermore, advancements in touchscreen technology are providing more responsive and immersive displays, which enhance user interactions whether in tablet or laptop mode. With these technological improvements, hybrid devices are now more powerful, reliable, and user-friendly, making them a compelling choice for a broad range of consumers, from professionals to students. This progress continues to drive the demand for these versatile, all-in-one solutions.
RESTRAINTS
Software Compatibility Issues and Their Impact on the Growth of the Hybrid Devices Market
Hybrid devices combine the functionality of laptops and tablets, but not all applications or operating systems are optimized to work seamlessly across both modes. Many apps are specifically designed for either touchscreen tablets or traditional laptops and when used in hybrid mode, they may experience limitations or performance issues. This can lead to an inconsistent user experience, with certain features not functioning as expected or requiring additional configuration. Additionally, software developers may prioritize optimization for traditional device categories, leaving hybrid device users with fewer choices or reduced functionality. This lack of tailored software support hampers the user experience and can limit the appeal of hybrid devices, ultimately affecting their market growth.
BY TYPE
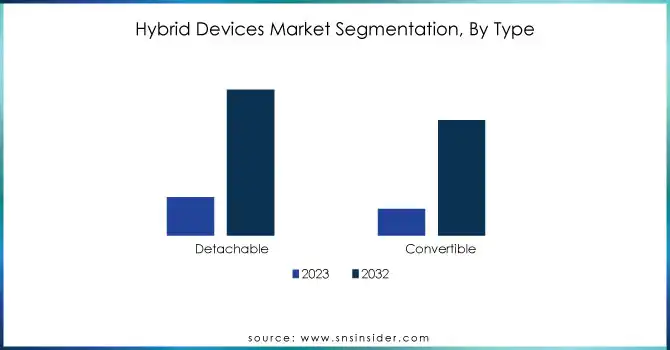
The Detachable segment dominated the hybrid devices market in 2023, accounting for approximately 59% of the revenue share. Its popularity stems from the growing demand for versatile, lightweight devices that combine laptop and tablet functionalities. Detachable offers unmatched flexibility for both work and personal use, appealing to a broad range of consumers. This adaptability has made them a top choice in various industries, driving their market leadership.
The Convertible segment is projected to grow at the fastest CAGR of 17.75% from 2024 to 2032, fueled by rising demand for flexible, all-in-one devices. With the ability to switch between laptop and tablet modes, convertibles cater to users seeking both performance and portability. Businesses, in particular, are gravitating toward these devices for their versatility and space-saving design. This trend is expected to accelerate as technology advances and consumer needs evolve.
BY SCREEN SIZE
The 12-15 Inches segment dominated the hybrid devices market in 2023, accounting for approximately 64% of the revenue share. This size range strikes the ideal balance between portability and screen real estate, appealing to both professionals and consumers. Devices within this range offer a comfortable viewing experience while remaining compact enough for mobility, making them the preferred choice for those seeking a versatile hybrid solution.
The Less Than 12 Inches segment is expected to grow at the fastest CAGR of 19.14% from 2024 to 2032. The increasing demand for ultra-portable devices, particularly among students and frequent travelers, is driving this growth. With a focus on lightweight design and enhanced portability, devices under 12 inches offer a convenient solution for on-the-go users. As mobile workforces expand and consumer preferences shift toward compact, efficient technology, this segment is poised for rapid expansion.
BY END USER
The IT and Telecom segment led the hybrid devices market in 2023, capturing about 38% of the revenue share. This is due to the growing need for high-performance, versatile devices in these industries. Hybrid devices offer IT and telecom professionals the flexibility to switch between office and fieldwork, enhancing productivity. Their ability to meet the demands of mobile and remote work has made them a preferred choice in these sectors.
The Personal Use segment is projected to grow at the fastest CAGR of 18.49% from 2024 to 2032. As remote work and digital connectivity increase, consumers are seeking portable, all-in-one devices. Hybrid devices provide the perfect blend of work, entertainment, and personal use. This growing demand for versatile technology is expected to drive rapid growth in the Personal Use segment.
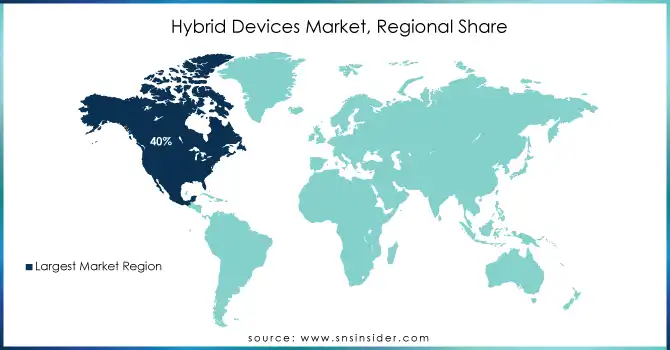
North America dominated the hybrid devices market in 2023, capturing approximately 40% of the revenue share. This dominance is driven by the high demand for advanced, multifunctional devices in sectors like IT, education, and business. North America’s strong infrastructure, high disposable income, and tech-savvy population further fuel the adoption of hybrid devices. The region's focus on innovation and productivity has solidified its leading position in the market.
Looking ahead, Asia Pacific is expected to grow at the fastest CAGR of 18.88% from 2024 to 2032. This growth is driven by rapid digital transformation, a growing middle class, and increasing demand for affordable, versatile devices. The region’s expanding tech ecosystem and rise in remote working further boost the adoption of hybrid devices. As businesses and consumers seek cost-effective, all-in-one solutions, Asia Pacific is poised for significant market expansion.
Get Customized Report as per your Business Requirement - Request For Customized Report
In 2024, Asus will release the Zenbook 17 Fold OLED, a hybrid device with a 17.3-inch foldable OLED screen. Offering multiple configurations, it features an Intel i7-1250U processor, 16GB of RAM, and a 1TB SSD.
In October 2024, Lenovo revealed a new hybrid AI portfolio at the Global Tech World event, featuring solutions like the Lenovo Hybrid AI Advantage for enterprises and products such as the ThinkPad X1 2-in-1 AI laptop.
In 2024, Google and HP announced a partnership to revolutionize hybrid meetings with their XR video solution, Project Starline.
Fujitsu Limited (Lifebook U939X, Stylistic Q7312)
LG Corporation (LG Gram 2-in-1, LG Tab-Book)
ASUSTeK Computer Inc (ASUS ZenBook Flip, ASUS Chromebook Flip)
Lenovo (Lenovo Yoga, Lenovo IdeaPad Flex)
HP Development Company (HP Spectre x360, HP Envy x360)
Microsoft Corporation (Surface Pro, Surface Laptop Studio)
Dell Inc. (Dell XPS 13 2-in-1, Dell Inspiron 14 2-in-1)
Toshiba Corporation (Toshiba Dynabook RZ Series, Toshiba Portege X30W-J)
Samsung Electronics Co. (Samsung Galaxy Book Flex, Samsung Galaxy Tab S8 Book Cover Keyboard)
Acer Inc. (Acer Spin 5, Acer Chromebook Spin 713)
Apple Inc. (iPad Pro with Magic Keyboard, MacBook Pro with Boot Camp)
Huawei Technologies Co., Ltd. (Huawei MateBook E, Huawei MatePad Pro)
Google LLC (Google Pixelbook, Google Pixel Slate)
Razer Inc. (Razer Blade Stealth 13, Razer Book 13)
Panasonic Corporation (Panasonic Toughbook CF-33, Panasonic Let's Note XZ)
Sony Corporation (Sony VAIO Z Flip, Sony Xperia Tablet Z)
Xiaomi Inc. (Xiaomi Mi Notebook Pro, Xiaomi Pad 5 with Keyboard)
Dynabook Inc. (Dynabook Tecra A40, Dynabook Portege X30)
VAIO Corporation (VAIO SX12, VAIO Z Canvas)
Chuwi Innovation Limited (Chuwi UBook Pro, Chuwi CoreBook X)
| Report Attributes | Details |
|---|---|
| Market Size in 2023 | USD 46.96 Billion |
| Market Size by 2032 | USD 189.04 Billion |
| CAGR | CAGR of 16.80% From 2024 to 2032 |
| Base Year | 2023 |
| Forecast Period | 2024-2032 |
| Historical Data | 2020-2022 |
| Report Scope & Coverage | Market Size, Segments Analysis, Competitive Landscape, Regional Analysis, DROC & SWOT Analysis, Forecast Outlook |
| Key Segments | • By Type (Detachable, Convertible) • By Screen Size (Less Than 12 Inches, 12-15 Inches, Greater than 15 Inches) • By End User (IT and Telecom, Personal Use, Educational Institutions, Healthcare, Others) |
| Regional Analysis/Coverage | North America (US, Canada, Mexico), Europe (Eastern Europe [Poland, Romania, Hungary, Turkey, Rest of Eastern Europe] Western Europe [Germany, France, UK, Italy, Spain, Netherlands, Switzerland, Austria, Rest of Western Europe]), Asia Pacific (China, India, Japan, South Korea, Vietnam, Singapore, Australia, Rest of Asia Pacific), Middle East & Africa (Middle East [UAE, Egypt, Saudi Arabia, Qatar, Rest of Middle East], Africa [Nigeria, South Africa, Rest of Africa], Latin America (Brazil, Argentina, Colombia, Rest of Latin America) |
| Company Profiles | Fujitsu Limited, LG Corporation, ASUSTeK Computer Inc., Lenovo, HP Development Company, Microsoft Corporation, Dell Inc., Toshiba Corporation, Samsung Electronics Co., Acer Inc., Apple Inc., Huawei Technologies Co., Ltd., Google LLC, Razer Inc., Panasonic Corporation, Sony Corporation, Xiaomi Inc., Dynabook Inc., VAIO Corporation, Chuwi Innovation Limited. |
| Key Drivers | • The Shift Toward Remote Work and Online Education Is Driving the Growth of Hybrid Devices • Technological Advancements Are Enhancing Hybrid Devices' Performance, Battery Life, and User Experience |
| RESTRAINTS | • Software Compatibility Issues and Their Impact on the Growth of the Hybrid Devices Market |
The Hybrid Devices Market was valued at USD 46.96 Billion in 2023.
The expected CAGR of the global Hybrid Devices Market during the forecast period is 16.80%.
The Asia-Pacific region is anticipated to record the Fastest Growing in the Hybrid Devices Market.
The 12-15 Inches segment is leading in the market revenue share in 2023.
The North America region with the Highest Revenue share in 2023.
1. Introduction
1.1 Market Definition
1.2 Scope (Inclusion and Exclusions)
1.3 Research Assumptions
2. Executive Summary
2.1 Market Overview
2.2 Regional Synopsis
2.3 Competitive Summary
3. Research Methodology
3.1 Top-Down Approach
3.2 Bottom-up Approach
3.3. Data Validation
3.4 Primary Interviews
4. Market Dynamics Impact Analysis
4.1 Market Driving Factors Analysis
4.1.1 Drivers
4.1.2 Restraints
4.1.3 Opportunities
4.1.4 Challenges
4.2 PESTLE Analysis
4.3 Porter’s Five Forces Model
5. Statistical Insights and Trends Reporting
5.1 Consumer Preferences and Adoption Rates
5.2 Technology Integration
5.3 User Demographics
5.4 Sales Channel Distribution
6. Competitive Landscape
6.1 List of Major Companies, By Region
6.2 Market Share Analysis, By Region
6.3 Product Benchmarking
6.3.1 Product specifications and features
6.3.2 Pricing
6.4 Strategic Initiatives
6.4.1 Marketing and promotional activities
6.4.2 Distribution and supply chain strategies
6.4.3 Expansion plans and new product launches
6.4.4 Strategic partnerships and collaborations
6.5 Technological Advancements
6.6 Market Positioning and Branding
7. Hybrid Devices Market Segmentation, by Type
7.1 Chapter Overview
7.2 Detachable
7.2.1 Detachable Market Trends Analysis (2020-2032)
7.2.2 Detachable Market Size Estimates and Forecasts to 2032 (USD Billion)
7.3 Convertible
7.3.1 Convertible Market Trends Analysis (2020-2032)
7.3.2 Convertible Market Size Estimates and Forecasts to 2032 (USD Billion)
8. Hybrid Devices Market Segmentation, by Screen Size
8.1 Chapter Overview
8.2 Less Than 12 Inches
8.2.1 Less Than 12 Inches Market Trends Analysis (2020-2032)
8.2.2 Less Than 12 Inches Market Size Estimates and Forecasts to 2032 (USD Billion)
8.3 12-15 Inches
8.3.1 12-15 Inches Market Trends Analysis (2020-2032)
8.3.2 12-15 Inches Market Size Estimates and Forecasts to 2032 (USD Billion)
8.4 Greater than 15 Inches
8.4.1 Greater than 15 Inches Market Trends Analysis (2020-2032)
8.4.2 Greater than 15 Inches Market Size Estimates and Forecasts to 2032 (USD Billion)
9. Hybrid Devices Market Segmentation, by End User
9.1 Chapter Overview
9.2 IT and Telecom
9.2.1 IT and Telecom Market Trends Analysis (2020-2032)
9.2.2 IT and Telecom Market Size Estimates and Forecasts to 2032 (USD Billion)
9.3 Personal Use
9.3.1 Personal Use Market Trends Analysis (2020-2032)
9.3.2 Personal Use Market Size Estimates and Forecasts to 2032 (USD Billion)
9.4 Educational Institutions
9.4.1 Educational Institutions Market Trends Analysis (2020-2032)
9.4.2 Educational Institutions Market Size Estimates and Forecasts to 2032 (USD Billion)
9.5 Healthcare
9.5.1 Healthcare Market Trends Analysis (2020-2032)
9.5.2 Healthcare Market Size Estimates and Forecasts to 2032 (USD Billion)
9.6 Others
9.6.1 Others Market Trends Analysis (2020-2032)
9.6.2 Others Market Size Estimates and Forecasts to 2032 (USD Billion)
10. Regional Analysis
10.1 Chapter Overview
10.2 North America
10.2.1 Trends Analysis
10.2.2 North America Hybrid Devices Market Estimates and Forecasts, by Country (2020-2032) (USD Billion)
10.2.3 North America Hybrid Devices Market Estimates and Forecasts, by Type (2020-2032) (USD Billion)
10.2.4 North America Hybrid Devices Market Estimates and Forecasts, by Screen Size (2020-2032) (USD Billion)
10.2.5 North America Hybrid Devices Market Estimates and Forecasts, by End User (2020-2032) (USD Billion)
10.2.6 USA
10.2.6.1 USA Hybrid Devices Market Estimates and Forecasts, by Type (2020-2032) (USD Billion)
10.2.6.2 USA Hybrid Devices Market Estimates and Forecasts, by Screen Size (2020-2032) (USD Billion)
10.2.6.3 USA Hybrid Devices Market Estimates and Forecasts, by End User (2020-2032) (USD Billion)
10.2.7 Canada
10.2.7.1 Canada Hybrid Devices Market Estimates and Forecasts, by Type (2020-2032) (USD Billion)
10.2.7.2 Canada Hybrid Devices Market Estimates and Forecasts, by Screen Size (2020-2032) (USD Billion)
10.2.7.3 Canada Hybrid Devices Market Estimates and Forecasts, by End User (2020-2032) (USD Billion)
10.2.8 Mexico
10.2.8.1 Mexico Hybrid Devices Market Estimates and Forecasts, by Type (2020-2032) (USD Billion)
10.2.8.2 Mexico Hybrid Devices Market Estimates and Forecasts, by Screen Size (2020-2032) (USD Billion)
10.2.8.3 Mexico Hybrid Devices Market Estimates and Forecasts, by End User (2020-2032) (USD Billion)
10.3 Europe
10.3.1 Eastern Europe
10.3.1.1 Trends Analysis
10.3.1.2 Eastern Europe Hybrid Devices Market Estimates and Forecasts, by Country (2020-2032) (USD Billion)
10.3.1.3 Eastern Europe Hybrid Devices Market Estimates and Forecasts, by Type (2020-2032) (USD Billion)
10.3.1.4 Eastern Europe Hybrid Devices Market Estimates and Forecasts, by Screen Size (2020-2032) (USD Billion)
10.3.1.5 Eastern Europe Hybrid Devices Market Estimates and Forecasts, by End User (2020-2032) (USD Billion)
10.3.1.6 Poland
10.3.1.6.1 Poland Hybrid Devices Market Estimates and Forecasts, by Type (2020-2032) (USD Billion)
10.3.1.6.2 Poland Hybrid Devices Market Estimates and Forecasts, by Screen Size (2020-2032) (USD Billion)
10.3.1.6.3 Poland Hybrid Devices Market Estimates and Forecasts, by End User (2020-2032) (USD Billion)
10.3.1.7 Romania
10.3.1.7.1 Romania Hybrid Devices Market Estimates and Forecasts, by Type (2020-2032) (USD Billion)
10.3.1.7.2 Romania Hybrid Devices Market Estimates and Forecasts, by Screen Size (2020-2032) (USD Billion)
10.3.1.7.3 Romania Hybrid Devices Market Estimates and Forecasts, by End User (2020-2032) (USD Billion)
10.3.1.8 Hungary
10.3.1.8.1 Hungary Hybrid Devices Market Estimates and Forecasts, by Type (2020-2032) (USD Billion)
10.3.1.8.2 Hungary Hybrid Devices Market Estimates and Forecasts, by Screen Size (2020-2032) (USD Billion)
10.3.1.8.3 Hungary Hybrid Devices Market Estimates and Forecasts, by End User (2020-2032) (USD Billion)
10.3.1.9 Turkey
10.3.1.9.1 Turkey Hybrid Devices Market Estimates and Forecasts, by Type (2020-2032) (USD Billion)
10.3.1.9.2 Turkey Hybrid Devices Market Estimates and Forecasts, by Screen Size (2020-2032) (USD Billion)
10.3.1.9.3 Turkey Hybrid Devices Market Estimates and Forecasts, by End User (2020-2032) (USD Billion)
10.3.1.10 Rest of Eastern Europe
10.3.1.10.1 Rest of Eastern Europe Hybrid Devices Market Estimates and Forecasts, by Type (2020-2032) (USD Billion)
10.3.1.10.2 Rest of Eastern Europe Hybrid Devices Market Estimates and Forecasts, by Screen Size (2020-2032) (USD Billion)
10.3.1.10.3 Rest of Eastern Europe Hybrid Devices Market Estimates and Forecasts, by End User (2020-2032) (USD Billion)
10.3.2 Western Europe
10.3.2.1 Trends Analysis
10.3.2.2 Western Europe Hybrid Devices Market Estimates and Forecasts, by Country (2020-2032) (USD Billion)
10.3.2.3 Western Europe Hybrid Devices Market Estimates and Forecasts, by Type (2020-2032) (USD Billion)
10.3.2.4 Western Europe Hybrid Devices Market Estimates and Forecasts, by Screen Size (2020-2032) (USD Billion)
10.3.2.5 Western Europe Hybrid Devices Market Estimates and Forecasts, by End User (2020-2032) (USD Billion)
10.3.2.6 Germany
10.3.2.6.1 Germany Hybrid Devices Market Estimates and Forecasts, by Type (2020-2032) (USD Billion)
10.3.2.6.2 Germany Hybrid Devices Market Estimates and Forecasts, by Screen Size (2020-2032) (USD Billion)
10.3.2.6.3 Germany Hybrid Devices Market Estimates and Forecasts, by End User (2020-2032) (USD Billion)
10.3.2.7 France
10.3.2.7.1 France Hybrid Devices Market Estimates and Forecasts, by Type (2020-2032) (USD Billion)
10.3.2.7.2 France Hybrid Devices Market Estimates and Forecasts, by Screen Size (2020-2032) (USD Billion)
10.3.2.7.3 France Hybrid Devices Market Estimates and Forecasts, by End User (2020-2032) (USD Billion)
10.3.2.8 UK
10.3.2.8.1 UK Hybrid Devices Market Estimates and Forecasts, by Type (2020-2032) (USD Billion)
10.3.2.8.2 UK Hybrid Devices Market Estimates and Forecasts, by Screen Size (2020-2032) (USD Billion)
10.3.2.8.3 UK Hybrid Devices Market Estimates and Forecasts, by End User (2020-2032) (USD Billion)
10.3.2.9 Italy
10.3.2.9.1 Italy Hybrid Devices Market Estimates and Forecasts, by Type (2020-2032) (USD Billion)
10.3.2.9.2 Italy Hybrid Devices Market Estimates and Forecasts, by Screen Size (2020-2032) (USD Billion)
10.3.2.9.3 Italy Hybrid Devices Market Estimates and Forecasts, by End User (2020-2032) (USD Billion)
10.3.2.10 Spain
10.3.2.10.1 Spain Hybrid Devices Market Estimates and Forecasts, by Type (2020-2032) (USD Billion)
10.3.2.10.2 Spain Hybrid Devices Market Estimates and Forecasts, by Screen Size (2020-2032) (USD Billion)
10.3.2.10.3 Spain Hybrid Devices Market Estimates and Forecasts, by End User (2020-2032) (USD Billion)
10.3.2.11 Netherlands
10.3.2.11.1 Netherlands Hybrid Devices Market Estimates and Forecasts, by Type (2020-2032) (USD Billion)
10.3.2.11.2 Netherlands Hybrid Devices Market Estimates and Forecasts, by Screen Size (2020-2032) (USD Billion)
10.3.2.11.3 Netherlands Hybrid Devices Market Estimates and Forecasts, by End User (2020-2032) (USD Billion)
10.3.2.12 Switzerland
10.3.2.12.1 Switzerland Hybrid Devices Market Estimates and Forecasts, by Type (2020-2032) (USD Billion)
10.3.2.12.2 Switzerland Hybrid Devices Market Estimates and Forecasts, by Screen Size (2020-2032) (USD Billion)
10.3.2.12.3 Switzerland Hybrid Devices Market Estimates and Forecasts, by End User (2020-2032) (USD Billion)
10.3.2.13 Austria
10.3.2.13.1 Austria Hybrid Devices Market Estimates and Forecasts, by Type (2020-2032) (USD Billion)
10.3.2.13.2 Austria Hybrid Devices Market Estimates and Forecasts, by Screen Size (2020-2032) (USD Billion)
10.3.2.13.3 Austria Hybrid Devices Market Estimates and Forecasts, by End User (2020-2032) (USD Billion)
10.3.2.14 Rest of Western Europe
10.3.2.14.1 Rest of Western Europe Hybrid Devices Market Estimates and Forecasts, by Type (2020-2032) (USD Billion)
10.3.2.14.2 Rest of Western Europe Hybrid Devices Market Estimates and Forecasts, by Screen Size (2020-2032) (USD Billion)
10.3.2.14.3 Rest of Western Europe Hybrid Devices Market Estimates and Forecasts, by End User (2020-2032) (USD Billion)
10.4 Asia Pacific
10.4.1 Trends Analysis
10.4.2 Asia Pacific Hybrid Devices Market Estimates and Forecasts, by Country (2020-2032) (USD Billion)
10.4.3 Asia Pacific Hybrid Devices Market Estimates and Forecasts, by Type (2020-2032) (USD Billion)
10.4.4 Asia Pacific Hybrid Devices Market Estimates and Forecasts, by Screen Size (2020-2032) (USD Billion)
10.4.5 Asia Pacific Hybrid Devices Market Estimates and Forecasts, by End User (2020-2032) (USD Billion)
10.4.6 China
10.4.6.1 China Hybrid Devices Market Estimates and Forecasts, by Type (2020-2032) (USD Billion)
10.4.6.2 China Hybrid Devices Market Estimates and Forecasts, by Screen Size (2020-2032) (USD Billion)
10.4.6.3 China Hybrid Devices Market Estimates and Forecasts, by End User (2020-2032) (USD Billion)
10.4.7 India
10.4.7.1 India Hybrid Devices Market Estimates and Forecasts, by Type (2020-2032) (USD Billion)
10.4.7.2 India Hybrid Devices Market Estimates and Forecasts, by Screen Size (2020-2032) (USD Billion)
10.4.7.3 India Hybrid Devices Market Estimates and Forecasts, by End User (2020-2032) (USD Billion)
10.4.8 Japan
10.4.8.1 Japan Hybrid Devices Market Estimates and Forecasts, by Type (2020-2032) (USD Billion)
10.4.8.2 Japan Hybrid Devices Market Estimates and Forecasts, by Screen Size (2020-2032) (USD Billion)
10.4.8.3 Japan Hybrid Devices Market Estimates and Forecasts, by End User (2020-2032) (USD Billion)
10.4.9 South Korea
10.4.9.1 South Korea Hybrid Devices Market Estimates and Forecasts, by Type (2020-2032) (USD Billion)
10.4.9.2 South Korea Hybrid Devices Market Estimates and Forecasts, by Screen Size (2020-2032) (USD Billion)
10.4.9.3 South Korea Hybrid Devices Market Estimates and Forecasts, by End User (2020-2032) (USD Billion)
10.4.10 Vietnam
10.4.10.1 Vietnam Hybrid Devices Market Estimates and Forecasts, by Type (2020-2032) (USD Billion)
10.4.10.2 Vietnam Hybrid Devices Market Estimates and Forecasts, by Screen Size (2020-2032) (USD Billion)
10.4.10.3 Vietnam Hybrid Devices Market Estimates and Forecasts, by End User (2020-2032) (USD Billion)
10.4.11 Singapore
10.4.11.1 Singapore Hybrid Devices Market Estimates and Forecasts, by Type (2020-2032) (USD Billion)
10.4.11.2 Singapore Hybrid Devices Market Estimates and Forecasts, by Screen Size (2020-2032) (USD Billion)
10.4.11.3 Singapore Hybrid Devices Market Estimates and Forecasts, by End User (2020-2032) (USD Billion)
10.4.12 Australia
10.4.12.1 Australia Hybrid Devices Market Estimates and Forecasts, by Type (2020-2032) (USD Billion)
10.4.12.2 Australia Hybrid Devices Market Estimates and Forecasts, by Screen Size (2020-2032) (USD Billion)
10.4.12.3 Australia Hybrid Devices Market Estimates and Forecasts, by End User (2020-2032) (USD Billion)
10.4.13 Rest of Asia Pacific
10.4.13.1 Rest of Asia Pacific Hybrid Devices Market Estimates and Forecasts, by Type (2020-2032) (USD Billion)
10.4.13.2 Rest of Asia Pacific Hybrid Devices Market Estimates and Forecasts, by Screen Size (2020-2032) (USD Billion)
10.4.13.3 Rest of Asia Pacific Hybrid Devices Market Estimates and Forecasts, by End User (2020-2032) (USD Billion)
10.5 Middle East and Africa
10.5.1 Middle East
10.5.1.1 Trends Analysis
10.5.1.2 Middle East Hybrid Devices Market Estimates and Forecasts, by Country (2020-2032) (USD Billion)
10.5.1.3 Middle East Hybrid Devices Market Estimates and Forecasts, by Type (2020-2032) (USD Billion)
10.5.1.4 Middle East Hybrid Devices Market Estimates and Forecasts, by Screen Size (2020-2032) (USD Billion)
10.5.1.5 Middle East Hybrid Devices Market Estimates and Forecasts, by End User (2020-2032) (USD Billion)
10.5.1.6 UAE
10.5.1.6.1 UAE Hybrid Devices Market Estimates and Forecasts, by Type (2020-2032) (USD Billion)
10.5.1.6.2 UAE Hybrid Devices Market Estimates and Forecasts, by Screen Size (2020-2032) (USD Billion)
10.5.1.6.3 UAE Hybrid Devices Market Estimates and Forecasts, by End User (2020-2032) (USD Billion)
10.5.1.7 Egypt
10.5.1.7.1 Egypt Hybrid Devices Market Estimates and Forecasts, by Type (2020-2032) (USD Billion)
10.5.1.7.2 Egypt Hybrid Devices Market Estimates and Forecasts, by Screen Size (2020-2032) (USD Billion)
10.5.1.7.3 Egypt Hybrid Devices Market Estimates and Forecasts, by End User (2020-2032) (USD Billion)
10.5.1.8 Saudi Arabia
10.5.1.8.1 Saudi Arabia Hybrid Devices Market Estimates and Forecasts, by Type (2020-2032) (USD Billion)
10.5.1.8.2 Saudi Arabia Hybrid Devices Market Estimates and Forecasts, by Screen Size (2020-2032) (USD Billion)
10.5.1.8.3 Saudi Arabia Hybrid Devices Market Estimates and Forecasts, by End User (2020-2032) (USD Billion)
10.5.1.9 Qatar
10.5.1.9.1 Qatar Hybrid Devices Market Estimates and Forecasts, by Type (2020-2032) (USD Billion)
10.5.1.9.2 Qatar Hybrid Devices Market Estimates and Forecasts, by Screen Size (2020-2032) (USD Billion)
10.5.1.9.3 Qatar Hybrid Devices Market Estimates and Forecasts, by End User (2020-2032) (USD Billion)
10.5.1.10 Rest of Middle East
10.5.1.10.1 Rest of Middle East Hybrid Devices Market Estimates and Forecasts, by Type (2020-2032) (USD Billion)
10.5.1.10.2 Rest of Middle East Hybrid Devices Market Estimates and Forecasts, by Screen Size (2020-2032) (USD Billion)
10.5.1.10.3 Rest of Middle East Hybrid Devices Market Estimates and Forecasts, by End User (2020-2032) (USD Billion)
10.5.2 Africa
10.5.2.1 Trends Analysis
10.5.2.2 Africa Hybrid Devices Market Estimates and Forecasts, by Country (2020-2032) (USD Billion)
10.5.2.3 Africa Hybrid Devices Market Estimates and Forecasts, by Type (2020-2032) (USD Billion)
10.5.2.4 Africa Hybrid Devices Market Estimates and Forecasts, by Screen Size (2020-2032) (USD Billion)
10.5.2.5 Africa Hybrid Devices Market Estimates and Forecasts, by End User (2020-2032) (USD Billion)
10.5.2.6 South Africa
10.5.2.6.1 South Africa Hybrid Devices Market Estimates and Forecasts, by Type (2020-2032) (USD Billion)
10.5.2.6.2 South Africa Hybrid Devices Market Estimates and Forecasts, by Screen Size (2020-2032) (USD Billion)
10.5.2.6.3 South Africa Hybrid Devices Market Estimates and Forecasts, by End User (2020-2032) (USD Billion)
10.5.2.7 Nigeria
10.5.2.7.1 Nigeria Hybrid Devices Market Estimates and Forecasts, by Type (2020-2032) (USD Billion)
10.5.2.7.2 Nigeria Hybrid Devices Market Estimates and Forecasts, by Screen Size (2020-2032) (USD Billion)
10.5.2.7.3 Nigeria Hybrid Devices Market Estimates and Forecasts, by End User (2020-2032) (USD Billion)
10.5.2.8 Rest of Africa
10.5.2.8.1 Rest of Africa Hybrid Devices Market Estimates and Forecasts, by Type (2020-2032) (USD Billion)
10.5.2.8.2 Rest of Africa Hybrid Devices Market Estimates and Forecasts, by Screen Size (2020-2032) (USD Billion)
10.5.2.8.3 Rest of Africa Hybrid Devices Market Estimates and Forecasts, by End User (2020-2032) (USD Billion)
10.6 Latin America
10.6.1 Trends Analysis
10.6.2 Latin America Hybrid Devices Market Estimates and Forecasts, by Country (2020-2032) (USD Billion)
10.6.3 Latin America Hybrid Devices Market Estimates and Forecasts, by Type (2020-2032) (USD Billion)
10.6.4 Latin America Hybrid Devices Market Estimates and Forecasts, by Screen Size (2020-2032) (USD Billion)
10.6.5 Latin America Hybrid Devices Market Estimates and Forecasts, by End User (2020-2032) (USD Billion)
10.6.6 Brazil
10.6.6.1 Brazil Hybrid Devices Market Estimates and Forecasts, by Type (2020-2032) (USD Billion)
10.6.6.2 Brazil Hybrid Devices Market Estimates and Forecasts, by Screen Size (2020-2032) (USD Billion)
10.6.6.3 Brazil Hybrid Devices Market Estimates and Forecasts, by End User (2020-2032) (USD Billion)
10.6.7 Argentina
10.6.7.1 Argentina Hybrid Devices Market Estimates and Forecasts, by Type (2020-2032) (USD Billion)
10.6.7.2 Argentina Hybrid Devices Market Estimates and Forecasts, by Screen Size (2020-2032) (USD Billion)
10.6.7.3 Argentina Hybrid Devices Market Estimates and Forecasts, by End User (2020-2032) (USD Billion)
10.6.8 Colombia
10.6.8.1 Colombia Hybrid Devices Market Estimates and Forecasts, by Type (2020-2032) (USD Billion)
10.6.8.2 Colombia Hybrid Devices Market Estimates and Forecasts, by Screen Size (2020-2032) (USD Billion)
10.6.8.3 Colombia Hybrid Devices Market Estimates and Forecasts, by End User (2020-2032) (USD Billion)
10.6.9 Rest of Latin America
10.6.9.1 Rest of Latin America Hybrid Devices Market Estimates and Forecasts, by Type (2020-2032) (USD Billion)
10.6.9.2 Rest of Latin America Hybrid Devices Market Estimates and Forecasts, by Screen Size (2020-2032) (USD Billion)
10.6.9.3 Rest of Latin America Hybrid Devices Market Estimates and Forecasts, by End User (2020-2032) (USD Billion)
11. Company Profiles
11.1 Fujitsu Limited
11.1.1 Company Overview
11.1.2 Financial
11.1.3 Products/ Services Offered
11.1.4 SWOT Analysis
11.2 LG Corporation
11.2.1 Company Overview
11.2.2 Financial
11.2.3 Products/ Services Offered
11.2.4 SWOT Analysis
11.3 ASUSTeK Computer Inc.
11.3.1 Company Overview
11.3.2 Financial
11.3.3 Products/ Services Offered
11.3.4 SWOT Analysis
11.4 Lenovo
11.4.1 Company Overview
11.4.2 Financial
11.4.3 Products/ Services Offered
11.4.4 SWOT Analysis
11.5 HP Development Company
11.5.1 Company Overview
11.5.2 Financial
11.5.3 Products/ Services Offered
11.5.4 SWOT Analysis
11.6 Microsoft Corporation
11.6.1 Company Overview
11.6.2 Financial
11.6.3 Products/ Services Offered
11.6.4 SWOT Analysis
11.7 Dell Inc.
11.7.1 Company Overview
11.7.2 Financial
11.7.3 Products/ Services Offered
11.7.4 SWOT Analysis
11.8 Toshiba Corporation
11.8.1 Company Overview
11.8.2 Financial
11.8.3 Products/ Services Offered
11.8.4 SWOT Analysis
11.9 Samsung Electronics Co.
11.9.1 Company Overview
11.9.2 Financial
11.9.3 Products/ Services Offered
11.9.4 SWOT Analysis
11.10 Acer Inc.
11.10.1 Company Overview
11.10.2 Financial
11.10.3 Products/ Services Offered
11.10.4 SWOT Analysis
12. Use Cases and Best Practices
13. Conclusion
An accurate research report requires proper strategizing as well as implementation. There are multiple factors involved in the completion of good and accurate research report and selecting the best methodology to compete the research is the toughest part. Since the research reports we provide play a crucial role in any company’s decision-making process, therefore we at SNS Insider always believe that we should choose the best method which gives us results closer to reality. This allows us to reach at a stage wherein we can provide our clients best and accurate investment to output ratio.
Each report that we prepare takes a timeframe of 350-400 business hours for production. Starting from the selection of titles through a couple of in-depth brain storming session to the final QC process before uploading our titles on our website we dedicate around 350 working hours. The titles are selected based on their current market cap and the foreseen CAGR and growth.
The 5 steps process:
Step 1: Secondary Research:
Secondary Research or Desk Research is as the name suggests is a research process wherein, we collect data through the readily available information. In this process we use various paid and unpaid databases which our team has access to and gather data through the same. This includes examining of listed companies’ annual reports, Journals, SEC filling etc. Apart from this our team has access to various associations across the globe across different industries. Lastly, we have exchange relationships with various university as well as individual libraries.

Step 2: Primary Research
When we talk about primary research, it is a type of study in which the researchers collect relevant data samples directly, rather than relying on previously collected data. This type of research is focused on gaining content specific facts that can be sued to solve specific problems. Since the collected data is fresh and first hand therefore it makes the study more accurate and genuine.
We at SNS Insider have divided Primary Research into 2 parts.
Part 1 wherein we interview the KOLs of major players as well as the upcoming ones across various geographic regions. This allows us to have their view over the market scenario and acts as an important tool to come closer to the accurate market numbers. As many as 45 paid and unpaid primary interviews are taken from both the demand and supply side of the industry to make sure we land at an accurate judgement and analysis of the market.
This step involves the triangulation of data wherein our team analyses the interview transcripts, online survey responses and observation of on filed participants. The below mentioned chart should give a better understanding of the part 1 of the primary interview.

Part 2: In this part of primary research the data collected via secondary research and the part 1 of the primary research is validated with the interviews from individual consultants and subject matter experts.
Consultants are those set of people who have at least 12 years of experience and expertise within the industry whereas Subject Matter Experts are those with at least 15 years of experience behind their back within the same space. The data with the help of two main processes i.e., FGDs (Focused Group Discussions) and IDs (Individual Discussions). This gives us a 3rd party nonbiased primary view of the market scenario making it a more dependable one while collation of the data pointers.
Step 3: Data Bank Validation
Once all the information is collected via primary and secondary sources, we run that information for data validation. At our intelligence centre our research heads track a lot of information related to the market which includes the quarterly reports, the daily stock prices, and other relevant information. Our data bank server gets updated every fortnight and that is how the information which we collected using our primary and secondary information is revalidated in real time.

Step 4: QA/QC Process
After all the data collection and validation our team does a final level of quality check and quality assurance to get rid of any unwanted or undesired mistakes. This might include but not limited to getting rid of the any typos, duplication of numbers or missing of any important information. The people involved in this process include technical content writers, research heads and graphics people. Once this process is completed the title gets uploader on our platform for our clients to read it.
Step 5: Final QC/QA Process:
This is the last process and comes when the client has ordered the study. In this process a final QA/QC is done before the study is emailed to the client. Since we believe in giving our clients a good experience of our research studies, therefore, to make sure that we do not lack at our end in any way humanly possible we do a final round of quality check and then dispatch the study to the client.
Key Segments:
By Type
Detachable
Convertible
By Screen Size
Less Than 12 Inches
12-15 Inches
Greater than 15 Inches
By End User
IT and Telecom
Personal Use
Educational Institutions
Healthcare
Others
Request for Segment Customization as per your Business Requirement: Segment Customization Request
Regional Coverage:
North America
US
Canada
Mexico
Europe
Eastern Europe
Poland
Romania
Hungary
Turkey
Rest of Eastern Europe
Western Europe
Germany
France
UK
Italy
Spain
Netherlands
Switzerland
Austria
Rest of Western Europe
Asia Pacific
China
India
Japan
South Korea
Vietnam
Singapore
Australia
Rest of Asia Pacific
Middle East & Africa
Middle East
UAE
Egypt
Saudi Arabia
Qatar
Rest of the Middle East
Africa
Nigeria
South Africa
Rest of Africa
Latin America
Brazil
Argentina
Colombia
Rest of Latin America
Request for Country Level Research Report: Country Level Customization Request
Available Customization
With the given market data, SNS Insider offers customization as per the company’s specific needs. The following customization options are available for the report:
Product Analysis
Criss-Cross segment analysis (e.g. Product X Application)
Product Matrix which gives a detailed comparison of the product portfolio of each company
Geographic Analysis
Additional countries in any of the regions
Company Information
Detailed analysis and profiling of additional market players (Up to five)
The Water-based Heating & Cooling Systems Market Size was valued at USD 37.10 Billion in 2023 and is expected to reach USD 73.53 Billion by 2032 and grow at a CAGR of 7.94% over the forecast period 2024-2032
The Semiconductor Memory Market Size was valued at USD 122.35 Billion in 2023 and is expected to reach USD 273.03 Billion by 2032 and grow at a CAGR of 9.4% over the forecast period 2024-2032.
The 2D Barcode Reader Market Size was valued at USD 7.87 Billion in 2023 and is expected to grow at a CAGR of 9.0% to reach USD 17.10 Billion by 2032.
The Programmable Logic Controller (PLC) Market Size was valued at USD 12.95 billion in 2023. It is expected to grow at a CAGR of 6.40% During 2024-2032
The Force Sensor Market Size was valued at USD 2.77 Billion in 2023 and is expected to grow at a CAGR of 5.59% to reach USD 4.50 Billion by 2032.
The Leak Detection Market Size was valued at USD 4.58 billion in 2023 and is expected to grow at a CAGR of 5.31% to reach USD 7.26 billion by 2032.

Hi! Click one of our member below to chat on Phone
© 2025 All Rights Reserved by SNS Insider Pvt Ltd


