image

Humidity Sensors Market Report Scope & Overview:

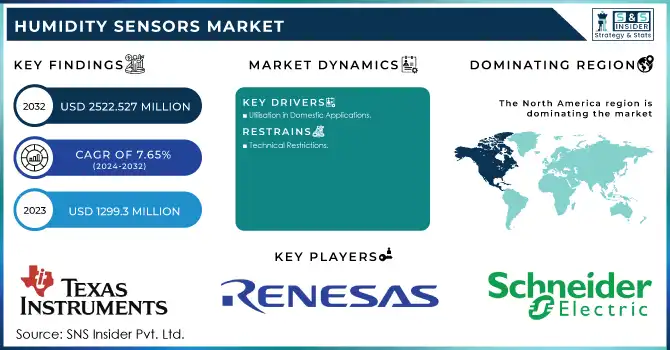
The Humidity Sensors Market size was valued at USD 2.59 Billion in 2023 and is expected to grow to USD 4.86 Billion by 2032 and grow at a CAGR Of 7.25 % over the forecast period of 2024-2032.

Humidity Sensors Market Revenue Analysis

Get more information on Humidity Sensors  Market - Request Sample Report

The Humidity Sensor Market has seen significant growth, driven by the increasing need for precise humidity measurement in various industries. In the first two quarters of 2023, industrial humidity measurements reached 1,751 thousand metric tonnes, necessitating sophisticated monitoring solutions throughout the manufacturing process. Technological advancements have contributed to this growth, such as E+E Elektronik's HTS801 humidity sensor, launched in September 2023 for high humidity and chemical exposure applications, and Sensirion's SHT40I-Analog sensor, introduced in March 2023 for industrial environments with high noise levels. These innovations reflect the industry's response to the rising demand for reliable humidity control. The food and beverage sector has become a significant adopter, with companies like Wiliot introducing wireless humidity sensors for real-time monitoring throughout the supply chain, ensuring product safety and quality. the pharmaceutical industry has increased its use of relative humidity sensors to maintain the 40-60% humidity range mandated by the World Health Organization for optimal drug storage conditions. Similarly, the chemical industry's growth, particularly in China’s chemical API production, has further boosted demand for humidity sensors. These factors highlight the market’s expansion, with safety, quality control, and environmental conditions driving the adoption of advanced humidity sensor technologies across various sectors.

Market Dynamics

Drivers

  • Focus on Energy-Efficient and Sustainable Solutions Driving Humidity Sensor Adoption

The increasing global emphasis on sustainability and energy efficiency is driving the widespread adoption of humidity sensors across various industries. As environmental concerns and regulatory pressures mount, businesses are increasingly seeking solutions that not only optimize performance but also contribute to reducing energy consumption and minimizing environmental footprints. Humidity sensors play a crucial role in achieving these objectives by enabling more efficient use of energy in heating, ventilation, and air conditioning (HVAC) systems, industrial processes, and manufacturing operations. By accurately monitoring and regulating humidity levels, these sensors help maintain optimal conditions while reducing unnecessary energy consumption, ultimately leading to lower carbon emissions and energy costs. In the HVAC industry, for example, humidity sensors are integrated into smart systems to optimize airflow and temperature control, ensuring that energy is not wasted when humidity levels are within the desired range. Similarly, in the manufacturing sector, humidity sensors contribute to optimizing the performance of production processes, preventing equipment failures caused by extreme moisture levels and minimizing energy consumption. The growing push for sustainability, combined with advancements in sensor technology, has led to the development of more energy-efficient and eco-friendly humidity sensors. These sensors are designed with lower power consumption, reduced material use, and longer lifespans, aligning with global efforts to conserve resources and reduce environmental impact.

Restraints

  • The integration complexity of humidity sensors into existing systems, especially those relying on legacy equipment, poses a significant challenge for industries.

 Many businesses are constrained by outdated infrastructure, which may not be compatible with the latest sensor technologies. This incompatibility often leads to difficulties in installation, requiring additional time and resources for system modifications. As a result, the integration process can be costly, which may deter some organizations, particularly small and medium-sized enterprises, from adopting advanced humidity sensing solutions. Moreover, industries such as pharmaceuticals, healthcare, and manufacturing, which must adhere to strict environmental control standards, may face increased operational downtime during system upgrades or recalibration. The need for specialized expertise to ensure proper integration further drives up costs and extends installation timelines. Furthermore, as businesses look to integrate humidity sensors, they must also contend with challenges related to data management, system interoperability, and the calibration of sensors to maintain accuracy over time. The rising demand for precise humidity control in areas like clean rooms, storage facilities, and healthcare settings only exacerbates the need for an efficient and cost-effective integration process. Additionally, as regulatory compliance grows more stringent, companies may find themselves spending more resources on overcoming these integration challenges to meet the required standards. The combination of high integration costs, complex installation procedures, and long-term maintenance needs represents a significant restraint for the widespread adoption of humidity sensors, despite their increasing importance across various industries.

Segment Analysis

By Type

The Absolute Humidity Sensor segment dominates the Humidity Sensors Market, accounting for approximately 71% of the market share in 2023. This segment is favored due to its accuracy and reliability in measuring the total water vapor present in the air, regardless of temperature. Absolute humidity sensors are widely used in various industries, including pharmaceuticals, automotive, and food processing, where precise and consistent humidity control is critical. These sensors provide real-time monitoring and contribute to maintaining optimal environmental conditions for manufacturing processes, storage, and transportation. Their ability to measure humidity without the need for temperature compensation makes them more efficient in settings where temperature fluctuations are common. As industries continue to prioritize environmental control, the demand for absolute humidity sensors is expected to remain high, further solidifying their dominance in the market.

The Relative Humidity (RH) Sensor segment is expected to be the fastest-growing in the Humidity Sensor Market over the forecast period from 2024 to 2032. RH sensors measure the amount of moisture in the air relative to the maximum amount of moisture the air can hold at a given temperature, making them crucial for a wide range of applications, including HVAC systems, agriculture, and electronics. Their ability to monitor and control indoor air quality, maintain optimal conditions in storage and manufacturing environments, and enhance comfort levels in buildings contributes to their increasing demand. As industries focus on energy efficiency, sustainable practices, and improved air quality, the adoption of RH sensors is set to accelerate, driving substantial growth in this segment.

By End Use

The automotive segment is dominating the Humidity Sensor Market by end-use, accounting for approximately 39% of the market share in 2023. Humidity sensors in vehicles are essential for optimizing air conditioning, defogging systems, and ensuring passenger comfort by monitoring moisture levels within the cabin. They are also critical in enhancing the efficiency of HVAC systems, activating ventilation processes only when necessary to save energy. Additionally, the growth in electric vehicles (EVs) and the increasing focus on vehicle safety systems and advanced driver assistance systems (ADAS) further amplify the demand for humidity sensors. These sensors help in monitoring environmental conditions that affect battery performance, preventing condensation-related issues. As the automotive industry invests in new technologies, the role of humidity sensors in vehicle design and functionality is expanding, boosting the segment's market dominance.

The environmental segment is the fastest-growing in the Humidity Sensor Market over the forecast period from 2024 to 2032. Rising concerns over climate change, air quality, and environmental monitoring are driving demand for accurate humidity sensors. These sensors are increasingly used in weather stations, agriculture, and industrial applications to monitor and control humidity levels, ensuring optimal conditions for crops, manufacturing processes, and pollution control. Additionally, government regulations regarding environmental standards and energy efficiency are fueling market growth. As industries and governments focus on sustainability and environmental conservation, humidity sensors are becoming essential tools for effective environmental management, contributing to the segment's rapid growth during the forecast period.

Regional Analysis

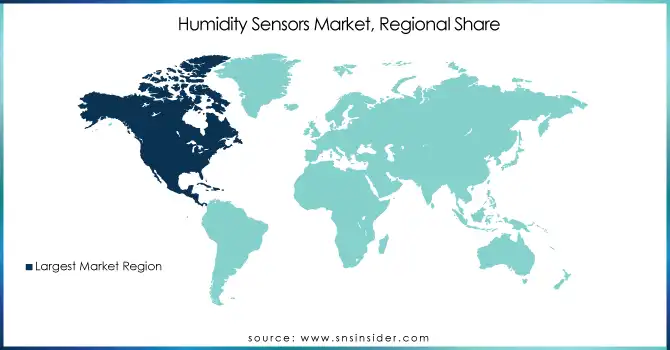
The Asia-Pacific region is dominating the Humidity Sensor Market, accounting for approximately 40% of the market share in 2023. This dominance is driven by rapid industrialization, urbanization, and significant advancements in manufacturing sectors across key countries like China, Japan, South Korea, and India. China, in particular, is a major contributor, with its robust automotive, electronics, and environmental sectors driving demand for humidity sensors. Additionally, the region’s growing focus on smart agriculture, climate control in buildings, and environmental monitoring is further propelling the adoption of humidity sensors. The expansion of healthcare and pharmaceutical industries, especially in India, is also contributing to market growth. With increasing investments in technological innovation and sustainability, Asia-Pacific is poised to maintain its leading position in the global humidity sensor market.

North America is the fastest-growing region in the Humidity Sensor Market over the forecast period from 2024 to 2032. This growth is driven by advancements in technology, particularly in industries such as automotive, healthcare, and environmental monitoring. The United States and Canada are seeing increased adoption of humidity sensors in electric vehicles, smart building systems, and HVAC (Heating, Ventilation, and Air Conditioning) applications, as energy efficiency and sustainability take center stage. Additionally, the region's growing emphasis on climate control solutions and air quality monitoring in response to rising health concerns is boosting the demand for precision humidity sensors. North America's robust infrastructure, along with regulatory standards requiring stringent environmental controls, particularly in pharmaceuticals and food safety, further accelerates the growth of humidity sensor technologies in this region.

Humidity-Sensors-Market-Regional-Share

Need any customization research on Humidity Sensors Market - Enquiry Now

Key Players

Some of the major key players in Humidity Sensors Market

  • Honeywell International Inc.(USA)

  • B+B Thermo-Technik GmbH (Germany)

  • E+E Elektronik Ges.m.b.H. (Austria)

  • IST AG (Switzerland)

  • Galltec Mess- und Regeltechnik GmbH (Germany)

  • TE Connectivity (USA)

  • Bosch Sensortec GmbH (Germany)

  • PCE Deutschland GmbH (Germany)

  • Sensata Technologies, Inc. (USA)

  • Infineon Technologies AG (Germany)

  • Amphenol Advanced Sensors (USA)

  • Panasonic Corporation (Japan)

  • Omega Engineering (USA)

  • Vaisala Oyj (Finland)

List of Suppliers in provide raw materials and components for the humidity sensor market:

  • Dow Inc.

  • BASF SE

  • 3M

  • Texas Instruments

  • STMicroelectronics

  • Analog Devices

  • Infineon Technologies AG

  • Murata Manufacturing Co., Ltd.

  • NXP Semiconductors

  • Kemet Corporation

Recent Development

  • Jan 15, 2025 – Infineon Technologies has developed an integrated MEMS-based ultrasound transducer, offering a smaller footprint, improved performance, and higher functionality. This innovation enhances ultrasonic applications across consumer electronics, automotive, and medical industries, improving signal quality and reducing noise significantly

  • June 2024, Bosch Sensortec has introduced the BME690, a 4-in-1 MEMS air quality sensor that offers 50% power savings and is optimized for high-condensation environments. With AI-driven features, it monitors gases, humidity, temperature, and pressure, ensuring precise indoor air quality detection, perfect for battery-operated devices.

Humidity Sensors Market Report Scope:

Report Attributes Details
Market Size in 2023 USD 2.59 Billion
Market Size by 2032 USD 4.86 Billion
CAGR CAGR of 7.25% From 2024 to 2032
Base Year 2023
Forecast Period 2024-2032
Historical Data 2020-2022
Report Scope & Coverage Market Size, Segments Analysis, Competitive  Landscape, Regional Analysis, DROC & SWOT Analysis, Forecast Outlook
Key Segments • By Type (Absolute Humidity Sensor, Relative Humidity Sensor, Others)
• By End Use(Automotive, Pharmaceutical & Healthcare, Industrial, Building Automation & Domestic Appliances, Food & Beverages, Environmental, Agriculture, Others)
Regional Analysis/Coverage North America (US, Canada, Mexico), Europe (Eastern Europe [Poland, Romania, Hungary, Turkey, Rest of Eastern Europe] Western Europe] Germany, France, UK, Italy, Spain, Netherlands, Switzerland, Austria, Rest of Western Europe]), Asia Pacific (China, India, Japan, South Korea, Vietnam, Singapore, Australia, Rest of Asia Pacific), Middle East & Africa (Middle East [UAE, Egypt, Saudi Arabia, Qatar, Rest of Middle East], Africa [Nigeria, South Africa, Rest of Africa], Latin America (Brazil, Argentina, Colombia, Rest of Latin America)
Company Profiles
Honeywell International Inc. (USA), B+B Thermo-Technik GmbH (Germany), Sensirion AG (Switzerland), E+E Elektronik Ges.m.b.H. (Austria), IST AG (Switzerland), Galltec Mess- und Regeltechnik GmbH (Germany), TE Connectivity (USA), Bosch Sensortec GmbH (Germany), PCE Deutschland GmbH (Germany), Sensata Technologies, Inc. (USA), Infineon Technologies AG (Germany), Amphenol Advanced Sensors (USA), Panasonic Corporation (Japan), Omega Engineering (USA), Vaisala Oyj (Finland).


Key Drivers • Focus on Energy-Efficient and Sustainable Solutions Driving Humidity Sensor Adoption
Restraints • The integration complexity of humidity sensors into existing systems, especially those relying on legacy equipment, poses a significant challenge for industries.


Frequently Asked Questions

Ans: Humidity Sensors Market is anticipated to expand by 7.25 % from 2024 to 2032

Ans USD 4.86 Billion is expected to grow by 2032.

Ans: Humidity Sensors Market size was valued at USD 2.59 Billion in 2023.

Ans: Key market drivers for the Humidity Sensors Market include growing demand for precise environmental monitoring and technological advancements in sensor integration.

Ans: Asia-Pacific dominates the Humidity Sensors Market.

Table of Content

1. Introduction

1.1 Market Definition

1.2 Scope (Inclusion and Exclusions)

1.3 Research Assumptions

2. Executive Summary

2.1 Market Overview

2.2 Regional Synopsis

2.3 Competitive Summary

3. Research Methodology

3.1 Top-Down Approach

3.2 Bottom-up Approach

3.3. Data Validation

3.4 Primary Interviews

4. Market Dynamics Impact Analysis

4.1 Market Driving Factors Analysis

4.1.2 Drivers

4.1.2 Restraints

4.2 PESTLE Analysis

4.3 Porter’s Five Forces Model

5. Statistical Insights and Trends Reporting

5.1 Adoption Rates, 2020-2032, by Region 

5.2 Regulatory Compliance Costs: by Region

5.3 Sensor Efficiency Metrics

5.4 Supply Chain Data by Region

6. Competitive Landscape

6.1 List of Major Companies, By Region

6.2 Market Share Analysis, By Region

6.3 Product Benchmarking

6.3.1 Product specifications and features

6.3.2 Pricing

6.4 Strategic Initiatives

6.4.1 Marketing and promotional activities

6.4.2 Distribution and supply chain strategies

6.4.3 Expansion plans and new product launches

6.4.4 Strategic partnerships and collaborations

6.5 Technological Advancements

6.6 Market Positioning and Branding

7. Humidity Sensors Market Segmentation, by Type

7.1 Chapter Overview

7.2 Absolute Humidity Sensor

7.2.1 Absolute Humidity Sensor Market Trends Analysis (2020-2032)

7.2.2 Absolute Humidity Sensor Market Size Estimates and Forecasts to 2032 (USD Billion)

7.3 Relative Humidity Sensor

7.3.1 Relative Humidity Sensor Market Trends Analysis (2020-2032)

7.3.2 Relative Humidity Sensor Market Size Estimates and Forecasts to 2032 (USD Billion)

8. Humidity Sensors Market Segmentation, by End Use

8.1 Chapter Overview

8.2 Automotive

8.2.1 Automotive Market Trends Analysis (2020-2032)

8.2.2 Automotive Market Size Estimates and Forecasts to 2032 (USD Billion)

8.3 Pharmaceutical & Healthcare

8.3.1 Pharmaceutical & Healthcare Market Trends Analysis (2020-2032)

8.3.2 Pharmaceutical & Healthcare Market Size Estimates and Forecasts to 2032 (USD Billion)

8.4 Industrial

8.4.1 Industrial Market Trends Analysis (2020-2032)

8.4.2 Industrial Market Size Estimates and Forecasts to 2032 (USD Billion)

8.5 Building Automation & Domestic Appliances

8.5.1 Building Automation & Domestic Appliances Market Trends Analysis (2020-2032)

8.5.2 Building Automation & Domestic Appliances Market Size Estimates and Forecasts to 2032 (USD Billion)

8.6 Food & Beverages

8.6.1 Food & Beverages Market Trends Analysis (2020-2032)

8.6.2 Food & Beverages Market Size Estimates and Forecasts to 2032 (USD Billion)

8.7 Environmental

8.7.1 Environmental Market Trends Analysis (2020-2032)

8.7.2 Environmental Market Size Estimates and Forecasts to 2032 (USD Billion)

8.8 Agriculture

8.8.1 Agriculture Market Trends Analysis (2020-2032)

8.8.2 Agriculture Market Size Estimates and Forecasts to 2032 (USD Billion)

8.9 Others

8.9.1 Others Market Trends Analysis (2020-2032)

8.9.2 Others Size Estimates and Forecasts to 2032 (USD Billion)

9. Regional Analysis

9.1 Chapter Overview

9.2 North America

9.2.1 Trends Analysis

9.2.2 North America Humidity Sensors Market Estimates and Forecasts, by Country (2020-2032) (USD Billion)

9.2.3 North America Humidity Sensors Market Estimates and Forecasts, by Type (2020-2032) (USD Billion) 

9.2.4 North America Humidity Sensors Market Estimates and Forecasts, by End Use (2020-2032) (USD Billion)

9.2.5 USA

9.2.5.1 USA Humidity Sensors Market Estimates and Forecasts, by Type (2020-2032) (USD Billion)

9.2.5.2 USA Humidity Sensors Market Estimates and Forecasts, by End Use (2020-2032) (USD Billion)

9.2.6 Canada

9.2.6.1 Canada Humidity Sensors Market Estimates and Forecasts, by Type (2020-2032) (USD Billion)

9.2.6.2 Canada Humidity Sensors Market Estimates and Forecasts, by End Use (2020-2032) (USD Billion)

9.2.7 Mexico

9.2.7.1 Mexico Humidity Sensors Market Estimates and Forecasts, by Type (2020-2032) (USD Billion)

9.2.7.2 Mexico Humidity Sensors Market Estimates and Forecasts, by End Use (2020-2032) (USD Billion)

9.3 Europe

9.3.1 Eastern Europe

9.3.1.1 Trends Analysis

9.3.1.2 Eastern Europe Humidity Sensors Market Estimates and Forecasts, by Country (2020-2032) (USD Billion)

9.3.1.3 Eastern Europe Humidity Sensors Market Estimates and Forecasts, by Type (2020-2032) (USD Billion) 

9.3.1.4 Eastern Europe Humidity Sensors Market Estimates and Forecasts, by End Use (2020-2032) (USD Billion)

9.3.1.5 Poland

9.3.1.5.1 Poland Humidity Sensors Market Estimates and Forecasts, by Type (2020-2032) (USD Billion)

9.3.1.5.2 Poland Humidity Sensors Market Estimates and Forecasts, by End Use (2020-2032) (USD Billion)

9.3.1.6 Romania

9.3.1.6.1 Romania Humidity Sensors Market Estimates and Forecasts, by Type (2020-2032) (USD Billion)

9.3.1.6.2 Romania Humidity Sensors Market Estimates and Forecasts, by End Use (2020-2032) (USD Billion)

9.3.1.7 Hungary

9.3.1.7.1 Hungary Humidity Sensors Market Estimates and Forecasts, by Type (2020-2032) (USD Billion)

9.3.1.7.2 Hungary Humidity Sensors Market Estimates and Forecasts, by End Use (2020-2032) (USD Billion)

9.3.1.8 Turkey

9.3.1.8.1 Turkey Humidity Sensors Market Estimates and Forecasts, by Type (2020-2032) (USD Billion)

9.3.1.8.2 Turkey Humidity Sensors Market Estimates and Forecasts, by End Use (2020-2032) (USD Billion)

9.3.1.9 Rest of Eastern Europe

9.3.1.9.1 Rest of Eastern Europe Humidity Sensors Market Estimates and Forecasts, by Type (2020-2032) (USD Billion)

9.3.1.9.2 Rest of Eastern Europe Humidity Sensors Market Estimates and Forecasts, by End Use (2020-2032) (USD Billion)

9.3.2 Western Europe

9.3.2.1 Trends Analysis

9.3.2.2 Western Europe Humidity Sensors Market Estimates and Forecasts, by Country (2020-2032) (USD Billion)

9.3.2.3 Western Europe Humidity Sensors Market Estimates and Forecasts, by Type (2020-2032) (USD Billion) 

9.3.2.4 Western Europe Humidity Sensors Market Estimates and Forecasts, by End Use (2020-2032) (USD Billion)

9.3.2.5 Germany

9.3.2.5.1 Germany Humidity Sensors Market Estimates and Forecasts, by Type (2020-2032) (USD Billion)

9.3.2.5.2 Germany Humidity Sensors Market Estimates and Forecasts, by End Use (2020-2032) (USD Billion)

9.3.2.6 France

9.3.2.6.1 France Humidity Sensors Market Estimates and Forecasts, by Type (2020-2032) (USD Billion)

9.3.2.6.2 France Humidity Sensors Market Estimates and Forecasts, by End Use (2020-2032) (USD Billion)

9.3.2.7 UK

9.3.2.7.1 UK Humidity Sensors Market Estimates and Forecasts, by Type (2020-2032) (USD Billion)

9.3.2.7.2 UK Humidity Sensors Market Estimates and Forecasts, by End Use (2020-2032) (USD Billion)

9.3.2.8 Italy

9.3.2.8.1 Italy Humidity Sensors Market Estimates and Forecasts, by Type (2020-2032) (USD Billion)

9.3.2.8.2 Italy Humidity Sensors Market Estimates and Forecasts, by End Use (2020-2032) (USD Billion)

9.3.2.9 Spain

9.3.2.9.1 Spain Humidity Sensors Market Estimates and Forecasts, by Type (2020-2032) (USD Billion)

9.3.2.9.2 Spain Humidity Sensors Market Estimates and Forecasts, by End Use (2020-2032) (USD Billion)

9.3.2.10 Netherlands

9.3.2.10.1 Netherlands Humidity Sensors Market Estimates and Forecasts, by Type (2020-2032) (USD Billion)

9.3.2.10.2 Netherlands Humidity Sensors Market Estimates and Forecasts, by End Use (2020-2032) (USD Billion)

9.3.2.11 Switzerland

9.3.2.11.1 Switzerland Humidity Sensors Market Estimates and Forecasts, by Type (2020-2032) (USD Billion)

9.3.2.11.2 Switzerland Humidity Sensors Market Estimates and Forecasts, by End Use (2020-2032) (USD Billion)

9.3.2.12 Austria

9.3.2.12.1 Austria Humidity Sensors Market Estimates and Forecasts, by Type (2020-2032) (USD Billion)

9.3.2.12.2 Austria Humidity Sensors Market Estimates and Forecasts, by End Use (2020-2032) (USD Billion)

9.3.2.13 Rest of Western Europe

9.3.2.13.1 Rest of Western Europe Humidity Sensors Market Estimates and Forecasts, by Type (2020-2032) (USD Billion)

9.3.2.13.2 Rest of Western Europe Humidity Sensors Market Estimates and Forecasts, by End Use (2020-2032) (USD Billion)

9.4 Asia-Pacific

9.4.1 Trends Analysis

9.4.2 Asia-Pacific Humidity Sensors Market Estimates and Forecasts, by Country (2020-2032) (USD Billion)

9.4.3 Asia-Pacific Humidity Sensors Market Estimates and Forecasts, by Type (2020-2032) (USD Billion) 

9.4.4 Asia-Pacific Humidity Sensors Market Estimates and Forecasts, by End Use (2020-2032) (USD Billion)

9.4.5 China

9.4.5.1 China Humidity Sensors Market Estimates and Forecasts, by Type (2020-2032) (USD Billion)

9.4.5.2 China Humidity Sensors Market Estimates and Forecasts, by End Use (2020-2032) (USD Billion)

9.4.6 India

9.4.5.1 India Humidity Sensors Market Estimates and Forecasts, by Type (2020-2032) (USD Billion)

9.4.5.2 India Humidity Sensors Market Estimates and Forecasts, by End Use (2020-2032) (USD Billion)

9.4.5 Japan

9.4.5.1 Japan Humidity Sensors Market Estimates and Forecasts, by Type (2020-2032) (USD Billion)

9.4.5.2 Japan Humidity Sensors Market Estimates and Forecasts, by End Use (2020-2032) (USD Billion)

9.4.6 South Korea

9.4.6.1 South Korea Humidity Sensors Market Estimates and Forecasts, by Type (2020-2032) (USD Billion)

9.4.6.2 South Korea Humidity Sensors Market Estimates and Forecasts, by End Use (2020-2032) (USD Billion)

9.4.7 Vietnam

9.4.7.1 Vietnam Humidity Sensors Market Estimates and Forecasts, by Type (2020-2032) (USD Billion)

9.2.7.2 Vietnam Humidity Sensors Market Estimates and Forecasts, by End Use (2020-2032) (USD Billion)

9.4.8 Singapore

9.4.8.1 Singapore Humidity Sensors Market Estimates and Forecasts, by Type (2020-2032) (USD Billion)

9.4.8.2 Singapore Humidity Sensors Market Estimates and Forecasts, by End Use (2020-2032) (USD Billion)

9.4.9 Australia

9.4.9.1 Australia Humidity Sensors Market Estimates and Forecasts, by Type (2020-2032) (USD Billion)

9.4.9.2 Australia Humidity Sensors Market Estimates and Forecasts, by End Use (2020-2032) (USD Billion)

9.4.10 Rest of Asia-Pacific

9.4.10.1 Rest of Asia-Pacific Humidity Sensors Market Estimates and Forecasts, by Type (2020-2032) (USD Billion)

9.4.10.2 Rest of Asia-Pacific Humidity Sensors Market Estimates and Forecasts, by End Use (2020-2032) (USD Billion)

9.5 Middle East and Africa

9.5.1 Middle East

9.5.1.1 Trends Analysis

9.5.1.2 Middle East Humidity Sensors Market Estimates and Forecasts, by Country (2020-2032) (USD Billion)

9.5.1.3 Middle East Humidity Sensors Market Estimates and Forecasts, by Type (2020-2032) (USD Billion) 

9.5.1.4 Middle East Humidity Sensors Market Estimates and Forecasts, by End Use (2020-2032) (USD Billion)

9.5.1.5 UAE

9.5.1.5.1 UAE Humidity Sensors Market Estimates and Forecasts, by Type (2020-2032) (USD Billion)

9.5.1.5.2 UAE Humidity Sensors Market Estimates and Forecasts, by End Use (2020-2032) (USD Billion)

9.5.1.6 Egypt

9.5.1.6.1 Egypt Humidity Sensors Market Estimates and Forecasts, by Type (2020-2032) (USD Billion)

9.5.1.6.2 Egypt Humidity Sensors Market Estimates and Forecasts, by End Use (2020-2032) (USD Billion)

9.5.1.7 Saudi Arabia

9.5.1.7.1 Saudi Arabia Humidity Sensors Market Estimates and Forecasts, by Type (2020-2032) (USD Billion)

9.5.1.7.2 Saudi Arabia Humidity Sensors Market Estimates and Forecasts, by End Use (2020-2032) (USD Billion)

9.5.1.8 Qatar

9.5.1.8.1 Qatar Humidity Sensors Market Estimates and Forecasts, by Type (2020-2032) (USD Billion)

9.5.1.8.2 Qatar Humidity Sensors Market Estimates and Forecasts, by End Use (2020-2032) (USD Billion)

9.5.1.9 Rest of Middle East

9.5.1.9.1 Rest of Middle East Humidity Sensors Market Estimates and Forecasts, by Type (2020-2032) (USD Billion)

9.5.1.9.2 Rest of Middle East Humidity Sensors Market Estimates and Forecasts, by End Use (2020-2032) (USD Billion)

9.5.2 Africa

9.5.2.1 Trends Analysis

9.5.2.2 Africa Humidity Sensors Market Estimates and Forecasts, by Country (2020-2032) (USD Billion)

9.5.2.3 Africa Humidity Sensors Market Estimates and Forecasts, by Type (2020-2032) (USD Billion) 

9.5.2.4 Africa Humidity Sensors Market Estimates and Forecasts, by End Use (2020-2032) (USD Billion)

9.5.2.5 South Africa

9.5.2.5.1 South Africa Humidity Sensors Market Estimates and Forecasts, by Type (2020-2032) (USD Billion)

9.5.2.5.2 South Africa Humidity Sensors Market Estimates and Forecasts, by End Use (2020-2032) (USD Billion)

9.5.2.6 Nigeria

9.5.2.6.1 Nigeria Humidity Sensors Market Estimates and Forecasts, by Type (2020-2032) (USD Billion)

9.5.2.6.2 Nigeria Humidity Sensors Market Estimates and Forecasts, by End Use (2020-2032) (USD Billion)

9.5.2.7 Rest of Africa

9.5.2.7.1 Rest of Africa Humidity Sensors Market Estimates and Forecasts, by Type (2020-2032) (USD Billion)

9.5.2.7.2 Rest of Africa Humidity Sensors Market Estimates and Forecasts, by End Use (2020-2032) (USD Billion)

9.6 Latin America

9.6.1 Trends Analysis

9.6.2 Latin America Humidity Sensors Market Estimates and Forecasts, by Country (2020-2032) (USD Billion)

9.6.3 Latin America Humidity Sensors Market Estimates and Forecasts, by Type (2020-2032) (USD Billion) 

9.6.4 Latin America Humidity Sensors Market Estimates and Forecasts, by End Use (2020-2032) (USD Billion)

9.6.5 Brazil

9.6.5.1 Brazil Humidity Sensors Market Estimates and Forecasts, by Type (2020-2032) (USD Billion)

9.6.5.2 Brazil Humidity Sensors Market Estimates and Forecasts, by End Use (2020-2032) (USD Billion)

9.6.6 Argentina

9.6.6.1 Argentina Humidity Sensors Market Estimates and Forecasts, by Type (2020-2032) (USD Billion)

9.6.6.2 Argentina Humidity Sensors Market Estimates and Forecasts, by End Use (2020-2032) (USD Billion)

9.6.7 Colombia

9.6.7.1 Colombia Humidity Sensors Market Estimates and Forecasts, by Type (2020-2032) (USD Billion)

9.6.7.2 Colombia Humidity Sensors Market Estimates and Forecasts, by End Use (2020-2032) (USD Billion)

9.6.8 Rest of Latin America

9.6.8.1 Rest of Latin America Humidity Sensors Market Estimates and Forecasts, by Type (2020-2032) (USD Billion)

9.6.8.2 Rest of Latin America Humidity Sensors Market Estimates and Forecasts, by End Use (2020-2032) (USD Billion)

10. Company Profiles

10.1 Honeywell International Inc.

10.1.1 Company Overview

10.1.2 Financial

10.1.3 Products/ Services Offered

10.1.4 SWOT Analysis

10.2 B+B Thermo-Technik GmbH

10.2.1 Company Overview

10.2.2 Financial

10.2.3 Products/ Services Offered

10.2.4 SWOT Analysis

10.3 Sensirion AG

10.3.1 Company Overview

10.3.2 Financial

10.3.3 Products/ Services Offered

10.3.4 SWOT Analysis

10.4 E+E Elektronik Ges.m.b.H.

10.4.1 Company Overview

10.4.2 Financial

10.4.3 Products/ Services Offered

10.4.4 SWOT Analysis

10.5 IST AG

 10.5.1 Company Overview

10.5.2 Financial

10.5.3 Products/ Services Offered

10.5.4 SWOT Analysis

10.6 Galltec Mess- und Regeltechnik GmbH

10.6.1 Company Overview

10.6.2 Financial

10.6.3 Products/ Services Offered

10.6.4 SWOT Analysis

10.7 TE Connectivity

10.7.1 Company Overview

10.7.2 Financial

10.7.3 Products/ Services Offered

10.7.4 SWOT Analysis

10.8 Bosch Sensortec GmbH

 10.8.1 Company Overview

10.8.2 Financial

10.8.3 Products/ Services Offered

10.8.4 SWOT Analysis

10.9 PCE Deutschland GmbH

10.9.1 Company Overview

10.9.2 Financial

10.9.3 Products/ Services Offered

10.9.4 SWOT Analysis

10.10 Sensata Technologies, Inc.

10.10.1 Company Overview

10.10.2 Financial

10.10.3 Products/ Services Offered

10.10.4 SWOT Analysis

11. Use Cases and Best Practices

12. Conclusion

An accurate research report requires proper strategizing as well as implementation. There are multiple factors involved in the completion of good and accurate research report and selecting the best methodology to compete the research is the toughest part. Since the research reports we provide play a crucial role in any company’s decision-making process, therefore we at SNS Insider always believe that we should choose the best method which gives us results closer to reality. This allows us to reach at a stage wherein we can provide our clients best and accurate investment to output ratio.

Each report that we prepare takes a timeframe of 350-400 business hours for production. Starting from the selection of titles through a couple of in-depth brain storming session to the final QC process before uploading our titles on our website we dedicate around 350 working hours. The titles are selected based on their current market cap and the foreseen CAGR and growth.


The 5 steps process:

Step 1: Secondary Research:

Secondary Research or Desk Research is as the name suggests is a research process wherein, we collect data through the readily available information. In this process we use various paid and unpaid databases which our team has access to and gather data through the same. This includes examining of listed companies’ annual reports, Journals, SEC filling etc. Apart from this our team has access to various associations across the globe across different industries. Lastly, we have exchange relationships with various university as well as individual libraries.

Secondary Research

Step 2: Primary Research

When we talk about primary research, it is a type of study in which the researchers collect relevant data samples directly, rather than relying on previously collected data.  This type of research is focused on gaining content specific facts that can be sued to solve specific problems. Since the collected data is fresh and first hand therefore it makes the study more accurate and genuine.

We at SNS Insider have divided Primary Research into 2 parts.

Part 1 wherein we interview the KOLs of major players as well as the upcoming ones across various geographic regions. This allows us to have their view over the market scenario and acts as an important tool to come closer to the accurate market numbers. As many as 45 paid and unpaid primary interviews are taken from both the demand and supply side of the industry to make sure we land at an accurate judgement and analysis of the market.

This step involves the triangulation of data wherein our team analyses the interview transcripts, online survey responses and observation of on filed participants. The below mentioned chart should give a better understanding of the part 1 of the primary interview.

Primary Research

Part 2: In this part of primary research the data collected via secondary research and the part 1 of the primary research is validated with the interviews from individual consultants and subject matter experts.

Consultants are those set of people who have at least 12 years of experience and expertise within the industry whereas Subject Matter Experts are those with at least 15 years of experience behind their back within the same space. The data with the help of two main processes i.e., FGDs (Focused Group Discussions) and IDs (Individual Discussions). This gives us a 3rd party nonbiased primary view of the market scenario making it a more dependable one while collation of the data pointers.

Step 3: Data Bank Validation

Once all the information is collected via primary and secondary sources, we run that information for data validation. At our intelligence centre our research heads track a lot of information related to the market which includes the quarterly reports, the daily stock prices, and other relevant information. Our data bank server gets updated every fortnight and that is how the information which we collected using our primary and secondary information is revalidated in real time.

Data Bank Validation

Step 4: QA/QC Process

After all the data collection and validation our team does a final level of quality check and quality assurance to get rid of any unwanted or undesired mistakes. This might include but not limited to getting rid of the any typos, duplication of numbers or missing of any important information. The people involved in this process include technical content writers, research heads and graphics people. Once this process is completed the title gets uploader on our platform for our clients to read it.

Step 5: Final QC/QA Process:

This is the last process and comes when the client has ordered the study. In this process a final QA/QC is done before the study is emailed to the client. Since we believe in giving our clients a good experience of our research studies, therefore, to make sure that we do not lack at our end in any way humanly possible we do a final round of quality check and then dispatch the study to the client.

Key Segments:

By Type

  • Absolute Humidity Sensor

  • Relative Humidity Sensor

  • Others

By End Use

  • Automotive

  • Pharmaceutical & Healthcare

  • Industrial

  • Building Automation & Domestic Appliances

  • Food & Beverages

  • Environmental

  • Agriculture

  • Others

Request for Segment Customization as per your Business Requirement: Segment Customization Request

REGIONAL COVERAGE:

North America

  • US

  • Canada

  • Mexico

Europe

  • Eastern Europe

    • Poland

    • Romania

    • Hungary

    • Turkey

    • Rest of Eastern Europe

  • Western Europe

    • Germany

    • France

    • UK

    • Italy

    • Spain

    • Netherlands

    • Switzerland

    • Austria

    • Rest of Western Europe

Asia-Pacific

  • China

  • India

  • Japan

  • South Korea

  • Vietnam

  • Singapore

  • Australia

  • Rest of Asia Pacific

Middle East & Africa

  • Middle East

    • UAE

    • Egypt

    • Saudi Arabia

    • Qatar

    • Rest of the Middle East

  • Africa

    • Nigeria

    • South Africa

    • Rest of Africa

Latin America

  • Brazil

  • Argentina

  • Colombia

  • Rest of Latin America

Request for Country Level Research Report: Country Level Customization Request

Available Customization

With the given market data, SNS Insider offers customization as per the company’s specific needs. The following customization options are available for the report:

  • Product Analysis

  • Criss-Cross segment analysis (e.g. Product X Application)

  • Product Matrix which gives a detailed comparison of the product portfolio of each company

  • Geographic Analysis

  • Additional countries in any of the regions

  • Company Information

  • Detailed analysis and profiling of additional market players (Up to five)


  •            5000 (33% Discount)


  •            8950 (40% Discount)


  •            3050 (23% Discount)

Start a Conversation

Hi! Click one of our member below to chat on Phone