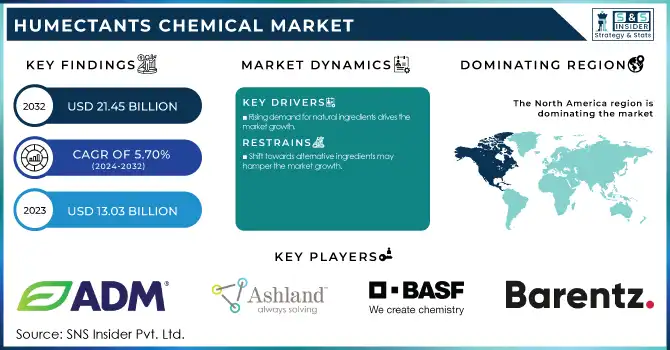
The Humectants Chemical Market was USD 13.03 Billion in 2023 and is expected to reach USD 21.45 Billion by 2032, growing at a CAGR of 5.70% over the forecast period of 2024-2032.
Get More Information on Humectants Chemical Market - Request Sample Report
The increasing awareness regarding personal care and cosmetic products has substantially increase the demand for humectants, especially in moisturizers, creams and lotions. A significant part of the products, humectants work by attracting the moisture to the skin as well as ensuring that the moisture is locked in as it works to keep the skin hydrated and improve the texture of the skin. In addition, with consumers chasing after products that add extra benefit including anti-aging, humidification, and skin nourishment, the growing demand for formulations with humectants such as glycerin, hyaluronic acid and propylene glycol is escalating. This increase in complex skincare habits, along with the consumer preference for organic & natural beauty products, is likely to drive the growth of humectants in cosmetic industry globally.
Advancement in formulations of chemicals has significantly increased the efficiency and functionalities of humectants, which can help the product hold moisture. Novel humectant compounds with high water retention ability are being developed by researchers and manufacturers to provide prolonged moisture retention in food, cosmetic and pharmaceutical formulations. By exporting bio-based and multifunctional humectants, not only do customers achieve improved functional benefits, but also include humectants that are increasingly in-demand for being sustainable and beneficial at the skin level. These developments address changing consumer demand, especially in personal care and food preservation applications, thereby expanding the market and product innovation.
For instance, The Indian Council of Agricultural Research (ICAR) discusses the utilization of waste and by-products from fisheries and fish processing activities, which can be converted into valuable biomolecules, including humectants, for use in foodstuffs, nutraceuticals, pharmaceuticals, and cosmetics.
Drivers
Rising demand for natural ingredients drives the market growth.
The surging demand for naturally sourced ingredient emerges as a prime growth contributor to humectants market, as customers preference are shifting towards ever so popular clean-label, organic and plant-based products. As the dangers of synthetic chemicals are gaining attention in the food and beverages, personal care, and pharmaceutical industries, major players are increasingly using naturally derived humectants such as glycerin, aloe vera extract, honey, and hyaluronic acid. With dermal appeal, the personal care segment is seeing brands creating skincare and haircare using plant-based humectants to align with increasing demand for sustainable and gentler ingredients. Likewise, in the food industry, if you keep your product less moist, but natural, the natural humectants can be utilized to have moisture-maintaining properties and smooth texture without any synthetic function. This trend is further complemented by government regulations in favor of sustainable and organic ingredients, which fuels the growth of bio-based humectants across different application areas. This has led to R&D investments made by manufacturers in developing novel high-performance natural humectants that support clean-label and sustainability trend, thereby creating lucrative opportunities for US natural humectant market.
Restraint
Shift towards alternative ingredients may hamper the market growth.
The use of alternative ingredients is a threat to the humectants market because consumers and industry are working on finding replacements for humectants that better meet their preferences and the changes in regulations as well. Because of rising worries about synthetic chemical substances, some producers are selecting non-synthetic hydration alternatives, together with botanical extracts, plant oils, waxes, and excessive bio-based polymer, which could exchange traditional humectants. Another driver in the food and beverage sector is the clean-label trend, which prefers naturally occurring moisture-retaining ingredients, such as fruits and vegetable extracts, compared with processed humectants. Some consumer habits are also changing as stricter regulatory controls regarding the use of some chemical-based humectants, especially in cosmetics and pharmaceuticals, which may hamper the market growth.
By Source
Natural source held the largest market share of around 64% in 2023. It is due to high demand for clean-label, plant-based, and sustainable ingredients, the humectants market is characterized by the largest share held by the natural segment. As consumers are becoming more aware of health and environmental-related concerns, the food and beverages, personal care and the pharmaceuticals sector are reverting towards using naturally derived humectants like glycerin, honey, aloe vera and hyaluronic acid. For personal care, natural humectants are increasingly used in skin and hair care formulations to provide successful hydration with non-synthetic chemicals. Likewise in the food industry, they are employed to retain moisture and improve texture without hindering product stability and functionality.
By Product
The sugar alcohol segment held the largest market share around 38% in 2023. The sugar alcohol segment held the largest market share in the humectants market due to the high usage in food and beverage, pharmaceutical, and personal care industries. Sugar alcohols have been used extensively as humectants because of their high humidity retentivity, low caloric value and ability to also provide sweetness which make them sugar-free and reduced-sugar food product suitable candidates. Sugar alcohols in the pharmaceutical sector are often added in oral syrups, chewable tablets and also in the mix of medicines to provide texture and stabilization. In the personal care industry, sugar alcohols serve as major components of skin and haircare formulations to ensure hydration and product stability.
By Application
Food & Beverage held the largest market share around 43% in 2023. Due to the product's role in providing moisture, texture, and longevity to a variety of food products, the food and beverage segment in the humectants market occupies the largest share of the market. Additionally, growing consumer preference for low-sugar and sugar-free products has propelled the use of humectants especially sugar alcohols in drinks, confections and functional foods.
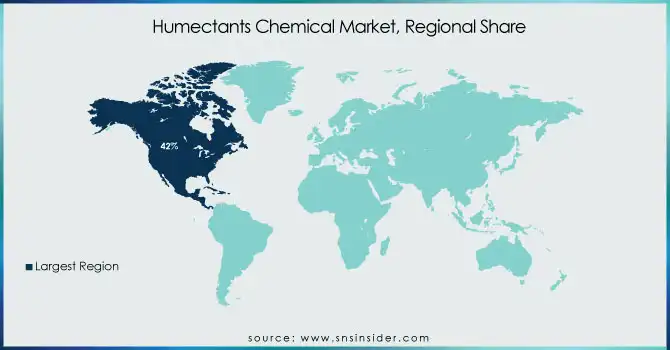
North America has the highest share of humectants chemical market of around 42% in 2023. It is due to the presence of key industries such as food and beverages, personal care, pharmaceuticals and animal feed in this region. Humectants chemical have been used extensively in the food industry in the region to increase the moisture retention, texture, and shelf life of bakery, confectionery, and processed food products. In addition, the rising demand for clean-label and sugar-free food products has resulted in the utilization of natural humectants and sugar alcohols. Moreover, the usage in personal care and cosmetics sector also accelerates the growth of the economy as plant-based humectants are incorporated into various skincare and haircare products by major brands to fulfill the demands of consumers towards the adoption of natural and recognized ingredients (natural and nature-identical). Additionally, the backing of agencies such as the U.S. Food and Drug Administration (FDA) and Health Canada to ensure the safety and quality of products also contributes to market growth. North America is the largest humectants market due to continuous developments in product compositions along with growing consumption of consumers toward functional ingredients.
Get Customized Report as per Your Business Requirement - Request For Customized Report
Key Players
Archer Daniels Midland Company (Sorbitol, Glycerin)
Ashland Global Holdings Inc. (Harmoniance, N-DurHance)
BASF SE (Hydagen, Verdessence)
Barentz (Sorbitol, Xylitol)
Brenntag AG (Sorbitol, Propylene Glycol)
Cargill Incorporated (C☆Dry MD, Zerose Erythritol)
E.I. Du Pont De Nemours & Company (GENENCARE OSMS BA, GRINDSTED® Sorbitol)
Ingredion (NATIVACARE, SORBOGEM)
Roquette Frères (PEARLITOL, SweetPearl)
DOW Chemical Company (DOWSIL 2501, Methocel)
Evonik Industries (TEGOSOFT, SIPERNAT)
Solvay (Rheomer, Repel-O-Tex)
Lubrizol Corporation (Glucamate, Carbopol)
Croda International (Glycerox, Crodesta)
Merck Group (Sorbitol, Glycerin)
Eastman Chemical Company (Sustane, Optifilm)
Clariant (Genadvance Hydra, Plantasens)
Lonza Group (Carnipure, H2OBioEV)
Givaudan (Vetivyne, Cristalhyal)
Kao Corporation (Glyteer, Lipidure)
Recent Development:
In 2024, ADM diversified its bio-based product lineup by spending on sustainable, plant-based materials including glycerin as humectants and incorporating them into its personal care & food sectors.
In 2023, Ashland global holdings Inc. launched new product formulations, including its N-DurHance, a natural humectant for the personal care industry, to meet the increasing demand for clean-label, eco-friendly ingredients.
In 2023, BASF SE introduced new bio-based humectants as part of its commitment to sustainability. Its "Hydagen" range was upgraded to enhance moisture retention properties in both cosmetics and food applications.
Report Attributes | Details |
---|---|
Market Size in 2023 | USD 13.03 Billion |
Market Size by 2032 | USD 21.45 Billion |
CAGR | CAGR of 5.70% From 2024 to 2032 |
Base Year | 2023 |
Forecast Period | 2024-2032 |
Historical Data | 2020-2022 |
Report Scope & Coverage | Market Size, Segments Analysis, Competitive Landscape, Regional Analysis, DROC & SWOT Analysis, Forecast Outlook |
Key Segments | • By Source (Synthetic, Natural) • By Product (Sugar Alcohol, Alpha Hydroxy Acid, Glycols, Others) • By Application (Food & Beverage, Oral & Personal Care, Pharmaceutical, Other) |
Regional Analysis/Coverage | North America (US, Canada, Mexico), Europe (Eastern Europe [Poland, Romania, Hungary, Turkey, Rest of Eastern Europe] Western Europe] Germany, France, UK, Italy, Spain, Netherlands, Switzerland, Austria, Rest of Western Europe]), Asia Pacific (China, India, Japan, South Korea, Vietnam, Singapore, Australia, Rest of Asia Pacific), Middle East & Africa (Middle East [UAE, Egypt, Saudi Arabia, Qatar, Rest of Middle East], Africa [Nigeria, South Africa, Rest of Africa], Latin America (Brazil, Argentina, Colombia, Rest of Latin America) |
Company Profiles | Archer Daniels Midland Company, Ashland Global Holdings Inc., BASF SE, Barentz, Brenntag AG, Cargill Incorporated, E.I. Du Pont De Nemours & Company, Ingredion, Roquette Frères, DOW Chemical Company, Evonik Industries, Solvay, Lubrizol Corporation, Croda International, Merck Group, Eastman Chemical Company, Clariant, Lonza Group, Givaudan, Kao Corporation |
Key Drivers | • Rising demand for natural ingredients drives the market growth. |
Restraints | • Shift towards alternative ingredients may hamper the market growth. |
Ans: The Humectants Chemical Market was valued at USD 13.03 Billion in 2023.
Ans: The expected CAGR of the global Humectants Chemical Market during the forecast period is 5.70%.
Ans: The Food & Beverage will grow rapidly in the Humectants Chemical Market from 2024-2032.
Ans: Rising demand for natural ingredients drives the market growth.
Ans: The North America led the Humectants Chemical Market in the region with the highest revenue share in 2023.
Table of Contents:
1. Introduction
1.1 Market Definition
1.2 Scope (Inclusion and Exclusions)
1.3 Research Assumptions
2. Executive Summary
2.1 Market Overview
2.2 Regional Synopsis
2.3 Competitive Summary
3. Research Methodology
3.1 Top-Down Approach
3.2 Bottom-up Approach
3.3. Data Validation
3.4 Primary Interviews
4. Market Dynamics Impact Analysis
4.1 Market Driving Factors Analysis
4.1.1 Drivers
4.1.2 Restraints
4.1.3 Opportunities
4.1.4 Challenges
4.2 PESTLE Analysis
4.3 Porter’s Five Forces Model
5. Statistical Insights and Trends Reporting
5.1 By Production Capacity and Utilization, by Country, By Type, 2023
5.2 Feedstock Prices, by Country, By Type, 2023
5.3 Regulatory Impact, by l Country, By Type, 2023.
5.4 Environmental Metrics: Emissions Data, Waste Management Practices, and Sustainability Initiatives, by Region
5.5 Innovation and R&D, Type, 2023
6. Competitive Landscape
6.1 List of Major Companies, By Region
6.2 Market Share Analysis, By Region
6.3 Product Benchmarking
6.3.1 Product specifications and features
6.3.2 Pricing
6.4 Strategic Initiatives
6.4.1 Marketing and promotional activities
6.4.2 Distribution and Supply Chain Strategies
6.4.3 Expansion plans and new Product launches
6.4.4 Strategic partnerships and collaborations
6.5 Technological Advancements
6.6 Market Positioning and Branding
7. Humectants Chemical Market Segmentation, by Source
7.1 Chapter Overview
7.2 Synthetic
7.2.1 Synthetic Market Trends Analysis (2020-2032)
7.2.2 Synthetic Market Size Estimates and Forecasts to 2032 (USD Billion)
7.3 Natural
7.3.1 Natural Market Trends Analysis (2020-2032)
7.3.2 Natural Market Size Estimates and Forecasts to 2032 (USD Billion)
8. Humectants Chemical Market Segmentation, by Product
8.1 Chapter Overview
8.2 Sugar Alcohol
8.2.1 Sugar Alcohol Market Trends Analysis (2020-2032)
8.2.2 Sugar Alcohol Market Size Estimates and Forecasts to 2032 (USD Billion)
8.3 Alpha Hydroxy Acid
8.3.1 Alpha Hydroxy Acid Market Trends Analysis (2020-2032)
8.3.2 Alpha Hydroxy Acid Market Size Estimates and Forecasts to 2032 (USD Billion)
8.4 Glycols
8.4.1 Glycols Market Trends Analysis (2020-2032)
8.4.2 Glycols Market Size Estimates and Forecasts to 2032 (USD Billion)
8.5 Others
8.5.1 Others Market Trends Analysis (2020-2032)
8.5.2 Others Market Size Estimates and Forecasts to 2032 (USD Billion)
9. Humectants Chemical Market Segmentation, by Application
9.1 Chapter Overview
9.2 Food & Beverage
9.2.1 Food & Beverage Market Trends Analysis (2020-2032)
9.2.2 Food & Beverage Market Size Estimates and Forecasts to 2032 (USD Billion)
9.3 Oral & Personal Care
9.3.1 Oral & Personal Care Market Trends Analysis (2020-2032)
9.3.2 Oral & Personal Care Market Size Estimates and Forecasts to 2032 (USD Billion)
9.4 Pharmaceutical
9.4.1 Pharmaceutical Market Trends Analysis (2020-2032)
9.4.2 Pharmaceutical Market Size Estimates and Forecasts to 2032 (USD Billion)
9.5 Others
9.5.1 Others Market Trends Analysis (2020-2032)
9.5.2 Others Market Size Estimates and Forecasts to 2032 (USD Billion)
10. Regional Analysis
10.1 Chapter Overview
10.2 North America
10.2.1 Trends Analysis
10.2.2 North America Humectants Chemical Market Estimates and Forecasts, by Country (2020-2032) (USD Billion)
10.2.3 North America Humectants Chemical Market Estimates and Forecasts, by Source (2020-2032) (USD Billion)
10.2.4 North America Humectants Chemical Market Estimates and Forecasts, by Product (2020-2032) (USD Billion)
10.2.5 North America Humectants Chemical Market Estimates and Forecasts, by Application (2020-2032) (USD Billion)
10.2.6 USA
10.2.6.1 USA Humectants Chemical Market Estimates and Forecasts, by Source (2020-2032) (USD Billion)
10.2.6.2 USA Humectants Chemical Market Estimates and Forecasts, by Product (2020-2032) (USD Billion)
10.2.6.3 USA Humectants Chemical Market Estimates and Forecasts, by Application (2020-2032) (USD Billion)
10.2.7 Canada
10.2.7.1 Canada Humectants Chemical Market Estimates and Forecasts, by Source (2020-2032) (USD Billion)
10.2.7.2 Canada Humectants Chemical Market Estimates and Forecasts, by Product (2020-2032) (USD Billion)
10.2.7.3 Canada Humectants Chemical Market Estimates and Forecasts, by Application (2020-2032) (USD Billion)
10.2.8 Mexico
10.2.8.1 Mexico Humectants Chemical Market Estimates and Forecasts, by Source (2020-2032) (USD Billion)
10.2.8.2 Mexico Humectants Chemical Market Estimates and Forecasts, by Product (2020-2032) (USD Billion)
10.2.8.3 Mexico Humectants Chemical Market Estimates and Forecasts, by Application (2020-2032) (USD Billion)
10.3 Europe
10.3.1 Eastern Europe
10.3.1.1 Trends Analysis
10.3.1.2 Eastern Europe Humectants Chemical Market Estimates and Forecasts, by Country (2020-2032) (USD Billion)
10.3.1.3 Eastern Europe Humectants Chemical Market Estimates and Forecasts, by Source (2020-2032) (USD Billion)
10.3.1.4 Eastern Europe Humectants Chemical Market Estimates and Forecasts, by Product (2020-2032) (USD Billion)
10.3.1.5 Eastern Europe Humectants Chemical Market Estimates and Forecasts, by Application (2020-2032) (USD Billion)
10.3.1.6 Poland
10.3.1.6.1 Poland Humectants Chemical Market Estimates and Forecasts, by Source (2020-2032) (USD Billion)
10.3.1.6.2 Poland Humectants Chemical Market Estimates and Forecasts, by Product (2020-2032) (USD Billion)
10.3.1.6.3 Poland Humectants Chemical Market Estimates and Forecasts, by Application (2020-2032) (USD Billion)
10.3.1.7 Romania
10.3.1.7.1 Romania Humectants Chemical Market Estimates and Forecasts, by Source (2020-2032) (USD Billion)
10.3.1.7.2 Romania Humectants Chemical Market Estimates and Forecasts, by Product (2020-2032) (USD Billion)
10.3.1.7.3 Romania Humectants Chemical Market Estimates and Forecasts, by Application (2020-2032) (USD Billion)
10.3.1.8 Hungary
10.3.1.8.1 Hungary Humectants Chemical Market Estimates and Forecasts, by Source (2020-2032) (USD Billion)
10.3.1.8.2 Hungary Humectants Chemical Market Estimates and Forecasts, by Product (2020-2032) (USD Billion)
10.3.1.8.3 Hungary Humectants Chemical Market Estimates and Forecasts, by Application (2020-2032) (USD Billion)
10.3.1.9 Turkey
10.3.1.9.1 Turkey Humectants Chemical Market Estimates and Forecasts, by Source (2020-2032) (USD Billion)
10.3.1.9.2 Turkey Humectants Chemical Market Estimates and Forecasts, by Product (2020-2032) (USD Billion)
10.3.1.9.3 Turkey Humectants Chemical Market Estimates and Forecasts, by Application (2020-2032) (USD Billion)
10.3.1.10 Rest of Eastern Europe
10.3.1.10.1 Rest of Eastern Europe Humectants Chemical Market Estimates and Forecasts, by Source (2020-2032) (USD Billion)
10.3.1.10.2 Rest of Eastern Europe Humectants Chemical Market Estimates and Forecasts, by Product (2020-2032) (USD Billion)
10.3.1.10.3 Rest of Eastern Europe Humectants Chemical Market Estimates and Forecasts, by Application (2020-2032) (USD Billion)
10.3.2 Western Europe
10.3.2.1 Trends Analysis
10.3.2.2 Western Europe Humectants Chemical Market Estimates and Forecasts, by Country (2020-2032) (USD Billion)
10.3.2.3 Western Europe Humectants Chemical Market Estimates and Forecasts, by Source (2020-2032) (USD Billion)
10.3.2.4 Western Europe Humectants Chemical Market Estimates and Forecasts, by Product (2020-2032) (USD Billion)
10.3.2.5 Western Europe Humectants Chemical Market Estimates and Forecasts, by Application (2020-2032) (USD Billion)
10.3.2.6 Germany
10.3.2.6.1 Germany Humectants Chemical Market Estimates and Forecasts, by Source (2020-2032) (USD Billion)
10.3.2.6.2 Germany Humectants Chemical Market Estimates and Forecasts, by Product (2020-2032) (USD Billion)
10.3.2.6.3 Germany Humectants Chemical Market Estimates and Forecasts, by Application (2020-2032) (USD Billion)
10.3.2.7 France
10.3.2.7.1 France Humectants Chemical Market Estimates and Forecasts, by Source (2020-2032) (USD Billion)
10.3.2.7.2 France Humectants Chemical Market Estimates and Forecasts, by Product (2020-2032) (USD Billion)
10.3.2.7.3 France Humectants Chemical Market Estimates and Forecasts, by Application (2020-2032) (USD Billion)
10.3.2.8 UK
10.3.2.8.1 UK Humectants Chemical Market Estimates and Forecasts, by Source (2020-2032) (USD Billion)
10.3.2.8.2 UK Humectants Chemical Market Estimates and Forecasts, by Product (2020-2032) (USD Billion)
10.3.2.8.3 UK Humectants Chemical Market Estimates and Forecasts, by Application (2020-2032) (USD Billion)
10.3.2.9 Italy
10.3.2.9.1 Italy Humectants Chemical Market Estimates and Forecasts, by Source (2020-2032) (USD Billion)
10.3.2.9.2 Italy Humectants Chemical Market Estimates and Forecasts, by Product (2020-2032) (USD Billion)
10.3.2.9.3 Italy Humectants Chemical Market Estimates and Forecasts, by Application (2020-2032) (USD Billion)
10.3.2.10 Spain
10.3.2.10.1 Spain Humectants Chemical Market Estimates and Forecasts, by Source (2020-2032) (USD Billion)
10.3.2.10.2 Spain Humectants Chemical Market Estimates and Forecasts, by Product (2020-2032) (USD Billion)
10.3.2.10.3 Spain Humectants Chemical Market Estimates and Forecasts, by Application (2020-2032) (USD Billion)
10.3.2.11 Netherlands
10.3.2.11.1 Netherlands Humectants Chemical Market Estimates and Forecasts, by Source (2020-2032) (USD Billion)
10.3.2.11.2 Netherlands Humectants Chemical Market Estimates and Forecasts, by Product (2020-2032) (USD Billion)
10.3.2.11.3 Netherlands Humectants Chemical Market Estimates and Forecasts, by Application (2020-2032) (USD Billion)
10.3.2.12 Switzerland
10.3.2.12.1 Switzerland Humectants Chemical Market Estimates and Forecasts, by Source (2020-2032) (USD Billion)
10.3.2.12.2 Switzerland Humectants Chemical Market Estimates and Forecasts, by Product (2020-2032) (USD Billion)
10.3.2.12.3 Switzerland Humectants Chemical Market Estimates and Forecasts, by Application (2020-2032) (USD Billion)
10.3.2.13 Austria
10.3.2.13.1 Austria Humectants Chemical Market Estimates and Forecasts, by Source (2020-2032) (USD Billion)
10.3.2.13.2 Austria Humectants Chemical Market Estimates and Forecasts, by Product (2020-2032) (USD Billion)
10.3.2.13.3 Austria Humectants Chemical Market Estimates and Forecasts, by Application (2020-2032) (USD Billion)
10.3.2.14 Rest of Western Europe
10.3.2.14.1 Rest of Western Europe Humectants Chemical Market Estimates and Forecasts, by Source (2020-2032) (USD Billion)
10.3.2.14.2 Rest of Western Europe Humectants Chemical Market Estimates and Forecasts, by Product (2020-2032) (USD Billion)
10.3.2.14.3 Rest of Western Europe Humectants Chemical Market Estimates and Forecasts, by Application (2020-2032) (USD Billion)
10.4 Asia Pacific
10.4.1 Trends Analysis
10.4.2 Asia Pacific Humectants Chemical Market Estimates and Forecasts, by Country (2020-2032) (USD Billion)
10.4.3 Asia Pacific Humectants Chemical Market Estimates and Forecasts, by Source (2020-2032) (USD Billion)
10.4.4 Asia Pacific Humectants Chemical Market Estimates and Forecasts, by Product (2020-2032) (USD Billion)
10.4.5 Asia Pacific Humectants Chemical Market Estimates and Forecasts, by Application (2020-2032) (USD Billion)
10.4.6 China
10.4.6.1 China Humectants Chemical Market Estimates and Forecasts, by Source (2020-2032) (USD Billion)
10.4.6.2 China Humectants Chemical Market Estimates and Forecasts, by Product (2020-2032) (USD Billion)
10.4.6.3 China Humectants Chemical Market Estimates and Forecasts, by Application (2020-2032) (USD Billion)
10.4.7 India
10.4.7.1 India Humectants Chemical Market Estimates and Forecasts, by Source (2020-2032) (USD Billion)
10.4.7.2 India Humectants Chemical Market Estimates and Forecasts, by Product (2020-2032) (USD Billion)
10.4.7.3 India Humectants Chemical Market Estimates and Forecasts, by Application (2020-2032) (USD Billion)
10.4.8 Japan
10.4.8.1 Japan Humectants Chemical Market Estimates and Forecasts, by Source (2020-2032) (USD Billion)
10.4.8.2 Japan Humectants Chemical Market Estimates and Forecasts, by Product (2020-2032) (USD Billion)
10.4.8.3 Japan Humectants Chemical Market Estimates and Forecasts, by Application (2020-2032) (USD Billion)
10.4.9 South Korea
10.4.9.1 South Korea Humectants Chemical Market Estimates and Forecasts, by Source (2020-2032) (USD Billion)
10.4.9.2 South Korea Humectants Chemical Market Estimates and Forecasts, by Product (2020-2032) (USD Billion)
10.4.9.3 South Korea Humectants Chemical Market Estimates and Forecasts, by Application (2020-2032) (USD Billion)
10.4.10 Vietnam
10.4.10.1 Vietnam Humectants Chemical Market Estimates and Forecasts, by Source (2020-2032) (USD Billion)
10.4.10.2 Vietnam Humectants Chemical Market Estimates and Forecasts, by Product (2020-2032) (USD Billion)
10.4.10.3 Vietnam Humectants Chemical Market Estimates and Forecasts, by Application (2020-2032) (USD Billion)
10.4.11 Singapore
10.4.11.1 Singapore Humectants Chemical Market Estimates and Forecasts, by Source (2020-2032) (USD Billion)
10.4.11.2 Singapore Humectants Chemical Market Estimates and Forecasts, by Product (2020-2032) (USD Billion)
10.4.11.3 Singapore Humectants Chemical Market Estimates and Forecasts, by Application (2020-2032) (USD Billion)
10.4.12 Australia
10.4.12.1 Australia Humectants Chemical Market Estimates and Forecasts, by Source (2020-2032) (USD Billion)
10.4.12.2 Australia Humectants Chemical Market Estimates and Forecasts, by Product (2020-2032) (USD Billion)
10.4.12.3 Australia Humectants Chemical Market Estimates and Forecasts, by Application (2020-2032) (USD Billion)
10.4.13 Rest of Asia Pacific
10.4.13.1 Rest of Asia Pacific Humectants Chemical Market Estimates and Forecasts, by Source (2020-2032) (USD Billion)
10.4.13.2 Rest of Asia Pacific Humectants Chemical Market Estimates and Forecasts, by Product (2020-2032) (USD Billion)
10.4.13.3 Rest of Asia Pacific Humectants Chemical Market Estimates and Forecasts, by Application (2020-2032) (USD Billion)
10.5 Middle East and Africa
10.5.1 Middle East
10.5.1.1 Trends Analysis
10.5.1.2 Middle East Humectants Chemical Market Estimates and Forecasts, by Country (2020-2032) (USD Billion)
10.5.1.3 Middle East Humectants Chemical Market Estimates and Forecasts, by Source (2020-2032) (USD Billion)
10.5.1.4 Middle East Humectants Chemical Market Estimates and Forecasts, by Product (2020-2032) (USD Billion)
10.5.1.5 Middle East Humectants Chemical Market Estimates and Forecasts, by Application (2020-2032) (USD Billion)
10.5.1.6 UAE
10.5.1.6.1 UAE Humectants Chemical Market Estimates and Forecasts, by Source (2020-2032) (USD Billion)
10.5.1.6.2 UAE Humectants Chemical Market Estimates and Forecasts, by Product (2020-2032) (USD Billion)
10.5.1.6.3 UAE Humectants Chemical Market Estimates and Forecasts, by Application (2020-2032) (USD Billion)
10.5.1.7 Egypt
10.5.1.7.1 Egypt Humectants Chemical Market Estimates and Forecasts, by Source (2020-2032) (USD Billion)
10.5.1.7.2 Egypt Humectants Chemical Market Estimates and Forecasts, by Product (2020-2032) (USD Billion)
10.5.1.7.3 Egypt Humectants Chemical Market Estimates and Forecasts, by Application (2020-2032) (USD Billion)
10.5.1.8 Saudi Arabia
10.5.1.8.1 Saudi Arabia Humectants Chemical Market Estimates and Forecasts, by Source (2020-2032) (USD Billion)
10.5.1.8.2 Saudi Arabia Humectants Chemical Market Estimates and Forecasts, by Product (2020-2032) (USD Billion)
10.5.1.8.3 Saudi Arabia Humectants Chemical Market Estimates and Forecasts, by Application (2020-2032) (USD Billion)
10.5.1.9 Qatar
10.5.1.9.1 Qatar Humectants Chemical Market Estimates and Forecasts, by Source (2020-2032) (USD Billion)
10.5.1.9.2 Qatar Humectants Chemical Market Estimates and Forecasts, by Product (2020-2032) (USD Billion)
10.5.1.9.3 Qatar Humectants Chemical Market Estimates and Forecasts, by Application (2020-2032) (USD Billion)
10.5.1.10 Rest of Middle East
10.5.1.10.1 Rest of Middle East Humectants Chemical Market Estimates and Forecasts, by Source (2020-2032) (USD Billion)
10.5.1.10.2 Rest of Middle East Humectants Chemical Market Estimates and Forecasts, by Product (2020-2032) (USD Billion)
10.5.1.10.3 Rest of Middle East Humectants Chemical Market Estimates and Forecasts, by Application (2020-2032) (USD Billion)
10.5.2 Africa
10.5.2.1 Trends Analysis
10.5.2.2 Africa Humectants Chemical Market Estimates and Forecasts, by Country (2020-2032) (USD Billion)
10.5.2.3 Africa Humectants Chemical Market Estimates and Forecasts, by Source (2020-2032) (USD Billion)
10.5.2.4 Africa Humectants Chemical Market Estimates and Forecasts, by Product (2020-2032) (USD Billion)
10.5.2.5 Africa Humectants Chemical Market Estimates and Forecasts, by Application (2020-2032) (USD Billion)
10.5.2.6 South Africa
10.5.2.6.1 South Africa Humectants Chemical Market Estimates and Forecasts, by Source (2020-2032) (USD Billion)
10.5.2.6.2 South Africa Humectants Chemical Market Estimates and Forecasts, by Product (2020-2032) (USD Billion)
10.5.2.6.3 South Africa Humectants Chemical Market Estimates and Forecasts, by Application (2020-2032) (USD Billion)
10.5.2.7 Nigeria
10.5.2.7.1 Nigeria Humectants Chemical Market Estimates and Forecasts, by Source (2020-2032) (USD Billion)
10.5.2.7.2 Nigeria Humectants Chemical Market Estimates and Forecasts, by Product (2020-2032) (USD Billion)
10.5.2.7.3 Nigeria Humectants Chemical Market Estimates and Forecasts, by Application (2020-2032) (USD Billion)
10.5.2.8 Rest of Africa
10.5.2.8.1 Rest of Africa Humectants Chemical Market Estimates and Forecasts, by Source (2020-2032) (USD Billion)
10.5.2.8.2 Rest of Africa Humectants Chemical Market Estimates and Forecasts, by Product (2020-2032) (USD Billion)
10.5.2.8.3 Rest of Africa Humectants Chemical Market Estimates and Forecasts, by Application (2020-2032) (USD Billion)
10.6 Latin America
10.6.1 Trends Analysis
10.6.2 Latin America Humectants Chemical Market Estimates and Forecasts, by Country (2020-2032) (USD Billion)
10.6.3 Latin America Humectants Chemical Market Estimates and Forecasts, by Source (2020-2032) (USD Billion)
10.6.4 Latin America Humectants Chemical Market Estimates and Forecasts, by Product (2020-2032) (USD Billion)
10.6.5 Latin America Humectants Chemical Market Estimates and Forecasts, by Application (2020-2032) (USD Billion)
10.6.6 Brazil
10.6.6.1 Brazil Humectants Chemical Market Estimates and Forecasts, by Source (2020-2032) (USD Billion)
10.6.6.2 Brazil Humectants Chemical Market Estimates and Forecasts, by Product (2020-2032) (USD Billion)
10.6.6.3 Brazil Humectants Chemical Market Estimates and Forecasts, by Application (2020-2032) (USD Billion)
10.6.7 Argentina
10.6.7.1 Argentina Humectants Chemical Market Estimates and Forecasts, by Source (2020-2032) (USD Billion)
10.6.7.2 Argentina Humectants Chemical Market Estimates and Forecasts, by Product (2020-2032) (USD Billion)
10.6.7.3 Argentina Humectants Chemical Market Estimates and Forecasts, by Application (2020-2032) (USD Billion)
10.6.8 Colombia
10.6.8.1 Colombia Humectants Chemical Market Estimates and Forecasts, by Source (2020-2032) (USD Billion)
10.6.8.2 Colombia Humectants Chemical Market Estimates and Forecasts, by Product (2020-2032) (USD Billion)
10.6.8.3 Colombia Humectants Chemical Market Estimates and Forecasts, by Application (2020-2032) (USD Billion)
10.6.9 Rest of Latin America
10.6.9.1 Rest of Latin America Humectants Chemical Market Estimates and Forecasts, by Source (2020-2032) (USD Billion)
10.6.9.2 Rest of Latin America Humectants Chemical Market Estimates and Forecasts, by Product (2020-2032) (USD Billion)
10.6.9.3 Rest of Latin America Humectants Chemical Market Estimates and Forecasts, by Application (2020-2032) (USD Billion)
11. Company Profiles
11.1 Archer Daniel Midland Company
11.1.1 Company Overview
11.1.2 Financial
11.1.3 Product/ Services Offered
11.1.4 SWOT Analysis
11.2 Ashland Global Holdings Inc.
11.2.1 Company Overview
11.2.2 Financial
11.2.3 Product/ Services Offered
11.2.4 SWOT Analysis
11.3 BASF SE
11.3.1 Company Overview
11.3.2 Financial
11.3.3 Product/ Services Offered
11.3.4 SWOT Analysis
11.4 Barentz
11.4.1 Company Overview
11.4.2 Financial
11.4.3 Product/ Services Offered
11.4.4 SWOT Analysis
11.5 Brenntag AG
11.5.1 Company Overview
11.5.2 Financial
11.5.3 Product/ Services Offered
11.5.4 SWOT Analysis
11.6 Cargill Incorporated E.I.
11.6.1 Company Overview
11.6.2 Financial
11.6.3 Product/ Services Offered
11.6.4 SWOT Analysis
11.7 Du Pont De Nemours & Company
11.7.1 Company Overview
11.7.2 Financial
11.7.3 Product/ Services Offered
11.7.4 SWOT Analysis
11.8 Ingredion
11.8.1 Company Overview
11.8.2 Financial
11.8.3 Product/ Services Offered
11.8.4 SWOT Analysis
11.9 Roquette Freres
11.9.1 Company Overview
11.9.2 Financial
11.9.3 Product/ Services Offered
11.9.4 SWOT Analysis
11.10 DOW Chemical Company
11.10.1 Company Overview
11.10.2 Financial
11.10.3 Product/ Services Offered
11.10.4 SWOT Analysis
12. Use Cases and Best Practices
13. Conclusion
An accurate research report requires proper strategizing as well as implementation. There are multiple factors involved in the completion of good and accurate research report and selecting the best methodology to compete the research is the toughest part. Since the research reports we provide play a crucial role in any company’s decision-making process, therefore we at SNS Insider always believe that we should choose the best method which gives us results closer to reality. This allows us to reach at a stage wherein we can provide our clients best and accurate investment to output ratio.
Each report that we prepare takes a timeframe of 350-400 business hours for production. Starting from the selection of titles through a couple of in-depth brain storming session to the final QC process before uploading our titles on our website we dedicate around 350 working hours. The titles are selected based on their current market cap and the foreseen CAGR and growth.
The 5 steps process:
Step 1: Secondary Research:
Secondary Research or Desk Research is as the name suggests is a research process wherein, we collect data through the readily available information. In this process we use various paid and unpaid databases which our team has access to and gather data through the same. This includes examining of listed companies’ annual reports, Journals, SEC filling etc. Apart from this our team has access to various associations across the globe across different industries. Lastly, we have exchange relationships with various university as well as individual libraries.
Step 2: Primary Research
When we talk about primary research, it is a type of study in which the researchers collect relevant data samples directly, rather than relying on previously collected data. This type of research is focused on gaining content specific facts that can be sued to solve specific problems. Since the collected data is fresh and first hand therefore it makes the study more accurate and genuine.
We at SNS Insider have divided Primary Research into 2 parts.
Part 1 wherein we interview the KOLs of major players as well as the upcoming ones across various geographic regions. This allows us to have their view over the market scenario and acts as an important tool to come closer to the accurate market numbers. As many as 45 paid and unpaid primary interviews are taken from both the demand and supply side of the industry to make sure we land at an accurate judgement and analysis of the market.
This step involves the triangulation of data wherein our team analyses the interview transcripts, online survey responses and observation of on filed participants. The below mentioned chart should give a better understanding of the part 1 of the primary interview.
Part 2: In this part of primary research the data collected via secondary research and the part 1 of the primary research is validated with the interviews from individual consultants and subject matter experts.
Consultants are those set of people who have at least 12 years of experience and expertise within the industry whereas Subject Matter Experts are those with at least 15 years of experience behind their back within the same space. The data with the help of two main processes i.e., FGDs (Focused Group Discussions) and IDs (Individual Discussions). This gives us a 3rd party nonbiased primary view of the market scenario making it a more dependable one while collation of the data pointers.
Step 3: Data Bank Validation
Once all the information is collected via primary and secondary sources, we run that information for data validation. At our intelligence centre our research heads track a lot of information related to the market which includes the quarterly reports, the daily stock prices, and other relevant information. Our data bank server gets updated every fortnight and that is how the information which we collected using our primary and secondary information is revalidated in real time.
Step 4: QA/QC Process
After all the data collection and validation our team does a final level of quality check and quality assurance to get rid of any unwanted or undesired mistakes. This might include but not limited to getting rid of the any typos, duplication of numbers or missing of any important information. The people involved in this process include technical content writers, research heads and graphics people. Once this process is completed the title gets uploader on our platform for our clients to read it.
Step 5: Final QC/QA Process:
This is the last process and comes when the client has ordered the study. In this process a final QA/QC is done before the study is emailed to the client. Since we believe in giving our clients a good experience of our research studies, therefore, to make sure that we do not lack at our end in any way humanly possible we do a final round of quality check and then dispatch the study to the client.
Key Segments:
By Source
Synthetic
Natural
By Product
Sugar Alcohol
Alpha Hydroxy Acid
Glycols
Others
By Application
Food & Beverage
Oral & Personal Care
Pharmaceutical
Other
Request for Segment Customization as per your Business Requirement: Segment Customization Request
Regional Coverage:
North America
US
Canada
Mexico
Europe
Eastern Europe
Poland
Romania
Hungary
Turkey
Rest of Eastern Europe
Western Europe
Germany
France
UK
Italy
Spain
Netherlands
Switzerland
Austria
Rest of Western Europe
Asia Pacific
China
India
Japan
South Korea
Vietnam
Singapore
Australia
Rest of Asia Pacific
Middle East & Africa
Middle East
UAE
Egypt
Saudi Arabia
Qatar
Rest of Middle East
Africa
Nigeria
South Africa
Rest of Africa
Latin America
Brazil
Argentina
Colombia
Rest of Latin America
Request for Country Level Research Report: Country Level Customization Request
Available Customization
With the given market data, SNS Insider offers customization as per the company’s specific needs. The following customization options are available for the report:
Product Analysis
Criss-Cross segment analysis (e.g. Product X Application)
Product Matrix which gives a detailed comparison of the product portfolio of each company
Geographic Analysis
Additional countries in any of the regions
Company Information
Detailed analysis and profiling of additional market players (Up to five)
The Composite Resin Market Size was USD 24.62 billion in 2023 & is expected to reach USD 41.74 billion by 2032 & grow at a CAGR of 6.04% by 2024-2032.
UV Curable Coatings Market size was USD 8.21 Billion in 2023 and is expected to reach USD 20.94 Billion by 2032, growing at a CAGR of 10.97% from 2024-2032.
The Butyl Rubber Market size was valued at USD 3.9 Billion in 2023. It is expected to grow to USD 6.9 Bn by 2032 and grow at a CAGR of 6.3% by 2024-2032.
The Nanochemicals Market was worth USD 6.26 billion in 2023 and is expected to grow to USD 10.99 billion by 2032, with a CAGR of 6.45% % in the forecast period 2024-2032.
The Fluoropolymer Tubing Market Size was USD 555.3 Million in 2023 and is expected to reach USD 892.9 Mn by 2032 and grow at a CAGR of 5.4% by 2024-2032.
Honeycomb Sandwich Material Market Size and Segments By Material Type (Aluminum, Steel, Composites, Titanium, Inconel, Others), By Technology (Expansion, Corrugation, Molding, Extrusion, Others), By Application and by Regions | Global Market Forecast 2024
Hi! Click one of our member below to chat on Phone