image

HOLOGRAPHIC DISPLAY MARKET KEY INSIGHTS:

Holographic Display Market Revenue Analysis

To Get More Information on Holographic Display Market - Request Sample Report

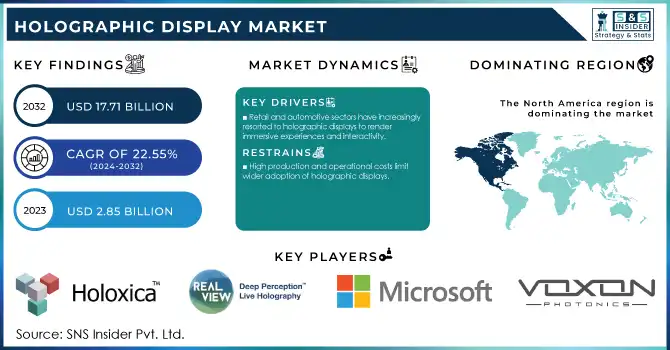
The Holographic Display Market Size was valued at USD 2.85 Billion in 2023 and is expected to reach USD 17.71 Billion by 2032 and grow at a CAGR of 22.55% over the forecast period 2024-2032.
The Holographic Display Market had been seeing much momentum lately due to technological innovations and increased interest in the sector worldwide. Increasingly, the technology found applications across industries in the healthcare, automotive, and consumer electronics industries. Japan and China certainly emerged as great players in developing and adopting holographic technology, backed by strong tech ecosystems. In the US, the growth continued to be strong with huge investments in research and applications in medical imaging and augmented reality. In the region, France and Germany primarily took the lead in advancing market expansion through government-driven initiatives in advanced display technologies. It can be seen that this country has enormously upped the demand for holographic displays - both in education and medical imaging - primarily due to increasing growth in its tech industry and, of course, support from the government for advancements in digital technology.

Holographic displays are constantly being rewritten with advancing technology. For example, researchers at Princeton University and Meta have developed a miniature optical device that provides magnification for the hologram while clearing out details. This device, small enough to hang on a pair of spectacles, could change immersion in virtual reality. Besides this, 3D projection with lasers and full colour laser holography have provided unprecedented levels of visual fidelity in displays and depth perception: in 2023-2024 high-definition holographic medical imaging monitoring has been launched, aiming to improve the accuracy for diagnosis and surgical planning. A Norwegian health-tech start up, HoloCare is scaling the commercial footprint across the UK and Europe as it has obtained the UKCA and CE Certification. This mixed reality and AI-powered platform will first be launched in five hospitals and used for pre-surgical planning support. The software creates interactive 3D Holograms of an individual patient's organ, enabling surgeons to precisely plan and personalize surgeries according to their unique anatomy.

The future is bright for the holographic display market, especially in automotive applications, where heads-up displays enhance safety and navigation. Other areas are equally crucial, such as medical, where holographic imaging enhances visualization of complex surgeries and results in better patient outcomes. Studies show this potential, especially with Society 5.0 in Japan and the integration of advanced holography into China's technological growth. These trends then form a perfect foundation for continued growth through 2024 and beyond.

MARKET DYNAMICS

KEY DRIVERS:  

  • Retail and automotive sectors have increasingly resorted to holographic displays to render immersive experiences and interactivity.

In 2023, most of high-end automotive showrooms worldwide embraced holographic technology to enhance visualization. This trend is fuelled by the fact that it can display highly detailed three-dimensional views of products, increasing higher consumer interest and engagement. Retailers can profit from product presentation in dynamic form because of improvements in conversion rates. Innovation programs run by the government and industry push it even further, displaying the potential that holographic displays can provide in changing the customer experience.

  • Advancements in medical imaging are driving adoption in healthcare; already more than half of the hospitals used them in 2023.

One of the strong adopters of holographic display technology is in the healthcare industry; its utilization rate in major hospitals is more than 50% by 2023. Holographic imaging has significant benefits for complex medical diagnostics, surgical planning, and training. In Japan, several AI-based medical applications have been developed and commercialized to improve diagnostics and patient care. For instance, an advanced visualization and analysis software for medical imaging is offered by Japanese firm Ziosoft. Their solution includes advanced visualization in 3D, 4D, and 5D for CT, MRI, and modalities allows for enhanced visualization and quantification of anatomical structures. In contrast to other conventional 2D imaging, holograms provide a view of 3D which allows anatomical structures to be better assessed by medical professionals. The push for precision medicine and the continued emphasis on improving patient outcomes will further boost demand for holographic displays in 2024. Clear support from government health departments advocating for cutting-edge imaging solutions reinforces the demand for healthcare policies that look to advance technology-driven measures.

RESTRAIN:

  • High production and operational costs limit wider adoption of holographic displays.

The holographic display technology solely relies on sophisticated components such as light modulators, lenses, and digital micrometers which only require specialized manufacturing processes, making the technology very costly. As a result, it is a very costly investment for industries to take on holographic displays, especially for SMEs. Apart from this, the updating and maintenance also involve training and technical expertise that enhances the operation cost.

However, such advanced technology can only be deployed by more prominent organizations such as automobile and healthcare companies, but other smaller players may not be able to justify the installation cost. Government funding and industry partnerships will assist in these expenses but probably be justified only if fully implemented with additional developments that make the overall production cost cheaper.

KEY SEGMENTATION ANALYSIS

BY DIMENSION

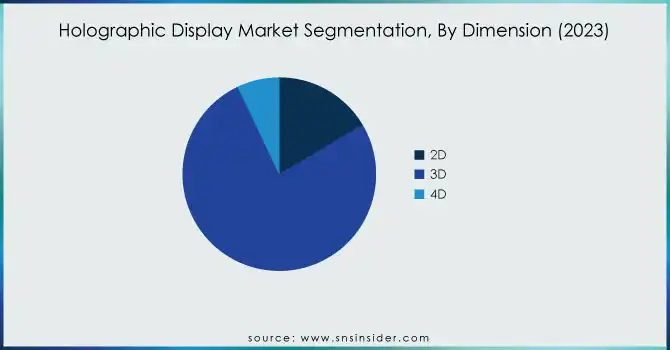
In 2023, the majority were 3D display applications accounting for 76%. Three-dimensional dominance is because 3D technology is very commonly used in various fields, such as advertising, entertainment, and medical imaging, where three-dimensional visualizations provide a better depth of view and interactive capabilities. The point of 3D is that it creates lifelike, immersive experiences, which find great applications in enhanced visualization-based requirements.

However, growth for 4D display including time and motion is expected to skyrocket at the highest CAGR of 25.81% during 2024-2032. That is because higher immersive experience is expected in virtual and augmented reality applications with 4D, as it interacts more and engages more compared to 3D.
 

Holographic-Display-Market-Segmentation-By-Dimension

Do You Need any Customization Research on Holographic Display Market - Inquire Now

BY COMPONENT

In 2023, the component with the highest market share was the Lens with 76% because it is used as a medium for focusing and focusing the light to form sharp and high-quality holographic images. These involve smaller sizes that are to be used either in large displays or consumer electronic devices, necessitating the utilization of lenses in the overall application of the device, thus making it very extensive.

Digital Micrometers shall lead in growth with 23.83% CAGR from 2024 to 2032 due to further innovations in microfabrication and precision engineering, with the improvements observed to make holographic displays better at resolution and quality. The integration of digital micrometers enables finer control over the output of the display for supporting high-resolution medical imaging and other high-precision applications.

REGIONAL ANALYSIS

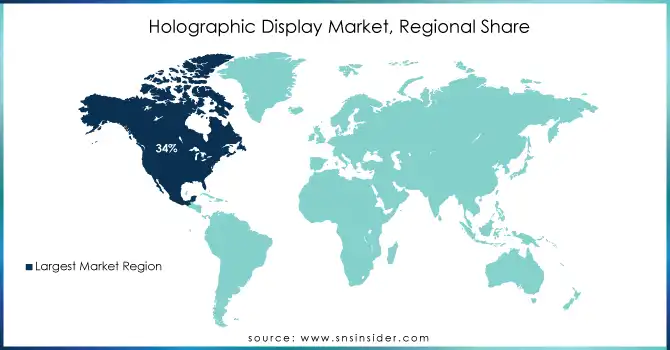
North America held the highest share of 34% in the holographic display market in 2023. This can be explained by the strong infrastructure in terms of technology in the region, a high adoption rate in sectors such as healthcare and entertainment, and continuous investments in research and development. In addition, the presence of leading companies and research institutions further supported the growth in this market.

The Asia Pacific region would grow at the fastest rate, during the forecast period of 2024 to 2032, at a CAGR of around 23.30%. Support for the growth is obtained through rapid development in technology, strong support through innovation from the government, and increases in demands for advanced display technology in countries such as China, Japan, and India. Such national policies in these countries to support immersive technologies include offering incentives for the adoption of technology and investments in R&D.
Holographic-Display-Market-Regional-Share

KEY PLAYERS 

Some of the major players in the Holographic Display Market are  

  • Holoxica Ltd (Holographic medical displays, Holographic 3D maps)

  • RealView Imaging Ltd (Holographic imaging system, Surgical holography solutions)

  • Musion 3D Ltd (Holographic stage performances, 3D projection systems)

  • Looking Glass Factory Inc. (Holographic desktop displays, 3D visualization software)

  • Provision Interactive Technologies Inc. (Holographic kiosks, 3D advertising displays)

  • HYPERVSN (Holographic display units, 3D projection hardware)

  • Leia Inc. (Holographic smartphone screens, Lightfield displays)

  • Zebra Imaging Inc. (3D holographic prints, Holographic mapping solutions)

  • AV Concepts (Event holography, Holographic projection services)

  • Microsoft Corporation (HoloLens, Mixed reality headsets)

  • Sony Corporation (Holographic displays, 3D visualization tools)

  • Samsung Electronics Co., Ltd. (Holographic display panels, Advanced display technology)

  • Voxon Photonics (3D volumetric displays, Holographic video systems)

  • Ostendo Technologies, Inc. (Holographic display technology, Quantum photonics)

  • Realfiction Holdings AB (Mixed reality displays, Holographic storytelling solutions)

  • MDH Hologram (Holographic event technology, Digital holographic projection)

  • LitiHolo (DIY holography kits, Educational holographic products)

  • Dynavision Corporation (Holographic advertising displays, 3D projection solutions)

  • Qualcomm Technologies, Inc. (Holographic processors, 5G-integrated holographic components)

  • VividQ Ltd (Holographic display software, Holographic visual solutions)

MAJOR SUPPLIERS (Components, Technologies)

  • Corning Incorporated (Optical glass, Advanced display materials)

  • 3M Company (Reflective films, Light management solutions)

  • Dow Inc. (Adhesives, Coating materials)

  • Merck KGaA (Liquid crystals, Display materials)

  • Sumitomo Chemical Co., Ltd. (Optoelectronic materials, Specialty chemicals)

  • Nitto Denko Corporation (Polarizing films, Display components)

  • Shin-Etsu Chemical Co., Ltd. (Silicon products, Display-grade chemicals)

  • Asahi Glass Co., Ltd. (AGC Inc.) (Glass substrates, Display materials)

  • LG Chem Ltd. (Display films, Optical materials)

  • JNC Corporation (Liquid crystal materials, Electronic components)

MAJOR CLIENTS

  • Medical centers and hospitals (e.g., Mayo Clinic, Cleveland Clinic)

  • Automotive manufacturers (e.g., Tesla, BMW)

  • Tech giants (e.g., Apple, Google)

  • Retailers (e.g., Walmart, Target)

  • Event and entertainment companies (e.g., Live Nation, Cirque du Soleil)

  • Defense and military contractors (e.g., Raytheon, Lockheed Martin)

  • Educational institutions (e.g., Harvard University, MIT)

  • Advertising agencies (e.g., WPP, Publicis Groupe)

  • Research organizations (e.g., Fraunhofer Institute, R&D labs)

  • Architectural firms (e.g., Foster + Partners, Gensler)

RECENT TRENDS

  • September 2024: Hyudai Mobis is reportedly going to replace the screens in your car with holographic projections on the windshield. For this to happen, Hyundai will be in close collaboration with Zeiss, and this may go into mass production from early 2027. This will involve a high-tech projector and a thin film that would be applied to the windshield.

  • August 2024: Developer in the field of computational Holography Display Technology, VividQ, has completed another USD 7.5 million in Series A funding. The funding rounds bring the company's total amount raised to over USD 30 million. The funding will support the opening of the U.S., which will be operated as an office, as well as the company's product development roadmap, including expanding the availability of the technology to existing and new global business partners.

Holographic Display Market Report Scope:

Report Attributes Details
Market Size in 2023 USD 2.85 Billion 
Market Size by 2032 USD 17.71 Billion 
CAGR CAGR of 22.55% From 2024 to 2032
Base Year 2023
Forecast Period 2024-2032
Historical Data 2020-2022
Report Scope & Coverage Market Size, Segments Analysis, Competitive  Landscape, Regional Analysis, DROC & SWOT Analysis, Forecast Outlook
Key Segments • By Industry Vertical (Pharmaceutical & Biotechnology Companies, Research Organizations, Academic Medical Centers, Hospitals, Consumer Electronics, Automotive, Retail, Entertainment and Media, Aerospace and Defense),
• By Technology (Electro-holographic, Touchable, Laser, Piston),
• By Dimension (2D, 3D, 4D),
• By Application (Camera, Digital Signage, Medical Imaging, CT & MRI, Smart TV, Laptops),
• By Component (Light Modulator, Scanners, Lens, Digital Micrometer, Monitor)
Regional Analysis/Coverage North America (US, Canada, Mexico), Europe (Eastern Europe [Poland, Romania, Hungary, Turkey, Rest of Eastern Europe] Western Europe] Germany, France, UK, Italy, Spain, Netherlands, Switzerland, Austria, Rest of Western Europe]), Asia Pacific (China, India, Japan, South Korea, Vietnam, Singapore, Australia, Rest of Asia Pacific), Middle East & Africa (Middle East [UAE, Egypt, Saudi Arabia, Qatar, Rest of Middle East], Africa [Nigeria, South Africa, Rest of Africa], Latin America (Brazil, Argentina, Colombia, Rest of Latin America)
Company Profiles Holoxica Ltd, RealView Imaging Ltd, Musion 3D Ltd, Looking Glass Factory Inc., Provision Interactive Technologies Inc., HYPERVSN, Leia Inc., Zebra Imaging Inc., AV Concepts, Microsoft Corporation, Sony Corporation, Samsung Electronics Co., Ltd., Voxon Photonics, Ostendo Technologies, Inc., Realfiction Holdings AB, MDH Hologram, LitiHolo, Dynavision Corporation, Qualcomm Technologies, Inc., VividQ Ltd.
Key Drivers • Retail and automotive sectors have increasingly resorted to holographic displays to render immersive experiences and interactivity.
• Advancements in medical imaging are driving adoption in healthcare; already more than half of the hospitals used them in 2023. 
Restraints • High production and operational costs limit wider adoption of holographic displays. 

Frequently Asked Questions

Ans: The Holographic Display Market is expected to grow at a CAGR of 22.55% during 2024-2032.

Ans: Holographic Display Market size was USD 2.85 Billion in 2023 and is expected to Reach USD USD 17.71 Billion by 2032.

Ans: The major growth factors of the Holographic Display Market are Advancements in Medical Imaging and High Adoption by Retail and Automotive Sectors.

Ans: The 3D segment dominated the Holographic Display Market.

Ans: North America dominated the Holographic Display Market in 2023.

TABLE OF CONTENTS

1. Introduction

1.1 Market Definition

1.2 Scope (Inclusion and Exclusions)

1.3 Research Assumptions

2. Executive Summary

2.1 Market Overview

2.2 Regional Synopsis

2.3 Competitive Summary

3. Research Methodology

3.1 Top-Down Approach

3.2 Bottom-up Approach

3.3. Data Validation

3.4 Primary Interviews

4. Market Dynamics Impact Analysis

4.1 Market Driving Factors Analysis

4.1.1 Drivers

4.1.2 Restraints

4.1.3 Opportunities

4.1.4 Challenges

4.2 PESTLE Analysis

4.3 Porter’s Five Forces Model

5. Statistical Insights and Trends Reporting

5.1 Production Volumes, by Region (2023)

5.2 Chip Design Trends (Historic and Future)

5.3 Fab Capacity Utilization (2023)

5.4 Supply Chain Metrics

6. Competitive Landscape

6.1 List of Major Companies, By Region

6.2 Market Share Analysis, By Region

6.3 Product Benchmarking

6.3.1 Product specifications and features

6.3.2 Pricing

6.4 Strategic Initiatives

6.4.1 Marketing and promotional activities

6.4.2 Distribution and supply chain strategies

6.4.3 Expansion plans and new product launches

6.4.4 Strategic partnerships and collaborations

6.5 Technological Advancements

6.6 Market Positioning and Branding

7. Holographic Display Market Segmentation, By Industry Vertical

7.1 Chapter Overview

7.2 Pharmaceutical & Biotechnology Companies

7.2.1 Pharmaceutical & Biotechnology Companies Market Trends Analysis (2020-2032)

7.2.2 Pharmaceutical & Biotechnology Companies Market Size Estimates and Forecasts to 2032 (USD Billion)

7.3 Research Organizations

7.3.1 Research Organizations Market Trends Analysis (2020-2032)

7.3.2 Research Organizations Market Size Estimates and Forecasts to 2032 (USD Billion)

7.4 Academic Medical Centers

7.4.1 Academic Medical Centers Market Trends Analysis (2020-2032)

7.4.2 Academic Medical Centers Market Size Estimates and Forecasts to 2032 (USD Billion)

7.5 Hospitals

7.5.1 Hospitals Market Trends Analysis (2020-2032)

7.5.2 Hospitals Market Size Estimates and Forecasts to 2032 (USD Billion)

7.6 Consumer Electronics

7.6.1 Consumer Electronics Market Trends Analysis (2020-2032)

7.6.2 Consumer Electronics Market Size Estimates and Forecasts to 2032 (USD Billion)

7.7 Automotive

7.7.1 Automotive Market Trends Analysis (2020-2032)

7.7.2 Automotive Market Size Estimates and Forecasts to 2032 (USD Billion)

7.8 Retail

7.8.1 Retail Market Trends Analysis (2020-2032)

7.8.2 Retail Market Size Estimates and Forecasts to 2032 (USD Billion)

7.9 Entertainment and Media

7.9.1 Entertainment and Media Market Trends Analysis (2020-2032)

7.9.2 Entertainment and Media Market Size Estimates and Forecasts to 2032 (USD Billion)

7.10 Aerospace and Defense

7.10.1 Aerospace and Defense Market Trends Analysis (2020-2032)

7.10.2 Aerospace and Defense Market Size Estimates and Forecasts to 2032 (USD Billion)

8. Holographic Display Market Segmentation, By Technology

8.1 Chapter Overview

8.2 Electro-holographic

8.2.1 Electro-holographic Market Trends Analysis (2020-2032)

8.2.2 Electro-holographic Market Size Estimates And Forecasts To 2032 (USD Billion)

8.3 Touchable

8.3.1 Touchable Market Trends Analysis (2020-2032)

8.3.2 Touchable Market Size Estimates And Forecasts To 2032 (USD Billion)

8.4 Laser

8.4.1 Laser Market Trends Analysis (2020-2032)

8.4.2 Laser Market Size Estimates And Forecasts To 2032 (USD Billion)

8.5 Piston

8.5.1 Piston Market Trends Analysis (2020-2032)

8.5.2 Piston Market Size Estimates And Forecasts To 2032 (USD Billion)

9. Holographic Display Market Segmentation, By Dimension

9.1 Chapter Overview

9.2 2D

9.2.1 2D Market Trends Analysis (2020-2032)

9.2.2 2D Market Size Estimates And Forecasts To 2032 (USD Billion)

9.3 3D

9.3.1 3D Market Trends Analysis (2020-2032)

9.3.2 3D Market Size Estimates And Forecasts To 2032 (USD Billion)

9.4 4D

9.4.1 4D Market Trends Analysis (2020-2032)

9.4.2 4D Market Size Estimates And Forecasts To 2032 (USD Billion)

10. Holographic Display Market Segmentation, By Application

10.1 Chapter Overview

10.2 Camera

10.2.1 Camera Market Trends Analysis (2020-2032)

10.2.2 Camera Market Size Estimates And Forecasts To 2032 (USD Billion)

10.3 Digital Signage

10.3.1 Digital Signage Market Trends Analysis (2020-2032)

10.3.2 Digital Signage Market Size Estimates And Forecasts To 2032 (USD Billion)

10.4 Medical Imaging

10.4.1 Medical Imaging Market Trends Analysis (2020-2032)

10.4.2 Medical Imaging Market Size Estimates And Forecasts To 2032 (USD Billion)

10.5 CT & MRI

10.5.1 CT & MRI Market Trends Analysis (2020-2032)

10.5.2 CT & MRI Market Size Estimates And Forecasts To 2032 (USD Billion)

10.6 Smart TV

10.6.1 Smart TV Market Trends Analysis (2020-2032)

10.6.2 Smart TV Market Size Estimates And Forecasts To 2032 (USD Billion)

10.7 Laptops

10.7.1 Laptops Market Trends Analysis (2020-2032)

10.7.2 Laptops Market Size Estimates And Forecasts To 2032 (USD Billion)

11. Holographic Display Market Segmentation, By Component

11.1 Chapter Overview

11.2 Light Modulator

11.2.1 Light Modulator Market Trends Analysis (2020-2032)

11.2.2 Light Modulator Market Size Estimates And Forecasts To 2032 (USD Billion)

11.3 Scanners

11.3.1 Scanners Market Trends Analysis (2020-2032)

11.3.2 Scanners Market Size Estimates And Forecasts To 2032 (USD Billion)

11.4 Lens

11.4.1 Lens Market Trends Analysis (2020-2032)

11.4.2 Lens Market Size Estimates And Forecasts To 2032 (USD Billion)

11.5 Digital Micrometer

11.5.1 Digital Micrometer Market Trends Analysis (2020-2032)

11.5.2 Digital Micrometer Market Size Estimates And Forecasts To 2032 (USD Billion)

11.6 Monitor

11.6.1 Monitor Market Trends Analysis (2020-2032)

11.6.2 Monitor Market Size Estimates And Forecasts To 2032 (USD Billion)

12. Regional Analysis

12.1 Chapter Overview

12.2 North America

12.2.1 Trends Analysis

12.2.2 North America Holographic Display Market Estimates And Forecasts, By Country (2020-2032) (USD Billion)

12.2.3 North America Holographic Display Market Estimates And Forecasts, By Industry Vertical (2020-2032) (USD Billion)

12.2.4 North America Holographic Display Market Estimates And Forecasts, By Technology (2020-2032) (USD Billion)

12.2.5 North America Holographic Display Market Estimates And Forecasts, By Dimension (2020-2032) (USD Billion)

12.2.6 North America Holographic Display Market Estimates And Forecasts, By Application (2020-2032) (USD Billion)

12.2.7 North America Holographic Display Market Estimates And Forecasts, By Component (2020-2032) (USD Billion)

12.2.8 USA

12.2.8.1 USA Holographic Display Market Estimates And Forecasts, By Industry Vertical (2020-2032) (USD Billion)

12.2.8.2 USA Holographic Display Market Estimates And Forecasts, By Technology (2020-2032) (USD Billion)

12.2.8.3 USA Holographic Display Market Estimates And Forecasts, By Dimension (2020-2032) (USD Billion)

12.2.8.4 USA Holographic Display Market Estimates And Forecasts, By Application (2020-2032) (USD Billion)

12.2.8.5 USA Holographic Display Market Estimates And Forecasts, By Component (2020-2032) (USD Billion)

12.2.9 Canada

12.2.9.1 Canada Holographic Display Market Estimates And Forecasts, By Industry Vertical (2020-2032) (USD Billion)

12.2.9.2 Canada Holographic Display Market Estimates And Forecasts, By Technology (2020-2032) (USD Billion)

12.2.9.3 Canada Holographic Display Market Estimates And Forecasts, By Dimension (2020-2032) (USD Billion)

12.2.9.4 Canada Holographic Display Market Estimates And Forecasts, By Application (2020-2032) (USD Billion)

12.2.9.5 Canada Holographic Display Market Estimates And Forecasts, By Component (2020-2032) (USD Billion)

12.2.10 Mexico

12.2.10.1 Mexico Holographic Display Market Estimates And Forecasts, By Industry Vertical (2020-2032) (USD Billion)

12.2.10.2 Mexico Holographic Display Market Estimates And Forecasts, By Technology (2020-2032) (USD Billion)

12.2.10.3 Mexico Holographic Display Market Estimates And Forecasts, By Dimension (2020-2032) (USD Billion)

12.2.10.4 Mexico Holographic Display Market Estimates And Forecasts, By Application (2020-2032) (USD Billion)

12.2.10.5 Mexico Holographic Display Market Estimates And Forecasts, By Component (2020-2032) (USD Billion)

12.3 Europe

12.3.1 Eastern Europe

12.3.1.1 Trends Analysis

12.3.1.2 Eastern Europe Holographic Display Market Estimates And Forecasts, By Country (2020-2032) (USD Billion)

12.3.1.3 Eastern Europe Holographic Display Market Estimates And Forecasts, By Industry Vertical (2020-2032) (USD Billion)

12.3.1.4 Eastern Europe Holographic Display Market Estimates And Forecasts, By Technology (2020-2032) (USD Billion)

12.3.1.5 Eastern Europe Holographic Display Market Estimates And Forecasts, By Dimension (2020-2032) (USD Billion)

12.3.1.6 Eastern Europe Holographic Display Market Estimates And Forecasts, By Application (2020-2032) (USD Billion)

12.3.1.7 Eastern Europe Holographic Display Market Estimates And Forecasts, By Component (2020-2032) (USD Billion)

12.3.1.8 Poland

12.3.1.8.1 Poland Holographic Display Market Estimates And Forecasts, By Industry Vertical (2020-2032) (USD Billion)

12.3.1.8.2 Poland Holographic Display Market Estimates And Forecasts, By Technology (2020-2032) (USD Billion)

12.3.1.8.3 Poland Holographic Display Market Estimates And Forecasts, By Dimension (2020-2032) (USD Billion)

12.3.1.8.4 Poland Holographic Display Market Estimates And Forecasts, By Application (2020-2032) (USD Billion)

12.3.1.8.5 Poland Holographic Display Market Estimates And Forecasts, By Component (2020-2032) (USD Billion)

12.3.1.9 Romania

12.3.1.9.1 Romania Holographic Display Market Estimates And Forecasts, By Industry Vertical (2020-2032) (USD Billion)

12.3.1.9.2 Romania Holographic Display Market Estimates And Forecasts, By Technology (2020-2032) (USD Billion)

12.3.1.9.3 Romania Holographic Display Market Estimates And Forecasts, By Dimension (2020-2032) (USD Billion)

12.3.1.9.4 Romania Holographic Display Market Estimates And Forecasts, By Application (2020-2032) (USD Billion)

12.3.1.9.5 Romania Holographic Display Market Estimates And Forecasts, By Component (2020-2032) (USD Billion)

12.3.1.10 Hungary

12.3.1.10.1 Hungary Holographic Display Market Estimates And Forecasts, By Industry Vertical (2020-2032) (USD Billion)

12.3.1.10.2 Hungary Holographic Display Market Estimates And Forecasts, By Technology (2020-2032) (USD Billion)

12.3.1.10.3 Hungary Holographic Display Market Estimates And Forecasts, By Dimension (2020-2032) (USD Billion)

12.3.1.10.4 Hungary Holographic Display Market Estimates And Forecasts, By Application (2020-2032) (USD Billion)

12.3.1.10.5 Hungary Holographic Display Market Estimates And Forecasts, By Component (2020-2032) (USD Billion)

12.3.1.11 Turkey

12.3.1.11.1 Turkey Holographic Display Market Estimates And Forecasts, By Industry Vertical (2020-2032) (USD Billion)

12.3.1.11.2 Turkey Holographic Display Market Estimates And Forecasts, By Technology (2020-2032) (USD Billion)

12.3.1.11.3 Turkey Holographic Display Market Estimates And Forecasts, By Dimension (2020-2032) (USD Billion)

12.3.1.11.4 Turkey Holographic Display Market Estimates And Forecasts, By Application (2020-2032) (USD Billion)

12.3.1.11.5 Turkey Holographic Display Market Estimates And Forecasts, By Component (2020-2032) (USD Billion)

12.3.1.12 Rest Of Eastern Europe

12.3.1.12.1 Rest Of Eastern Europe Holographic Display Market Estimates And Forecasts, By Industry Vertical (2020-2032) (USD Billion)

12.3.1.12.2 Rest Of Eastern Europe Holographic Display Market Estimates And Forecasts, By Technology (2020-2032) (USD Billion)

12.3.1.12.3 Rest Of Eastern Europe Holographic Display Market Estimates And Forecasts, By Dimension (2020-2032) (USD Billion)

12.3.1.12.4 Rest Of Eastern Europe Holographic Display Market Estimates And Forecasts, By Application (2020-2032) (USD Billion)

12.3.1.12.5 Rest Of Eastern Europe Holographic Display Market Estimates And Forecasts, By Component (2020-2032) (USD Billion)

12.3.2 Western Europe

12.3.2.1 Trends Analysis

12.3.2.2 Western Europe Holographic Display Market Estimates And Forecasts, By Country (2020-2032) (USD Billion)

12.3.2.3 Western Europe Holographic Display Market Estimates And Forecasts, By Industry Vertical (2020-2032) (USD Billion)

12.3.2.4 Western Europe Holographic Display Market Estimates And Forecasts, By Technology (2020-2032) (USD Billion)

12.3.2.5 Western Europe Holographic Display Market Estimates And Forecasts, By Dimension (2020-2032) (USD Billion)

12.3.2.6 Western Europe Holographic Display Market Estimates And Forecasts, By Application (2020-2032) (USD Billion)

12.3.2.7 Western Europe Holographic Display Market Estimates And Forecasts, By Component (2020-2032) (USD Billion)

12.3.2.8 Germany

12.3.2.8.1 Germany Holographic Display Market Estimates And Forecasts, By Industry Vertical (2020-2032) (USD Billion)

12.3.2.8.2 Germany Holographic Display Market Estimates And Forecasts, By Technology (2020-2032) (USD Billion)

12.3.2.8.3 Germany Holographic Display Market Estimates And Forecasts, By Dimension (2020-2032) (USD Billion)

12.3.2.8.4 Germany Holographic Display Market Estimates And Forecasts, By Application (2020-2032) (USD Billion)

12.3.2.8.5 Germany Holographic Display Market Estimates And Forecasts, By Component (2020-2032) (USD Billion)

12.3.2.9 France

12.3.2.9.1 France Holographic Display Market Estimates And Forecasts, By Industry Vertical (2020-2032) (USD Billion)

12.3.2.9.2 France Holographic Display Market Estimates And Forecasts, By Technology (2020-2032) (USD Billion)

12.3.2.9.3 France Holographic Display Market Estimates And Forecasts, By Dimension (2020-2032) (USD Billion)

12.3.2.9.4 France Holographic Display Market Estimates And Forecasts, By Application (2020-2032) (USD Billion)

12.3.2.9.5 France Holographic Display Market Estimates And Forecasts, By Component (2020-2032) (USD Billion)

12.3.2.10 UK

12.3.2.10.1 UK Holographic Display Market Estimates And Forecasts, By Industry Vertical (2020-2032) (USD Billion)

12.3.2.10.2 UK Holographic Display Market Estimates And Forecasts, By Technology (2020-2032) (USD Billion)

12.3.2.10.3 UK Holographic Display Market Estimates And Forecasts, By Dimension (2020-2032) (USD Billion)

12.3.2.10.4 UK Holographic Display Market Estimates And Forecasts, By Application (2020-2032) (USD Billion)

12.3.2.10.5 UK Holographic Display Market Estimates And Forecasts, By Component (2020-2032) (USD Billion)

12.3.2.11 Italy

12.3.2.11.1 Italy Holographic Display Market Estimates And Forecasts, By Industry Vertical (2020-2032) (USD Billion)

12.3.2.11.2 Italy Holographic Display Market Estimates And Forecasts, By Technology (2020-2032) (USD Billion)

12.3.2.11.3 Italy Holographic Display Market Estimates And Forecasts, By Dimension (2020-2032) (USD Billion)

12.3.2.11.4 Italy Holographic Display Market Estimates And Forecasts, By Application (2020-2032) (USD Billion)

12.3.2.11.5 Italy Holographic Display Market Estimates And Forecasts, By Component (2020-2032) (USD Billion)

12.3.2.12 Spain

12.3.2.12.1 Spain Holographic Display Market Estimates And Forecasts, By Industry Vertical (2020-2032) (USD Billion)

12.3.2.12.2 Spain Holographic Display Market Estimates And Forecasts, By Technology (2020-2032) (USD Billion)

12.3.2.12.3 Spain Holographic Display Market Estimates And Forecasts, By Dimension (2020-2032) (USD Billion)

12.3.2.12.4 Spain Holographic Display Market Estimates And Forecasts, By Application (2020-2032) (USD Billion)

12.3.2.12.5 Spain Holographic Display Market Estimates And Forecasts, By Component (2020-2032) (USD Billion)

12.3.2.13 Netherlands

12.3.2.13.1 Netherlands Holographic Display Market Estimates And Forecasts, By Industry Vertical (2020-2032) (USD Billion)

12.3.2.13.2 Netherlands Holographic Display Market Estimates And Forecasts, By Technology (2020-2032) (USD Billion)

12.3.2.13.3 Netherlands Holographic Display Market Estimates And Forecasts, By Dimension (2020-2032) (USD Billion)

12.3.2.13.4 Netherlands Holographic Display Market Estimates And Forecasts, By Application (2020-2032) (USD Billion)

12.3.2.13.5 Netherlands Holographic Display Market Estimates And Forecasts, By Component (2020-2032) (USD Billion)

12.3.2.14 Switzerland

12.3.2.14.1 Switzerland Holographic Display Market Estimates And Forecasts, By Industry Vertical (2020-2032) (USD Billion)

12.3.2.14.2 Switzerland Holographic Display Market Estimates And Forecasts, By Technology (2020-2032) (USD Billion)

12.3.2.14.3 Switzerland Holographic Display Market Estimates And Forecasts, By Dimension (2020-2032) (USD Billion)

12.3.2.14.4 Switzerland Holographic Display Market Estimates And Forecasts, By Application (2020-2032) (USD Billion)

12.3.2.12.5 Switzerland Holographic Display Market Estimates And Forecasts, By Component (2020-2032) (USD Billion)

12.3.2.15 Austria

12.3.2.15.1 Austria Holographic Display Market Estimates And Forecasts, By Industry Vertical (2020-2032) (USD Billion)

12.3.2.15.2 Austria Holographic Display Market Estimates And Forecasts, By Technology (2020-2032) (USD Billion)

12.3.2.15.3 Austria Holographic Display Market Estimates And Forecasts, By Dimension (2020-2032) (USD Billion)

12.3.2.15.4 Austria Holographic Display Market Estimates And Forecasts, By Application (2020-2032) (USD Billion)

12.3.2.15.5 Austria Holographic Display Market Estimates And Forecasts, By Component (2020-2032) (USD Billion)

12.3.2.16 Rest Of Western Europe

12.3.2.16.1 Rest Of Western Europe Holographic Display Market Estimates And Forecasts, By Industry Vertical (2020-2032) (USD Billion)

12.3.2.16.2 Rest Of Western Europe Holographic Display Market Estimates And Forecasts, By Technology (2020-2032) (USD Billion)

12.3.2.16.3 Rest Of Western Europe Holographic Display Market Estimates And Forecasts, By Dimension (2020-2032) (USD Billion)

12.3.2.16.4 Rest Of Western Europe Holographic Display Market Estimates And Forecasts, By Application (2020-2032) (USD Billion)

12.3.2.16.5 Rest Of Western Europe Holographic Display Market Estimates And Forecasts, By Component (2020-2032) (USD Billion)

12.4 Asia Pacific

12.4.1 Trends Analysis

12.4.2 Asia Pacific Holographic Display Market Estimates And Forecasts, By Country (2020-2032) (USD Billion)

12.4.3 Asia Pacific Holographic Display Market Estimates And Forecasts, By Industry Vertical (2020-2032) (USD Billion)

12.4.4 Asia Pacific Holographic Display Market Estimates And Forecasts, By Technology (2020-2032) (USD Billion)

12.4.5 Asia Pacific Holographic Display Market Estimates And Forecasts, By Dimension (2020-2032) (USD Billion)

12.4.6 Asia Pacific Holographic Display Market Estimates And Forecasts, By Application (2020-2032) (USD Billion)

12.4.7 Asia Pacific Holographic Display Market Estimates And Forecasts, By Component (2020-2032) (USD Billion)

12.4.8 China

12.4.8.1 China Holographic Display Market Estimates And Forecasts, By Industry Vertical (2020-2032) (USD Billion)

12.4.8.2 China Holographic Display Market Estimates And Forecasts, By Technology (2020-2032) (USD Billion)

12.4.8.3 China Holographic Display Market Estimates And Forecasts, By Dimension (2020-2032) (USD Billion)

12.4.8.4 China Holographic Display Market Estimates And Forecasts, By Application (2020-2032) (USD Billion)

12.4.8.5 China Holographic Display Market Estimates And Forecasts, By Component (2020-2032) (USD Billion)

12.4.9 India

12.4.9.1 India Holographic Display Market Estimates And Forecasts, By Industry Vertical (2020-2032) (USD Billion)

12.4.9.2 India Holographic Display Market Estimates And Forecasts, By Technology (2020-2032) (USD Billion)

12.4.9.3 India Holographic Display Market Estimates And Forecasts, By Dimension (2020-2032) (USD Billion)

12.4.9.4 India Holographic Display Market Estimates And Forecasts, By Application (2020-2032) (USD Billion)

12.4.9.5 India Holographic Display Market Estimates And Forecasts, By Component (2020-2032) (USD Billion)

12.4.10 Japan

12.4.10.1 Japan Holographic Display Market Estimates And Forecasts, By Industry Vertical (2020-2032) (USD Billion)

12.4.10.2 Japan Holographic Display Market Estimates And Forecasts, By Technology (2020-2032) (USD Billion)

12.4.10.3 Japan Holographic Display Market Estimates And Forecasts, By Dimension (2020-2032) (USD Billion)

12.4.10.4 Japan Holographic Display Market Estimates And Forecasts, By Application (2020-2032) (USD Billion)

12.4.10.5 Japan Holographic Display Market Estimates And Forecasts, By Component (2020-2032) (USD Billion)

12.4.11 South Korea

12.4.11.1 South Korea Holographic Display Market Estimates And Forecasts, By Industry Vertical (2020-2032) (USD Billion)

12.4.11.2 South Korea Holographic Display Market Estimates And Forecasts, By Technology (2020-2032) (USD Billion)

12.4.11.3 South Korea Holographic Display Market Estimates And Forecasts, By Dimension (2020-2032) (USD Billion)

12.4.11.4 South Korea Holographic Display Market Estimates And Forecasts, By Application (2020-2032) (USD Billion)

12.4.11.5 South Korea Holographic Display Market Estimates And Forecasts, By Component (2020-2032) (USD Billion)

12.4.12 Vietnam

12.4.12.1 Vietnam Holographic Display Market Estimates And Forecasts, By Industry Vertical (2020-2032) (USD Billion)

12.4.12.2 Vietnam Holographic Display Market Estimates And Forecasts, By Technology (2020-2032) (USD Billion)

12.4.12.3 Vietnam Holographic Display Market Estimates And Forecasts, By Dimension (2020-2032) (USD Billion)

12.4.12.4 Vietnam Holographic Display Market Estimates And Forecasts, By Application (2020-2032) (USD Billion)

12.4.12.5 Vietnam Holographic Display Market Estimates And Forecasts, By Component (2020-2032) (USD Billion)

12.4.13 Singapore

12.4.13.1 Singapore Holographic Display Market Estimates And Forecasts, By Industry Vertical (2020-2032) (USD Billion)

12.4.13.2 Singapore Holographic Display Market Estimates And Forecasts, By Technology (2020-2032) (USD Billion)

12.4.13.3 Singapore Holographic Display Market Estimates And Forecasts, By Dimension (2020-2032) (USD Billion)

12.4.13.4 Singapore Holographic Display Market Estimates And Forecasts, By Application (2020-2032) (USD Billion)

12.4.13.5 Singapore Holographic Display Market Estimates And Forecasts, By Component (2020-2032) (USD Billion)

12.4.14 Australia

12.4.14.1 Australia Holographic Display Market Estimates And Forecasts, By Industry Vertical (2020-2032) (USD Billion)

12.4.14.2 Australia Holographic Display Market Estimates And Forecasts, By Technology (2020-2032) (USD Billion)

12.4.14.3 Australia Holographic Display Market Estimates And Forecasts, By Dimension (2020-2032) (USD Billion)

12.4.14.4 Australia Holographic Display Market Estimates And Forecasts, By Application (2020-2032) (USD Billion)

12.4.14.5 Australia Holographic Display Market Estimates And Forecasts, By Component (2020-2032) (USD Billion)

12.4.15 Rest Of Asia Pacific

12.4.15.1 Rest Of Asia Pacific Holographic Display Market Estimates And Forecasts, By Industry Vertical (2020-2032) (USD Billion)

12.4.15.2 Rest Of Asia Pacific Holographic Display Market Estimates And Forecasts, By Technology (2020-2032) (USD Billion)

12.4.15.3 Rest Of Asia Pacific Holographic Display Market Estimates And Forecasts, By Dimension (2020-2032) (USD Billion)

12.4.15.4 Rest Of Asia Pacific Holographic Display Market Estimates And Forecasts, By Application (2020-2032) (USD Billion)

12.4.15.5 Rest Of Asia Pacific Holographic Display Market Estimates And Forecasts, By Component (2020-2032) (USD Billion)

12.5 Middle East And Africa

12.5.1 Middle East

12.5.1.1 Trends Analysis

12.5.1.2 Middle East Holographic Display Market Estimates And Forecasts, By Country (2020-2032) (USD Billion)

12.5.1.3 Middle East Holographic Display Market Estimates And Forecasts, By Industry Vertical (2020-2032) (USD Billion)

12.5.1.4 Middle East Holographic Display Market Estimates And Forecasts, By Technology (2020-2032) (USD Billion)

12.5.1.5 Middle East Holographic Display Market Estimates And Forecasts, By Dimension (2020-2032) (USD Billion)

12.5.1.6 Middle East Holographic Display Market Estimates And Forecasts, By Application (2020-2032) (USD Billion)

12.5.1.7 Middle East Holographic Display Market Estimates And Forecasts, By Component (2020-2032) (USD Billion)

12.5.1.8 UAE

12.5.1.8.1 UAE Holographic Display Market Estimates And Forecasts, By Industry Vertical (2020-2032) (USD Billion)

12.5.1.8.2 UAE Holographic Display Market Estimates And Forecasts, By Technology (2020-2032) (USD Billion)

12.5.1.8.3 UAE Holographic Display Market Estimates And Forecasts, By Dimension (2020-2032) (USD Billion)

12.5.1.8.4 UAE Holographic Display Market Estimates And Forecasts, By Application (2020-2032) (USD Billion)

12.5.1.8.5 UAE Holographic Display Market Estimates And Forecasts, By Component (2020-2032) (USD Billion)

12.5.1.9 Egypt

12.5.1.9.1 Egypt Holographic Display Market Estimates And Forecasts, By Industry Vertical (2020-2032) (USD Billion)

12.5.1.9.2 Egypt Holographic Display Market Estimates And Forecasts, By Technology (2020-2032) (USD Billion)

12.5.1.9.3 Egypt Holographic Display Market Estimates And Forecasts, By Dimension (2020-2032) (USD Billion)

12.5.1.9.4 Egypt Holographic Display Market Estimates And Forecasts, By Application (2020-2032) (USD Billion)

12.5.1.9.5 Egypt Holographic Display Market Estimates And Forecasts, By Component (2020-2032) (USD Billion)

12.5.1.10 Saudi Arabia

12.5.1.10.1 Saudi Arabia Holographic Display Market Estimates And Forecasts, By Industry Vertical (2020-2032) (USD Billion)

12.5.1.10.2 Saudi Arabia Holographic Display Market Estimates And Forecasts, By Technology (2020-2032) (USD Billion)

12.5.1.10.3 Saudi Arabia Holographic Display Market Estimates And Forecasts, By Dimension (2020-2032) (USD Billion)

12.5.1.10.4 Saudi Arabia Holographic Display Market Estimates And Forecasts, By Application (2020-2032) (USD Billion)

12.5.1.10.5 Saudi Arabia Holographic Display Market Estimates And Forecasts, By Component (2020-2032) (USD Billion)

12.5.1.11 Qatar

12.5.1.11.1 Qatar Holographic Display Market Estimates And Forecasts, By Industry Vertical (2020-2032) (USD Billion)

12.5.1.11.2 Qatar Holographic Display Market Estimates And Forecasts, By Technology (2020-2032) (USD Billion)

12.5.1.11.3 Qatar Holographic Display Market Estimates And Forecasts, By Dimension (2020-2032) (USD Billion)

12.5.1.11.4 Qatar Holographic Display Market Estimates And Forecasts, By Application (2020-2032) (USD Billion)

12.5.1.11.5 Qatar Holographic Display Market Estimates And Forecasts, By Component (2020-2032) (USD Billion)

12.5.1.12 Rest Of Middle East

12.5.1.12.1 Rest Of Middle East Holographic Display Market Estimates And Forecasts, By Industry Vertical (2020-2032) (USD Billion)

12.5.1.12.2 Rest Of Middle East Holographic Display Market Estimates And Forecasts, By Technology (2020-2032) (USD Billion)

12.5.1.12.3 Rest Of Middle East Holographic Display Market Estimates And Forecasts, By Dimension (2020-2032) (USD Billion)

12.5.1.12.4 Rest Of Middle East Holographic Display Market Estimates And Forecasts, By Application (2020-2032) (USD Billion)

12.5.1.12.5 Rest Of Middle East Holographic Display Market Estimates And Forecasts, By Component (2020-2032) (USD Billion)

12.5.2 Africa

12.5.2.1 Trends Analysis

12.5.2.2 Africa Holographic Display Market Estimates And Forecasts, By Country (2020-2032) (USD Billion)

12.5.2.3 Africa Holographic Display Market Estimates And Forecasts, By Industry Vertical (2020-2032) (USD Billion)

12.5.2.4 Africa Holographic Display Market Estimates And Forecasts, By Technology (2020-2032) (USD Billion)

12.5.2.5 Africa Holographic Display Market Estimates And Forecasts, By Dimension (2020-2032) (USD Billion)

12.5.2.6 Africa Holographic Display Market Estimates And Forecasts, By Application (2020-2032) (USD Billion)

12.5.2.7 Africa Holographic Display Market Estimates And Forecasts, By Component (2020-2032) (USD Billion)

12.5.2.8 South Africa

12.5.2.8.1 South Africa Holographic Display Market Estimates And Forecasts, By Industry Vertical (2020-2032) (USD Billion)

12.5.2.8.2 South Africa Holographic Display Market Estimates And Forecasts, By Technology (2020-2032) (USD Billion)

12.5.2.8.3 South Africa Holographic Display Market Estimates And Forecasts, By Dimension (2020-2032) (USD Billion)

12.5.2.8.4 South Africa Holographic Display Market Estimates And Forecasts, By Application (2020-2032) (USD Billion)

12.5.2.8.5 South Africa Holographic Display Market Estimates And Forecasts, By Component (2020-2032) (USD Billion)

12.5.2.9 Nigeria

12.5.2.9.1 Nigeria Holographic Display Market Estimates And Forecasts, By Industry Vertical (2020-2032) (USD Billion)

12.5.2.9.2 Nigeria Holographic Display Market Estimates And Forecasts, By Technology (2020-2032) (USD Billion)

12.5.2.9.3 Nigeria Holographic Display Market Estimates And Forecasts, By Dimension (2020-2032) (USD Billion)

12.5.2.9.4 Nigeria Holographic Display Market Estimates And Forecasts, By Application (2020-2032) (USD Billion)

12.5.2.9.5 Nigeria Holographic Display Market Estimates And Forecasts, By Component (2020-2032) (USD Billion)

12.5.2.10 Rest Of Africa

12.5.2.10.1 Rest Of Africa Holographic Display Market Estimates And Forecasts, By Industry Vertical (2020-2032) (USD Billion)

12.5.2.10.2 Rest Of Africa Holographic Display Market Estimates And Forecasts, By Technology (2020-2032) (USD Billion)

12.5.2.10.3 Rest Of Africa Holographic Display Market Estimates And Forecasts, By Dimension (2020-2032) (USD Billion)

12.5.2.10.4 Rest Of Africa Holographic Display Market Estimates And Forecasts, By Application (2020-2032) (USD Billion)

12.5.2.10.5 Rest Of Africa Holographic Display Market Estimates And Forecasts, By Component (2020-2032) (USD Billion)

12.6 Latin America

12.6.1 Trends Analysis

12.6.2 Latin America Holographic Display Market Estimates And Forecasts, By Country (2020-2032) (USD Billion)

12.6.3 Latin America Holographic Display Market Estimates And Forecasts, By Industry Vertical (2020-2032) (USD Billion)

12.6.4 Latin America Holographic Display Market Estimates And Forecasts, By Technology (2020-2032) (USD Billion)

12.6.5 Latin America Holographic Display Market Estimates And Forecasts, By Dimension (2020-2032) (USD Billion)

12.6.6 Latin America Holographic Display Market Estimates And Forecasts, By Application (2020-2032) (USD Billion)

12.6.7 Latin America Holographic Display Market Estimates And Forecasts, By Component (2020-2032) (USD Billion)

12.6.8 Brazil

12.6.8.1 Brazil Holographic Display Market Estimates And Forecasts, By Industry Vertical (2020-2032) (USD Billion)

12.6.8.2 Brazil Holographic Display Market Estimates And Forecasts, By Technology (2020-2032) (USD Billion)

12.6.8.3 Brazil Holographic Display Market Estimates And Forecasts, By Dimension (2020-2032) (USD Billion)

12.6.8.4 Brazil Holographic Display Market Estimates And Forecasts, By Application (2020-2032) (USD Billion)

12.6.8.5 Brazil Holographic Display Market Estimates And Forecasts, By Component (2020-2032) (USD Billion)

12.6.9 Argentina

12.6.9.1 Argentina Holographic Display Market Estimates And Forecasts, By Industry Vertical (2020-2032) (USD Billion)

12.6.9.2 Argentina Holographic Display Market Estimates And Forecasts, By Technology (2020-2032) (USD Billion)

12.6.9.3 Argentina Holographic Display Market Estimates And Forecasts, By Dimension (2020-2032) (USD Billion)

12.6.9.4 Argentina Holographic Display Market Estimates And Forecasts, By Application (2020-2032) (USD Billion)

12.6.9.5 Argentina Holographic Display Market Estimates And Forecasts, By Component (2020-2032) (USD Billion)

12.6.10 Colombia

12.6.10.1 Colombia Holographic Display Market Estimates And Forecasts, By Industry Vertical (2020-2032) (USD Billion)

12.6.10.2 Colombia Holographic Display Market Estimates And Forecasts, By Technology (2020-2032) (USD Billion)

12.6.10.3 Colombia Holographic Display Market Estimates And Forecasts, By Dimension (2020-2032) (USD Billion)

12.6.10.4 Colombia Holographic Display Market Estimates And Forecasts, By Application (2020-2032) (USD Billion)

12.6.10.5 Colombia Holographic Display Market Estimates And Forecasts, By Component (2020-2032) (USD Billion)

12.6.11 Rest Of Latin America

12.6.11.1 Rest Of Latin America Holographic Display Market Estimates And Forecasts, By Industry Vertical (2020-2032) (USD Billion)

12.6.11.2 Rest Of Latin America Holographic Display Market Estimates And Forecasts, By Technology (2020-2032) (USD Billion)

12.6.11.3 Rest Of Latin America Holographic Display Market Estimates And Forecasts, By Dimension (2020-2032) (USD Billion)

12.6.11.4 Rest Of Latin America Holographic Display Market Estimates And Forecasts, By Application (2020-2032) (USD Billion)

12.6.11.5 Rest Of Latin America Holographic Display Market Estimates And Forecasts, By Component (2020-2032) (USD Billion)

13. Company Profiles

13.1 Holoxica Ltd 

13.1.1 Company Overview

13.1.2 Financial

13.1.3 Products/ Services Offered

13.1.4 SWOT Analysis

13.2 RealView Imaging Ltd 

13.2.1 Company Overview

13.2.2 Financial

13.2.3 Products/ Services Offered

13.2.4 SWOT Analysis

13.3 Musion 3D Ltd 

13.3.1 Company Overview

13.3.2 Financial

13.3.3 Products/ Services Offered

13.3.4 SWOT Analysis

13.4 Looking Glass Factory Inc

13.4.1 Company Overview

13.4.2 Financial

13.4.3 Products/ Services Offered

13.4.4 SWOT Analysis

13.5 Provision Interactive Technologies Inc

13.5.1 Company Overview

13.5.2 Financial

13.5.3 Products/ Services Offered

13.5.4 SWOT Analysis

13.6 HYPERVSN 

13.6.1 Company Overview

13.6.2 Financial

13.6.3 Products/ Services Offered

13.6.4 SWOT Analysis

13.7 Leia Inc

13.7.1 Company Overview

13.7.2 Financial

13.7.3 Products/ Services Offered

13.7.4 SWOT Analysis

13.8 Zebra Imaging Inc

13.8.1 Company Overview

13.8.2 Financial

13.8.3 Products/ Services Offered

13.8.4 SWOT Analysis

13.9 AV Concepts 

13.9.1 Company Overview

13.9.2 Financial

13.9.3 Products/ Services Offered

13.9.4 SWOT Analysis

13.10 Microsoft Corporation 

13.10.1 Company Overview

13.10.2 Financial

13.10.3 Products/ Services Offered

13.10.4 SWOT Analysis

14. Use Cases and Best Practices

15. Conclusion

An accurate research report requires proper strategizing as well as implementation. There are multiple factors involved in the completion of good and accurate research report and selecting the best methodology to compete the research is the toughest part. Since the research reports we provide play a crucial role in any company’s decision-making process, therefore we at SNS Insider always believe that we should choose the best method which gives us results closer to reality. This allows us to reach at a stage wherein we can provide our clients best and accurate investment to output ratio.

Each report that we prepare takes a timeframe of 350-400 business hours for production. Starting from the selection of titles through a couple of in-depth brain storming session to the final QC process before uploading our titles on our website we dedicate around 350 working hours. The titles are selected based on their current market cap and the foreseen CAGR and growth.


The 5 steps process:

Step 1: Secondary Research:

Secondary Research or Desk Research is as the name suggests is a research process wherein, we collect data through the readily available information. In this process we use various paid and unpaid databases which our team has access to and gather data through the same. This includes examining of listed companies’ annual reports, Journals, SEC filling etc. Apart from this our team has access to various associations across the globe across different industries. Lastly, we have exchange relationships with various university as well as individual libraries.

Secondary Research

Step 2: Primary Research

When we talk about primary research, it is a type of study in which the researchers collect relevant data samples directly, rather than relying on previously collected data.  This type of research is focused on gaining content specific facts that can be sued to solve specific problems. Since the collected data is fresh and first hand therefore it makes the study more accurate and genuine.

We at SNS Insider have divided Primary Research into 2 parts.

Part 1 wherein we interview the KOLs of major players as well as the upcoming ones across various geographic regions. This allows us to have their view over the market scenario and acts as an important tool to come closer to the accurate market numbers. As many as 45 paid and unpaid primary interviews are taken from both the demand and supply side of the industry to make sure we land at an accurate judgement and analysis of the market.

This step involves the triangulation of data wherein our team analyses the interview transcripts, online survey responses and observation of on filed participants. The below mentioned chart should give a better understanding of the part 1 of the primary interview.

Primary Research

Part 2: In this part of primary research the data collected via secondary research and the part 1 of the primary research is validated with the interviews from individual consultants and subject matter experts.

Consultants are those set of people who have at least 12 years of experience and expertise within the industry whereas Subject Matter Experts are those with at least 15 years of experience behind their back within the same space. The data with the help of two main processes i.e., FGDs (Focused Group Discussions) and IDs (Individual Discussions). This gives us a 3rd party nonbiased primary view of the market scenario making it a more dependable one while collation of the data pointers.

Step 3: Data Bank Validation

Once all the information is collected via primary and secondary sources, we run that information for data validation. At our intelligence centre our research heads track a lot of information related to the market which includes the quarterly reports, the daily stock prices, and other relevant information. Our data bank server gets updated every fortnight and that is how the information which we collected using our primary and secondary information is revalidated in real time.

Data Bank Validation

Step 4: QA/QC Process

After all the data collection and validation our team does a final level of quality check and quality assurance to get rid of any unwanted or undesired mistakes. This might include but not limited to getting rid of the any typos, duplication of numbers or missing of any important information. The people involved in this process include technical content writers, research heads and graphics people. Once this process is completed the title gets uploader on our platform for our clients to read it.

Step 5: Final QC/QA Process:

This is the last process and comes when the client has ordered the study. In this process a final QA/QC is done before the study is emailed to the client. Since we believe in giving our clients a good experience of our research studies, therefore, to make sure that we do not lack at our end in any way humanly possible we do a final round of quality check and then dispatch the study to the client.

KEY MARKET SEGMENTATION

BY INDUSTRY VERTICAL

  • Pharmaceutical & Biotechnology Companies

  • Research Organizations

  • Academic Medical Centers

  • Hospitals

  • Consumer Electronics

  • Automotive

  • Retail

  • Entertainment and Media

  • Aerospace and Defense

BY TECHNOLOGY

  • Electro-holographic

  • Touchable

  • Laser

  • Piston

BY DIMENSION

  • 2D

  • 3D

  • 4D

BY APPLICATION

  • Camera

  • Digital Signage

  • Medical Imaging

  • CT & MRI

  • Smart TV

  • Laptops

BY COMPONENT

  • Light Modulator

  • Scanners

  • Lens

  • Digital Micrometer

  • Monitor

Request for Segment Customization as per your Business Requirement: Segment Customization Request

REGIONAL COVERAGE:

North America

  • US

  • Canada

  • Mexico

Europe

  • Eastern Europe

    • Poland

    • Romania

    • Hungary

    • Turkey

    • Rest of Eastern Europe

  • Western Europe

    • Germany

    • France

    • UK

    • Italy

    • Spain

    • Netherlands

    • Switzerland

    • Austria

    • Rest of Western Europe

Asia Pacific

  • China

  • India

  • Japan

  • South Korea

  • Vietnam

  • Singapore

  • Australia

  • Rest of Asia Pacific

Middle East & Africa

  • Middle East

    • UAE

    • Egypt

    • Saudi Arabia

    • Qatar

    • Rest of the Middle East

  • Africa

    • Nigeria

    • South Africa

    • Rest of Africa

Latin America

  • Brazil

  • Argentina

  • Colombia

  • Rest of Latin America

Request for Country Level Research Report: Country Level Customization Request

Available Customization

With the given market data, SNS Insider offers customization as per the company’s specific needs. The following customization options are available for the report:

  • Product Analysis

  • Criss-Cross segment analysis (e.g. Product X Application)

  • Product Matrix which gives a detailed comparison of product portfolio of each company

  • Geographic Analysis

  • Additional countries in any of the regions

  • Company Information

  • Detailed analysis and profiling of additional market players (Up to five)


  •            5000 (33% Discount)


  •            8950 (40% Discount)


  •            3050 (23% Discount)

Start a Conversation

Hi! Click one of our member below to chat on Phone