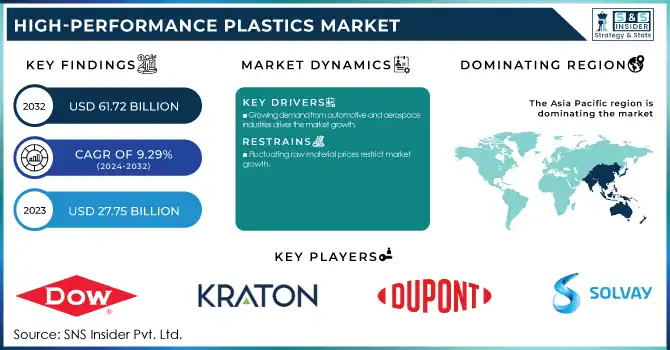
The High Performance Plastics Market size was valued at USD 27.75 billion in 2023 and is expected to reach USD 61.72 billion by 2032, growing at a CAGR of 9.29% over the forecast period of 2024-2032. The high-performance plastics market report provides key statistical insights and trends, including production capacity and utilization rates by type and region, along with an analysis of raw material prices and their impact on costs. It evaluates regulatory influences and compliance trends, highlighting evolving environmental policies. The study also covers sustainability metrics, including recycling rates and carbon emissions, alongside R&D investments driving material innovations. Additionally, it examines market demand by end-use industries, identifying key growth sectors such as aerospace, automotive, and electronics.
Get PDF Sample Copy of High-Performance Plastics Market - Request Sample Report
Drivers
Growing demand from automotive and aerospace industries drives the market growth.
The demand for high-performance plastics in the automotive and aerospace sectors is one of the biggest factors driving the growth of this market. Such plastics are lighter than metals, have a high thermal resistance, and provide great mechanical strength to replace metals in critical parts. Growing demand for fuel-efficient vehicles and electric mobility due to their capacity to improve vehicle performance, emissions, and energy efficiency is anticipated to expedite the adoption of these materials. High-performance plastics are widely used in the aerospace sector to reduce weight and save fuel in a way that meets the stringent regulations of the aerospace industry. This increasing demand for high-performance lightweight and strength applications is driving the expansion of the market.
Restraint
Fluctuating raw material prices restrict market growth.
High production costs and complicated processing are expected to hinder the growth of the high-performance plastics market. Defects in such materials depend on the manufacturing process as they require high-temperature molding and manufacturing, and operating costs increase. Also, a large dependence on high-cost raw materials such as polyether ether ketone (PEEK), polyphenylene sulfide (PPS), as well as fluoropolymers has restricted widespread adoption, especially in cost-sensitive industries. This technology has a top-of-the-line performance, which often fails to be achieved in cost and accessibility for small and medium-scale manufacturers for their penetration market.
Opportunities
Rising demand for lightweight and sustainable materials lucrative opportunities
The high-performance plastics market offers significant opportunity as key industries such as automotive, aerospace, and electronics are constantly focusing on lightweight and fuel-efficient materials. Their high strength-to-weight ratios, thermal stability properties, and chemical resistant properties offer benefits as metal and classic plastic replacement materials. Moreover, the increasing usage of bio-based and recyclable high-performance plastics for sustainability and compliance with strict environmental regulations also erodes market growth. With the developments in polymer technology, low-cost and high-performance materials are making their way into several applications in different industries.
Challenges
Fluctuating raw material prices pose a major challenge to market growth.
Raw material price fluctuation is a major restraint for the high-performance plastics market owing to the dependence of the aforementioned material on specialty polymers that are made from petroleum-based feedstocks, which hinder the high-performance plastics market growth. Crude oil is a major raw material for key products that include, but are not limited to, fluoropolymers, polyether ether ketone (PEEK), and polyphenylene sulfide (PPS), which means that the price fluctuation of crude oil directly influences the price of these raw materials, and thus, the cost-effective stability is increasing concern for a number of manufacturers. Moreover, these uncertainties are exacerbated by geopolitical tensions, supply chain bottlenecks, and trade regulations, which can lead to unforeseen cost inconsistencies and losses in production efficiency and profitability. This means that businesses in this sector have to endure continuous changes in prices, which can curtail investment in the development of new products while stunting the growth of the overall market.
By Type
Fluoropolymers held the largest market share, around 32%in 2023. It is due to their exceptional chemical resistance, thermal stability, and superior mechanical properties. These polymers, including PTFE, PVDF, and FEP, are widely used in industries such as automotive, aerospace, electronics, and chemical processing, where extreme conditions require durable and non-reactive materials. Their low friction and high dielectric properties make them indispensable in semiconductor manufacturing and wiring insulation for electronic components. Additionally, the growing demand for lightweight materials in fuel-efficient vehicles and the rising adoption of non-stick and corrosion-resistant coatings in cookware and industrial applications further drive the dominance of fluoropolymers in the market.
By End-Use Industry
The transportation segment held the largest market share, around 42% in 2023. Fluoropolymers, Polyimides, and PEEK, High-Performance Plastics, have superior thermal stability, chemical resistance, and mechanical strength, which allows for replacement of metal components. This demand for fuel efficiency and emission reduction have further fueled the use of these plastics in automotive interiors, structural components, and engine components. Moreover, the development of EVs along with the regulation limit for sustainable materials, is also increasing the demand for high-performance plastics in this sector.
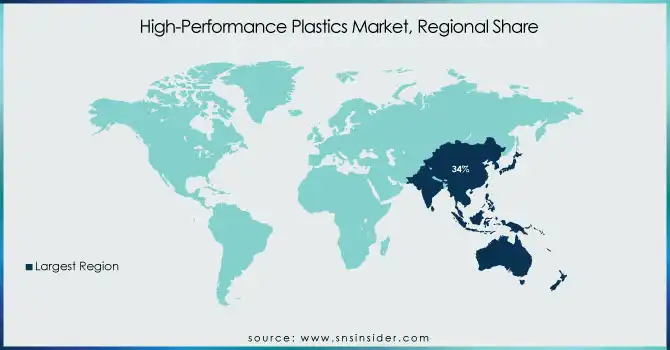
Asia Pacific held the largest market share around 34% in 2023. The rapid growth of the significant industries in the region such as automotive, electronics, and aerospace in developing countries like China, Japan, South Korea, and India. The area is also presented with solid manufacturing capabilities, lower production costs, and high investment into research and development. Further increasing demand for lightweight and sturdy materials in electric vehicles (EVs), coupled with growing consumer electronics sector, is driving the market growth. The high-performance plastics market in Asia Pacific is further driven by the support given by the government for industrialization as well as growth in urbanization and development of infrastructure.
North America held a significant share and growing in the forecast period. Fluoropolymers and polyimides are largely consumed in the aerospace sector, especially in the U.S., owing to their excellent thermal & chemical resistance. Furthermore, the increase in electric vehicles (EVs) usages and lightweight materials in the automotive industry is also propelling the high-performance plastics usage for improving fuel economy and minimizing CO2 emissions. In addition, the region is also the home to many of the key players investing in advanced polymer solutions, and the government initiatives supporting sustainable materials further reinforces the dominance of the region in the expansion of the biodegradable polymers market. In addition, the North American demand is reinforced by the increasing requirement for biocompatible and sterilizable plastics in the medical sector, especially in surgical instruments and medical implants.
Get Customised Report as per Your Business Requirement - Enquiry Now
Dow (ENGAGE, ELITE)
Kraton Corporation (Cariflex, Kraton G)
DuPont (Zytel, Delrin)
Ryan Plastics Ltd. (High-Performance PEEK, PPS Components)
RTP Company (RTP 300 Series, RTP 200 Series)
Solvay (Ryton, KetaSpire)
Eurostar Engineering Plastics (Starflam, Staramide)
LyondellBasell Industries Holdings B.V. (Purell, Hostalen)
Kuraray Co. Ltd (Genestar, Kurarister)
Toray Industries (Toraycon, Torelina)
Kureha Corporation (Krefine, Krehalon)
SABIC (Noryl, ULTEM)
PolyOne Corporation (OnFlex, ECCOH)
Victrex plc (VICTREX PEEK, VICTREX HT)
Arkema (Rilsan, Kynar)
Celanese Corporation (Hostaform, Fortron)
Ensinger (TECAPEEK, TECATRON)
Mitsubishi Chemical Corporation (Novamid, Kyron)
In 2024, BASF SE launched Ultramid Advanced N, a new polyphthalamide (PPA) grade. It is designed for automotive and industrial applications requiring high thermal and chemical resistance. This innovation enhances material performance in demanding environments.
In 2023, Evonik expanded its PA12 high-performance polymer production capacity. This move aimed to meet the rising demand in the automotive and electronics sectors. The expansion enhances supply reliability and supports industry growth.
Report Attributes | Details |
Market Size in 2023 | US$ 27.75 Billion |
Market Size by 2032 | US$ 61.72 Billion |
CAGR | CAGR of 9.29% From 2024 to 2032 |
Base Year | 2023 |
Forecast Period | 2024-2032 |
Historical Data | 2020-2022 |
Report Scope & Coverage | Market Size, Segments Analysis, Competitive Landscape, Regional Analysis, DROC & SWOT Analysis, Forecast Outlook |
Key Segments | • By Type (Fluoropolymers, HPPA, Polyphenylene Sulphide (PPS), Sulfone Polymers (SP), Liquid Crystal Polymers (LCP) and Polyamides) • By End Use Industry (Industrial, Electrical and Electronics, Transportation, Medical, Others) |
Regional Analysis/Coverage | North America (US, Canada, Mexico), Europe (Eastern Europe [Poland, Romania, Hungary, Turkey, Rest of Eastern Europe] Western Europe] Germany, France, UK, Italy, Spain, Netherlands, Switzerland, Austria, Rest of Western Europe]), Asia Pacific (China, India, Japan, South Korea, Vietnam, Singapore, Australia, Rest of Asia Pacific), Middle East & Africa (Middle East [UAE, Egypt, Saudi Arabia, Qatar, Rest of Middle East], Africa [Nigeria, South Africa, Rest of Africa], Latin America (Brazil, Argentina, Colombia Rest of Latin America) |
Company Profiles | Evonik Industries, BASF SE, Dow, Kraton Corporation, DuPont, Ryan Plastics Ltd., RTP Company, Solvay, Eurostar Engineering Plastics, LyondellBasell Industries Holdings B.V., Kuraray Co. Ltd, Toray Industries, Kureha Corporation, SABIC, PolyOne Corporation, Victrex plc, Arkema, Celanese Corporation, Ensinger, Mitsubishi Chemical Corporation |
Ans. USD 61.72 billion is the projected High Performance Plastics Market size of the market by 2032.
Ans. The CAGR of the High Performance Plastics Market over the forecast period is 9.29%
Ans. USD 27.75 billion is the projected value in 2023 for High Performance Plastics Market.
Ans. Fluctuating raw material prices pose a major challenge to market growth.
Ans. Rising demand for lightweight and sustainable materials lucrative opportunities
Table of Content
1. Introduction
1.1 Market Definition
1.2 Scope (Inclusion and Exclusions)
1.3 Research Assumptions
2. Executive Summary
2.1 Market Overview
2.2 Regional Synopsis
2.3 Competitive Summary
3. Research Methodology
3.1 Top-Down Approach
3.2 Bottom-up Approach
3.3. Data Validation
3.4 Primary Interviews
4. Market Dynamics Impact Analysis
4.1 Market Driving Factors Analysis
4.1.2 Drivers
4.1.2 Restraints
4.1.3 Opportunities
4.1.4 Challenges
4.2 PESTLE Analysis
4.3 Porter’s Five Forces Model
5. Statistical Insights and Trends Reporting
5.1 Production Capacity and Utilization, by Country, By Type, 2023
5.2 Feedstock Prices, by Country, By Type, 2023
5.3 Regulatory Impact, by Country, By Type 2023.
5.4 Environmental Metrics: Emissions Data, Waste Management Practices, and Sustainability Initiatives, by Region
5.5 Innovation and R&D, Type, 2023
6. Competitive Landscape
6.1 List of Major Companies, By Region
6.2 Market Share Analysis, By Region
6.3 Product Benchmarking
6.3.1 Product specifications and features
6.3.2 Pricing
6.4 Strategic Initiatives
6.4.1 Marketing and promotional activities
6.4.2 Distribution and Supply Chain Strategies
6.4.3 Expansion Plans and New Product Launches
6.4.4 Strategic partnerships and collaborations
6.5 Technological Advancements
6.6 Market Positioning and Branding
7. High Performance Plastics Market Segmentation, By Type
7.1 Chapter Overview
7.2 Fluoropolymers
7.2.1 Fluoropolymers Trends Analysis (2020-2032)
7.2.2 Fluoropolymers Market Size Estimates and Forecasts to 2032 (USD Billon)
7.3 HPPA
7.3.1 HPPA Market Trends Analysis (2020-2032)
7.3.2 HPPA Market Size Estimates and Forecasts to 2032 (USD Billon)
7.4 Polyphenylene Sulphide (PPS)
7.4.1 Polyphenylene Sulphide (PPS)Trends Analysis (2020-2032)
7.4.2 Polyphenylene Sulphide (PPS) Market Size Estimates and Forecasts to 2032 (USD Billon)
7.5 Sulfone Polymers (SP)
7.5.1 Sulfone Polymers (SP) Market Trends Analysis (2020-2032)
7.5.2 Sulfone Polymers (SP) Market Size Estimates and Forecasts to 2032 (USD Billon)
7.6 Liquid Crystal Polymers (LCP)
7.6.1 Liquid Crystal Polymers (LCP) Trends Analysis (2020-2032)
7.6.2 Liquid Crystal Polymers (LCP) Market Size Estimates and Forecasts to 2032 (USD Billon)
7.7 Polyamides
7.7.1 Polyamides Market Trends Analysis (2020-2032)
7.7.2 Polyamides Market Size Estimates and Forecasts to 2032 (USD Billon)
8. High Performance Plastics Market Segmentation, by End-Use Industry
8.1 Chapter Overview
8.2 Industrial
8.2.1 Industrial Market Trends Analysis (2020-2032)
8.2.2 Industrial Market Size Estimates and Forecasts to 2032 (USD Billon)
8.3 Electrical and Electronics
8.3.1 Electrical and Electronics Market Trends Analysis (2020-2032)
8.3.2 Electrical and Electronics Market Size Estimates and Forecasts to 2032 (USD Billon)
8.4 Transportation
8.4.1 Transportation Market Trends Analysis (2020-2032)
8.4.2 Transportation Market Size Estimates and Forecasts to 2032 (USD Billon)
8.5 Medical
8.5.1 Medical Market Trends Analysis (2020-2032)
8.5.2 Medical Market Size Estimates and Forecasts to 2032 (USD Billon)
8.6 Others
8.6.1 Others Market Trends Analysis (2020-2032)
8.6.2 Others Market Size Estimates and Forecasts to 2032 (USD Billon)
9. Regional Analysis
9.1 Chapter Overview
9.2 North America
9.2.1 Trends Analysis
9.2.2 North America High Performance Plastics Market Estimates and Forecasts, by Country (2020-2032) (USD Billon)
9.2.3 North America High Performance Plastics Market Estimates and Forecasts, By Type (2020-2032) (USD Billon)
9.2.4 North America High Performance Plastics Market Estimates and Forecasts, by End-Use Industry (2020-2032) (USD Billon)
9.2.5 USA
9.2.5.1 USA High Performance Plastics Market Estimates and Forecasts, By Type (2020-2032) (USD Billon)
9.2.5.2 USA High Performance Plastics Market Estimates and Forecasts, by End-Use Industry (2020-2032) (USD Billon)
9.2.6 Canada
9.2.6.1 Canada High Performance Plastics Market Estimates and Forecasts, By Type (2020-2032) (USD Billon)
9.2.6.2 Canada High Performance Plastics Market Estimates and Forecasts, by End-Use Industry (2020-2032) (USD Billon)
9.2.7 Mexico
9.2.7.1 Mexico High Performance Plastics Market Estimates and Forecasts, By Type (2020-2032) (USD Billon)
9.2.7.2 Mexico High Performance Plastics Market Estimates and Forecasts, by End-Use Industry (2020-2032) (USD Billon)
9.3 Europe
9.3.1 Eastern Europe
9.3.1.1 Trends Analysis
9.3.1.2 Eastern Europe High Performance Plastics Market Estimates and Forecasts, by Country (2020-2032) (USD Billon)
9.3.1.3 Eastern Europe High Performance Plastics Market Estimates and Forecasts, By Type (2020-2032) (USD Billon)
9.3.1.4 Eastern Europe High Performance Plastics Market Estimates and Forecasts, by End-Use Industry (2020-2032) (USD Billon)
9.3.1.5 Poland
9.3.1.5.1 Poland High Performance Plastics Market Estimates and Forecasts, By Type (2020-2032) (USD Billon)
9.3.1.5.2 Poland High Performance Plastics Market Estimates and Forecasts, by End-Use Industry (2020-2032) (USD Billon)
9.3.1.6 Romania
9.3.1.6.1 Romania High Performance Plastics Market Estimates and Forecasts, By Type (2020-2032) (USD Billon)
9.3.1.6.2 Romania High Performance Plastics Market Estimates and Forecasts, by End-Use Industry (2020-2032) (USD Billon)
9.3.1.7 Hungary
9.3.1.7.1 Hungary High Performance Plastics Market Estimates and Forecasts, By Type (2020-2032) (USD Billon)
9.3.1.7.2 Hungary High Performance Plastics Market Estimates and Forecasts, by End-Use Industry (2020-2032) (USD Billon)
9.3.1.8 Turkey
9.3.1.8.1 Turkey High Performance Plastics Market Estimates and Forecasts, By Type (2020-2032) (USD Billon)
9.3.1.8.2 Turkey High Performance Plastics Market Estimates and Forecasts, by End-Use Industry (2020-2032) (USD Billon)
9.3.1.9 Rest of Eastern Europe
9.3.1.9.1 Rest of Eastern Europe High Performance Plastics Market Estimates and Forecasts, By Type (2020-2032) (USD Billon)
9.3.1.9.2 Rest of Eastern Europe High Performance Plastics Market Estimates and Forecasts, by End-Use Industry (2020-2032) (USD Billon)
9.3.2 Western Europe
9.3.2.1 Trends Analysis
9.3.2.2 Western Europe High Performance Plastics Market Estimates and Forecasts, by Country (2020-2032) (USD Billon)
9.3.2.3 Western Europe High Performance Plastics Market Estimates and Forecasts, By Type (2020-2032) (USD Billon)
9.3.2.4 Western Europe High Performance Plastics Market Estimates and Forecasts, by End-Use Industry (2020-2032) (USD Billon)
9.3.2.5 Germany
9.3.2.5.1 Germany High Performance Plastics Market Estimates and Forecasts, By Type (2020-2032) (USD Billon)
9.3.2.5.2 Germany High Performance Plastics Market Estimates and Forecasts, by End-Use Industry (2020-2032) (USD Billon)
9.3.2.6 France
9.3.2.6.1 France High Performance Plastics Market Estimates and Forecasts, By Type (2020-2032) (USD Billon)
9.3.2.6.2 France High Performance Plastics Market Estimates and Forecasts, by End-Use Industry (2020-2032) (USD Billon)
9.3.2.7 UK
9.3.2.7.1 UK High Performance Plastics Market Estimates and Forecasts, By Type (2020-2032) (USD Billon)
9.3.2.7.2 UK High Performance Plastics Market Estimates and Forecasts, by End-Use Industry (2020-2032) (USD Billon)
9.3.2.8 Italy
9.3.2.8.1 Italy High Performance Plastics Market Estimates and Forecasts, By Type (2020-2032) (USD Billon)
9.3.2.8.2 Italy High Performance Plastics Market Estimates and Forecasts, by End-Use Industry (2020-2032) (USD Billon)
9.3.2.9 Spain
9.3.2.9.1 Spain High Performance Plastics Market Estimates and Forecasts, By Type (2020-2032) (USD Billon)
9.3.2.9.2 Spain High Performance Plastics Market Estimates and Forecasts, by End-Use Industry (2020-2032) (USD Billon)
9.3.2.10 Netherlands
9.3.2.10.1 Netherlands High Performance Plastics Market Estimates and Forecasts, By Type (2020-2032) (USD Billon)
9.3.2.10.2 Netherlands High Performance Plastics Market Estimates and Forecasts, by End-Use Industry (2020-2032) (USD Billon)
9.3.2.11 Switzerland
9.3.2.11.1 Switzerland High Performance Plastics Market Estimates and Forecasts, By Type (2020-2032) (USD Billon)
9.3.2.11.2 Switzerland High Performance Plastics Market Estimates and Forecasts, by End-Use Industry (2020-2032) (USD Billon)
9.3.2.12 Austria
9.3.2.12.1 Austria High Performance Plastics Market Estimates and Forecasts, By Type (2020-2032) (USD Billon)
9.3.2.12.2 Austria High Performance Plastics Market Estimates and Forecasts, by End-Use Industry (2020-2032) (USD Billon)
9.3.2.13 Rest of Western Europe
9.3.2.13.1 Rest of Western Europe High Performance Plastics Market Estimates and Forecasts, By Type (2020-2032) (USD Billon)
9.3.2.13.2 Rest of Western Europe High Performance Plastics Market Estimates and Forecasts, by End-Use Industry (2020-2032) (USD Billon)
9.4 Asia Pacific
9.4.1 Trends Analysis
9.4.2 Asia Pacific High Performance Plastics Market Estimates and Forecasts, by Country (2020-2032) (USD Billon)
9.4.3 Asia Pacific High Performance Plastics Market Estimates and Forecasts, By Type (2020-2032) (USD Billon)
9.4.4 Asia Pacific High Performance Plastics Market Estimates and Forecasts, by End-Use Industry (2020-2032) (USD Billon)
9.4.5 China
9.4.5.1 China High Performance Plastics Market Estimates and Forecasts, By Type (2020-2032) (USD Billon)
9.4.5.2 China High Performance Plastics Market Estimates and Forecasts, by End-Use Industry (2020-2032) (USD Billon)
9.4.6 India
9.4.5.1 India High Performance Plastics Market Estimates and Forecasts, By Type (2020-2032) (USD Billon)
9.4.5.2 India High Performance Plastics Market Estimates and Forecasts, by End-Use Industry (2020-2032) (USD Billon)
9.4.5 Japan
9.4.5.1 Japan High Performance Plastics Market Estimates and Forecasts, By Type (2020-2032) (USD Billon)
9.4.5.2 Japan High Performance Plastics Market Estimates and Forecasts, by End-Use Industry (2020-2032) (USD Billon)
9.4.6 South Korea
9.4.6.1 South Korea High Performance Plastics Market Estimates and Forecasts, By Type (2020-2032) (USD Billon)
9.4.6.2 South Korea High Performance Plastics Market Estimates and Forecasts, by End-Use Industry (2020-2032) (USD Billon)
9.4.7 Vietnam
9.4.7.1 Vietnam High Performance Plastics Market Estimates and Forecasts, By Type (2020-2032) (USD Billon)
9.2.7.2 Vietnam High Performance Plastics Market Estimates and Forecasts, by End-Use Industry (2020-2032) (USD Billon)
9.4.8 Singapore
9.4.8.1 Singapore High Performance Plastics Market Estimates and Forecasts, By Type (2020-2032) (USD Billon)
9.4.8.2 Singapore High Performance Plastics Market Estimates and Forecasts, by End-Use Industry (2020-2032) (USD Billon)
9.4.9 Australia
9.4.9.1 Australia High Performance Plastics Market Estimates and Forecasts, By Type (2020-2032) (USD Billon)
9.4.9.2 Australia High Performance Plastics Market Estimates and Forecasts, by End-Use Industry (2020-2032) (USD Billon)
9.4.10 Rest of Asia Pacific
9.4.10.1 Rest of Asia Pacific High Performance Plastics Market Estimates and Forecasts, By Type (2020-2032) (USD Billon)
9.4.10.2 Rest of Asia Pacific High Performance Plastics Market Estimates and Forecasts, by End-Use Industry (2020-2032) (USD Billon)
9.5 Middle East and Africa
9.5.1 Middle East
9.5.1.1 Trends Analysis
9.5.1.2 Middle East High Performance Plastics Market Estimates and Forecasts, by Country (2020-2032) (USD Billon)
9.5.1.3 Middle East High Performance Plastics Market Estimates and Forecasts, By Type (2020-2032) (USD Billon)
9.5.1.4 Middle East High Performance Plastics Market Estimates and Forecasts, by End-Use Industry (2020-2032) (USD Billon)
9.5.1.5 UAE
9.5.1.5.1 UAE High Performance Plastics Market Estimates and Forecasts, By Type (2020-2032) (USD Billon)
9.5.1.5.2 UAE High Performance Plastics Market Estimates and Forecasts, by End-Use Industry (2020-2032) (USD Billon)
9.5.1.6 Egypt
9.5.1.6.1 Egypt High Performance Plastics Market Estimates and Forecasts, By Type (2020-2032) (USD Billon)
9.5.1.6.2 Egypt High Performance Plastics Market Estimates and Forecasts, by End-Use Industry (2020-2032) (USD Billon)
9.5.1.7 Saudi Arabia
9.5.1.7.1 Saudi Arabia High Performance Plastics Market Estimates and Forecasts, By Type (2020-2032) (USD Billon)
9.5.1.7.2 Saudi Arabia High Performance Plastics Market Estimates and Forecasts, by End-Use Industry (2020-2032) (USD Billon)
9.5.1.8 Qatar
9.5.1.8.1 Qatar High Performance Plastics Market Estimates and Forecasts, By Type (2020-2032) (USD Billon)
9.5.1.8.2 Qatar High Performance Plastics Market Estimates and Forecasts, by End-Use Industry (2020-2032) (USD Billon)
9.5.1.9 Rest of Middle East
9.5.1.9.1 Rest of Middle East High Performance Plastics Market Estimates and Forecasts, By Type (2020-2032) (USD Billon)
9.5.1.9.2 Rest of Middle East High Performance Plastics Market Estimates and Forecasts, by End-Use Industry (2020-2032) (USD Billon)
9.5.2 Africa
9.5.2.1 Trends Analysis
9.5.2.2 Africa High Performance Plastics Market Estimates and Forecasts, by Country (2020-2032) (USD Billon)
9.5.2.3 Africa High Performance Plastics Market Estimates and Forecasts, By Type (2020-2032) (USD Billon)
9.5.2.4 Africa High Performance Plastics Market Estimates and Forecasts, by End-Use Industry (2020-2032) (USD Billon)
9.5.2.5 South Africa
9.5.2.5.1 South Africa High Performance Plastics Market Estimates and Forecasts, By Type (2020-2032) (USD Billon)
9.5.2.5.2 South Africa High Performance Plastics Market Estimates and Forecasts, by End-Use Industry (2020-2032) (USD Billon)
9.5.2.6 Nigeria
9.5.2.6.1 Nigeria High Performance Plastics Market Estimates and Forecasts, By Type (2020-2032) (USD Billon)
9.5.2.6.2 Nigeria High Performance Plastics Market Estimates and Forecasts, by End-Use Industry (2020-2032) (USD Billon)
9.6 Latin America
9.6.1 Trends Analysis
9.6.2 Latin America High Performance Plastics Market Estimates and Forecasts, by Country (2020-2032) (USD Billon)
9.6.3 Latin America High Performance Plastics Market Estimates and Forecasts, By Type (2020-2032) (USD Billon)
9.6.4 Latin America High Performance Plastics Market Estimates and Forecasts, by End-Use Industry (2020-2032) (USD Billon)
9.6.5 Brazil
9.6.5.1 Brazil High Performance Plastics Market Estimates and Forecasts, By Type (2020-2032) (USD Billon)
9.6.5.2 Brazil High Performance Plastics Market Estimates and Forecasts, by End-Use Industry (2020-2032) (USD Billon)
9.6.6 Argentina
9.6.6.1 Argentina High Performance Plastics Market Estimates and Forecasts, By Type (2020-2032) (USD Billon)
9.6.6.2 Argentina High Performance Plastics Market Estimates and Forecasts, by End-Use Industry (2020-2032) (USD Billon)
9.6.7 Colombia
9.6.7.1 Colombia High Performance Plastics Market Estimates and Forecasts, By Type (2020-2032) (USD Billon)
9.6.7.2 Colombia High Performance Plastics Market Estimates and Forecasts, by End-Use Industry (2020-2032) (USD Billon)
9.6.8 Rest of Latin America
9.6.8.1 Rest of Latin America High Performance Plastics Market Estimates and Forecasts, By Type (2020-2032) (USD Billon)
9.6.8.2 Rest of Latin America High Performance Plastics Market Estimates and Forecasts, by End-Use Industry (2020-2032) (USD Billon)
10. Company Profiles
10.1 Evonik Industries
10.1.1 Company Overview
10.1.2 Financial
10.1.3 Product / Services Offered
10.1.4 SWOT Analysis
10.2 BASF SE
10.2.1 Company Overview
10.2.2 Financial
10.2.3 Product/ Services Offered
10.2.4 SWOT Analysis
10.3 Dow
10.3.1 Company Overview
10.3.2 Financial
10.3.3 Product/ Services Offered
10.3.4 SWOT Analysis
10.4 Kraton Corporation
10.4.1 Company Overview
10.4.2 Financial
10.4.3 Product/ Services Offered
10.4.4 SWOT Analysis
10.5 DuPont.
10.5.1 Company Overview
10.5.2 Financial
10.5.3 Product/ Services Offered
10.5.4 SWOT Analysis
10.6 Ryan Plastics Ltd.
10.6.1 Company Overview
10.6.2 Financial
10.6.3 Product/ Services Offered
10.6.4 SWOT Analysis
10.7 RTP Company
10.7.1 Company Overview
10.7.2 Financial
10.7.3 Product/ Services Offered
10.7.4 SWOT Analysis
10.8 Solvay
10.8.1 Company Overview
10.8.2 Financial
10.8.3 Product/ Services Offered
10.8.4 SWOT Analysis
10.9 Eurostar Engineering Plastics
10.9.1 Company Overview
10.9.2 Financial
10.9.3 Product/ Services Offered
10.9.4 SWOT Analysis
10.10 LyondellBasell Industries Holdings B.V.
10.10.1 Company Overview
10.10.2 Financial
10.10.3 Product/ Services Offered
10.10.4 SWOT Analysis
11. Use Cases and Best Practices
12. Conclusion
An accurate research report requires proper strategizing as well as implementation. There are multiple factors involved in the completion of good and accurate research report and selecting the best methodology to compete the research is the toughest part. Since the research reports we provide play a crucial role in any company’s decision-making process, therefore we at SNS Insider always believe that we should choose the best method which gives us results closer to reality. This allows us to reach at a stage wherein we can provide our clients best and accurate investment to output ratio.
Each report that we prepare takes a timeframe of 350-400 business hours for production. Starting from the selection of titles through a couple of in-depth brain storming session to the final QC process before uploading our titles on our website we dedicate around 350 working hours. The titles are selected based on their current market cap and the foreseen CAGR and growth.
The 5 steps process:
Step 1: Secondary Research:
Secondary Research or Desk Research is as the name suggests is a research process wherein, we collect data through the readily available information. In this process we use various paid and unpaid databases which our team has access to and gather data through the same. This includes examining of listed companies’ annual reports, Journals, SEC filling etc. Apart from this our team has access to various associations across the globe across different industries. Lastly, we have exchange relationships with various university as well as individual libraries.
Step 2: Primary Research
When we talk about primary research, it is a type of study in which the researchers collect relevant data samples directly, rather than relying on previously collected data. This type of research is focused on gaining content specific facts that can be sued to solve specific problems. Since the collected data is fresh and first hand therefore it makes the study more accurate and genuine.
We at SNS Insider have divided Primary Research into 2 parts.
Part 1 wherein we interview the KOLs of major players as well as the upcoming ones across various geographic regions. This allows us to have their view over the market scenario and acts as an important tool to come closer to the accurate market numbers. As many as 45 paid and unpaid primary interviews are taken from both the demand and supply side of the industry to make sure we land at an accurate judgement and analysis of the market.
This step involves the triangulation of data wherein our team analyses the interview transcripts, online survey responses and observation of on filed participants. The below mentioned chart should give a better understanding of the part 1 of the primary interview.
Part 2: In this part of primary research the data collected via secondary research and the part 1 of the primary research is validated with the interviews from individual consultants and subject matter experts.
Consultants are those set of people who have at least 12 years of experience and expertise within the industry whereas Subject Matter Experts are those with at least 15 years of experience behind their back within the same space. The data with the help of two main processes i.e., FGDs (Focused Group Discussions) and IDs (Individual Discussions). This gives us a 3rd party nonbiased primary view of the market scenario making it a more dependable one while collation of the data pointers.
Step 3: Data Bank Validation
Once all the information is collected via primary and secondary sources, we run that information for data validation. At our intelligence centre our research heads track a lot of information related to the market which includes the quarterly reports, the daily stock prices, and other relevant information. Our data bank server gets updated every fortnight and that is how the information which we collected using our primary and secondary information is revalidated in real time.
Step 4: QA/QC Process
After all the data collection and validation our team does a final level of quality check and quality assurance to get rid of any unwanted or undesired mistakes. This might include but not limited to getting rid of the any typos, duplication of numbers or missing of any important information. The people involved in this process include technical content writers, research heads and graphics people. Once this process is completed the title gets uploader on our platform for our clients to read it.
Step 5: Final QC/QA Process:
This is the last process and comes when the client has ordered the study. In this process a final QA/QC is done before the study is emailed to the client. Since we believe in giving our clients a good experience of our research studies, therefore, to make sure that we do not lack at our end in any way humanly possible we do a final round of quality check and then dispatch the study to the client.
Key Segments
By Type
Fluoropolymers
HPPA
Polyphenylene Sulphide (PPS)
Sulfone Polymers (SP)
Liquid Crystal Polymers (LCP)
Polyamides
By End-Use Industry
Industrial
Electrical and Electronics
Transportation
Medical
Request for Segment Customization as per your Business Requirement: Segment Customization Request
Regional Coverage:
North America
US
Canada
Mexico
Europe
Eastern Europe
Poland
Romania
Hungary
Turkey
Rest of Eastern Europe
Western Europe
Germany
France
UK
Italy
Spain
Netherlands
Switzerland
Austria
Rest of Western Europe
Asia Pacific
China
India
Japan
South Korea
Vietnam
Singapore
Australia
Rest of Asia Pacific
Middle East & Africa
Middle East
UAE
Egypt
Saudi Arabia
Qatar
Rest of Middle East
Africa
Nigeria
South Africa
Rest of Africa
Latin America
Brazil
Argentina
Colombia
Rest of Latin America
Request for Country Level Research Report: Country Level Customization Request
Available Customization
With the given market data, SNS Insider offers customization as per the company’s specific needs. The following customization options are available for the report:
Product Analysis
Criss-Cross segment analysis (e.g. Product X Application)
Product Matrix which gives a detailed comparison of the product portfolio of each company
Geographic Analysis
Additional countries in any of the regions
Company Information
Detailed analysis and profiling of additional market players (Up to five)
Antimicrobial Plastics Market was valued at USD 44.01 billion in 2023 and is expected to reach USD 85.06 billion by 2032, at a CAGR of 7.63% from 2024-2032.
The Firefighting Foam Market Size was valued at USD 5.2 Billion in 2023 and is expected to reach USD 7.2 Billion by 2032, growing at a CAGR of 3.7% over the forecast period of 2024-2032.
The Guaiacol Market size was valued at USD 321.05 million in 2023 and is expected to reach USD 367.08 million by 2032 and grow at a CAGR of 1.50% over the forecast period of 2024-2032.
Zero Friction Coatings Market Size was valued at USD 915.6 Million in 2023 and will reach USD 1469.8 Million by 2032 & grow at a CAGR of 5.4% by 2024-2032.
The Zero Liquid Discharge Systems Market Size was valued at USD 7.25 Billion in 2023 and is expected to reach USD 14.54 Billion by 2032, growing at a CAGR of 8.04% over the forecast period of 2024-2032.
The Biotech Ingredients Market Size was valued at USD 2.2 billion in 2023 and will reach USD 4.3 billion by 2032 and grow at a CAGR of 7.8% by 2024-2032.
Hi! Click one of our member below to chat on Phone