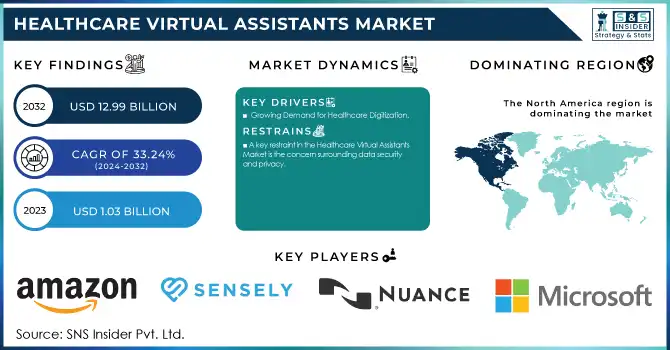
The Healthcare Virtual Assistants Market was valued at USD 1.03 billion in 2023 and is expected to reach USD 12.99 billion by 2032, growing at a CAGR of 33.24% over the forecast period 2024-2032.
Get more information on Healthcare Virtual Assistants Market - Request Sample Report
The Healthcare Virtual Assistants Market is undergoing rapid transformation, fueled by the increasing integration of artificial intelligence and automation in healthcare. A survey by Accenture showed that 61% of healthcare executives are already using AI to improve patient care, and a significant portion of that adoption involves AI-driven virtual assistants. These virtual assistants are instrumental in streamlining administrative processes, improving patient engagement, and offering cost-effective, scalable solutions for care delivery, especially as the demand for remote healthcare rises.
One of the key areas where healthcare virtual assistants have demonstrated impact is in telemedicine. For instance, Babylon Health, an AI-powered healthcare platform, provides patients with virtual consultations and health assessments through a chatbot that uses AI to simulate doctor-patient interactions. This platform has expanded globally, reaching millions of patients in countries like the UK and Rwanda, illustrating the growing role of virtual assistants in remote care delivery.
In the context of patient engagement, studies have shown that patients are more likely to follow up on health recommendations when they receive personalized, AI-driven interventions. A study conducted by the Mayo Clinic demonstrated that AI-based virtual assistants could improve patient compliance with medication schedules by sending automated reminders, which in turn led to better patient outcomes. Furthermore, the increasing adoption of these technologies is helping to address a shortage of healthcare professionals by automating routine tasks. For example, Lifelink Systems, which provides virtual assistants for healthcare providers, reported that their platform saved healthcare organizations over 30% in operational costs by automating appointment scheduling and patient outreach.
The market growth is also supported by the cost-saving potential of AI assistants in reducing administrative burdens. According to a study by Deloitte, healthcare organizations that implement AI-driven solutions such as virtual assistants can reduce operational costs by as much as 40%. This efficiency gain is crucial at a time when healthcare systems worldwide are under financial pressure to maintain high-quality care.
As the technology matures, regulatory bodies such as the FDA in the United States are beginning to formalize the approval process for AI-based healthcare tools, further accelerating adoption. With these developments, the healthcare virtual assistants market is poised for continued expansion, offering significant opportunities for healthcare providers and AI technology developers.
Drivers
Growing Demand for Healthcare Digitization
The healthcare sector is increasingly adopting digital solutions to improve service delivery, and virtual assistants are at the forefront of this transformation. As healthcare systems transition to digital platforms, virtual assistants help to manage administrative workloads, automate tasks, and improve service efficiency. This digitization enables healthcare providers to offer more accessible and timely care to patients, especially in remote areas. Virtual assistants also support healthcare organizations in managing patient records, coordinating appointments, and providing health information, reducing human error and optimizing workflow. As healthcare providers continue to invest in digital health solutions to streamline operations, the demand for AI-powered virtual assistants will increase, as they provide a cost-effective and scalable solution to address the sector's growing needs.
Enhanced Patient Engagement and Experience
Virtual assistants are becoming an essential tool in improving patient engagement by providing personalized support. These AI-powered assistants interact with patients 24/7, helping them with routine inquiries, health-related questions, and appointment scheduling, all of which contribute to a more seamless patient experience. With the ability to analyze patient data, virtual assistants can offer tailored health advice, reminders for medication, and follow-up care, ensuring that patients are more actively involved in their healthcare journey. Additionally, virtual assistants empower patients by giving them easy access to information, reducing the need for in-person visits, and minimizing wait times. This level of engagement has been shown to improve patient outcomes, satisfaction, and adherence to treatment plans, making it a vital driver for their widespread adoption.
Alleviating the Healthcare Professional Shortage
The shortage of healthcare professionals, particularly in administrative roles, is a significant challenge facing healthcare systems globally. Virtual assistants help alleviate this issue by automating routine tasks such as appointment scheduling, patient follow-ups, and medical record management. By offloading these administrative duties, healthcare providers can redirect their resources toward direct patient care. This is especially important in hospitals and clinics experiencing high patient volumes, where medical staff are often overburdened with non-clinical tasks. Virtual assistants enable healthcare organizations to maintain operational efficiency and prevent burnout among staff. With the continuous increase in patient demand and the limited availability of healthcare workers, virtual assistants present a vital solution to streamline operations, enhance productivity, and improve overall healthcare delivery.
Restraints
A key restraint in the Healthcare Virtual Assistants Market is the concern surrounding data security and privacy.
Since virtual assistants manage sensitive health information, they must comply with strict regulations like HIPAA in the U.S. and GDPR in Europe. These systems often rely on cloud computing and AI technologies to process and store large amounts of personal data, increasing the risk of cyber threats, data breaches, and unauthorized access. Healthcare providers must implement robust cybersecurity measures, including encryption and secure data storage solutions, to protect patient confidentiality. Moreover, patients may feel apprehensive about sharing their private health details with AI-powered systems, which can hinder adoption. Ensuring compliance with privacy laws and maintaining transparency regarding data usage are crucial to addressing these concerns, but they remain a significant challenge for the market's expansion.
By Product
Smart speakers dominated the healthcare virtual assistant market in 2023, accounting for over 40% of the market share. Their widespread adoption is driven by their ability to provide hands-free assistance, making them ideal for healthcare settings. Devices like Amazon Alexa and Google Home are used in various applications, including patient monitoring, medication reminders, and appointment scheduling. These devices are especially beneficial for elderly individuals and patients with mobility challenges who find traditional devices difficult to use. The affordability, ease of integration into existing healthcare systems, and the growing number of healthcare-specific features have contributed to their dominance.
The chatbot segment is anticipated to be the fastest-growing segment over the forecast period. This growth can be attributed to the rising demand for AI-powered conversational interfaces in healthcare, enabling immediate responses to patient inquiries, assisting with appointment scheduling, and providing basic health advice. Chatbots offer 24/7 support, improving healthcare accessibility by engaging patients in real-time.
By User Interface
In 2023, Text-based interfaces dominated the user interface segment of the healthcare virtual assistant market, accounting for 45% of the total market share. Despite the growing popularity of voice-based interactions, text-based communication remains the most widely used interface for virtual assistants in healthcare settings. Text-based interfaces are valued for their simplicity and the ability to provide clear, written responses that are easy to reference, especially in administrative tasks like scheduling, patient inquiries, and appointment management. These interfaces are often employed in both patient-facing and back-end healthcare processes.
Automatic Speech Recognition is expected to grow at the highest Compound Annual Growth Rate in the healthcare virtual assistants market. The increasing demand for hands-free, efficient, and accurate communication in healthcare settings is driving this growth. ASR technology allows healthcare professionals and patients to interact with virtual assistants through natural spoken language, reducing the need for manual input and enhancing overall workflow efficiency.
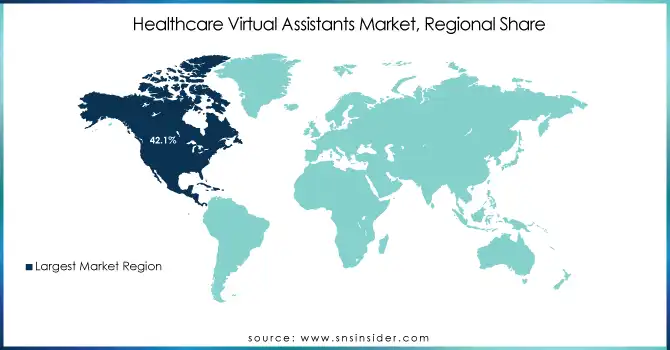
In 2023, North America held the largest share of the healthcare virtual assistant market, accounting for over 42.1% of the total market. This dominance is primarily driven by the high adoption of advanced technologies, including AI and voice-activated solutions, across healthcare institutions in the United States and Canada. The region's strong healthcare infrastructure, combined with a growing demand for patient engagement tools and operational efficiency, contributes significantly to the adoption of healthcare virtual assistants. The increasing focus on improving patient care, reducing administrative burdens, and enhancing operational efficiency has further accelerated the growth of healthcare virtual assistants in North America. Moreover, government initiatives and funding for AI and healthcare technology integration support market growth.
In Europe, the market is also witnessing significant growth, with countries like the United Kingdom, Germany, and France leading the charge. The European market is driven by the need to improve healthcare delivery and manage the rising healthcare costs associated with aging populations. Countries are increasingly investing in AI-based healthcare technologies to improve patient engagement, reduce hospital readmission rates, and enhance clinical efficiency. Furthermore, the European Union’s push towards digital health adoption further accelerates the growth of healthcare virtual assistants in the region.
The Asia-Pacific region is expected to be the fastest growth during the coming years. Rapid technological advancements, increasing healthcare digitization, and rising healthcare demand in countries like India, China, and Japan are key factors contributing to the region's expansion. The growing emphasis on patient care accessibility, especially in rural and underserved areas, is fueling the demand for virtual healthcare assistants.
Need any customization research on Healthcare Virtual Assistants Market - Enquiry Now
Microsoft - Azure AI, Microsoft Health Bot
Nuance Communications Inc. - Nuance Virtual Assistant
Amazon - Amazon Alexa for Healthcare
Sensly - Sensly Virtual Health Assistant
HealthTap Inc. - HealthTap Virtual Assistant
Infermedica - Infermedica Symptom Checker
eGain Corporation - eGain Virtual Assistant
Babylon Healthcare Services Ltd - Babylon AI Health Assistant
Verint Systems Inc. - Verint Virtual Assistant
Kognito Solutions LLC - Kognito Virtual Patient Assistant
AliveCor - KardiaMobile Virtual Assistant
IBM Watson Health - IBM Watson Assistant for Healthcare
Orbita - Orbita Virtual Assistant
Ada Health - Ada Health Assistant
Pyramid Healthcare - Pyramid Virtual Assistant
MedeAnalytics - MedeAnalytics Virtual Assistant
Baobab Health - Baobab Virtual Health Assistant
Vivify Health - Vivify Virtual Health Assistant
In Jan 2025, Movano Health unveiled the beta version of EvieAI, a virtual wellness assistant integrated with its Evie smart ring. This innovative feature allows users to access reliable and secure health information through the ring's companion app, with training based exclusively on medical journal data.
In Aug 2024, My Mountain Mover, a leading provider of medical virtual assistants, reached a major milestone with the recruitment and deployment of 1,000 skilled Filipino medical professionals. This achievement marks a significant step in transforming healthcare organizations by leveraging cutting-edge technology and delivering exceptional service.
In July 2024, DocVA introduced a comprehensive suite of virtual medical assistant services, revolutionizing healthcare operations. With years of experience in the industry, the company aims to streamline medical practices by offering skilled remote assistants for both administrative and clinical support tasks.
| Report Attributes | Details |
|---|---|
| Market Size in 2023 | USD 1.03 Billion |
| Market Size by 2032 | USD 12.99 Billion |
| CAGR | CAGR of 33.24% From 2024 to 2032 |
| Base Year | 2023 |
| Forecast Period | 2024-2032 |
| Historical Data | 2020-2022 |
| Report Scope & Coverage | Market Size, Segments Analysis, Competitive Landscape, Regional Analysis, DROC & SWOT Analysis, Forecast Outlook |
| Key Segments | • By Product (Smart Speakers, Chatbots) • By User Interface (Automatic Speech Recognition, Text-based, Text-to-speech, Others) • By End User (Healthcare Providers, Patients, Healthcare Payers, Other End Users) |
| Regional Analysis/Coverage | North America (US, Canada, Mexico), Europe (Eastern Europe [Poland, Romania, Hungary, Turkey, Rest of Eastern Europe] Western Europe] Germany, France, UK, Italy, Spain, Netherlands, Switzerland, Austria, Rest of Western Europe]), Asia Pacific (China, India, Japan, South Korea, Vietnam, Singapore, Australia, Rest of Asia Pacific), Middle East & Africa (Middle East [UAE, Egypt, Saudi Arabia, Qatar, Rest of Middle East], Africa [Nigeria, South Africa, Rest of Africa], Latin America (Brazil, Argentina, Colombia, Rest of Latin America) |
| Company Profiles | Microsoft, Nuance Communications Inc., Amazon, Sensly, HealthTap Inc., Infermedica, eGain Corporation, Babylon Healthcare Services Ltd, Verint Systems Inc., Kognito Solutions LLC, AliveCor, IBM Watson Health, Orbita, Ada Health, Pyramid Healthcare, MedeAnalytics, Baobab Health, Vivify Health |
| Key Drivers | • Growing Demand for Healthcare Digitization • Enhanced Patient Engagement and Experience • Alleviating the Healthcare Professional Shortage |
| Restraints | • A key restraint in the Healthcare Virtual Assistants Market is the concern surrounding data security and privacy. |
Ans:- The Healthcare Virtual Assistants Market size was valued at US$ 1290.85 million in 2023.
Amazon, Babylon Healthcare Services Limited, CSS Corporation, Health tap, Inc., Egain Corporation, Infermedica, Kognito Solutions, LLC, are the key players of Healthcare Virtual Assistants market
The global market for healthcare virtual assistants would be dominated by North America during the forecast period.
Medical errors and rising healthcare costs must be reduced, Increasing Need for High-Quality Healthcare are the key driver of the Healthcare Virtual Assistants market
Ans: The Healthcare Virtual Assistants Market is to grow at a CAGR of 34.8% over the forecast period 2024-2031.
Table of contents
1. Introduction
1.1 Market Definition
1.2 Scope (Inclusion and Exclusions)
1.3 Research Assumptions
2. Executive Summary
2.1 Market Overview
2.2 Regional Synopsis
2.3 Competitive Summary
3. Research Methodology
3.1 Top-Down Approach
3.2 Bottom-up Approach
3.3. Data Validation
3.4 Primary Interviews
4. Market Dynamics Impact Analysis
4.1 Market Driving Factors Analysis
4.1.1 Drivers
4.1.2 Restraints
4.1.3 Opportunities
4.1.4 Challenges
4.2 PESTLE Analysis
4.3 Porter’s Five Forces Model
5. Statistical Insights and Trends Reporting
5.1 Adoption Rates and Market Penetration (2023)
5.2 Usage Trends by Application (2023)
5.3 Voice and Chat-Based Interactions (2020-2032)
5.4 Technology Adoption by Region (2023)
5.5 Patient Engagement and Satisfaction Metrics (2023)
6. Competitive Landscape
6.1 List of Major Companies, By Region
6.2 Market Share Analysis, By Region
6.3 Product Benchmarking
6.3.1 Product specifications and features
6.3.2 Pricing
6.4 Strategic Initiatives
6.4.1 Marketing and Promotional Activities
6.4.2 Distribution and Supply Chain Strategies
6.4.3 Expansion plans and new Product launches
6.4.4 Strategic partnerships and collaborations
6.5 Technological Advancements
6.6 Market Positioning and Branding
7. Healthcare Virtual Assistants Market Segmentation, by Product
7.1 Chapter Overview
7.2 Smart Speakers
7.2.1 Smart Speakers Market Trends Analysis (2020-2032)
7.2.2 Smart Speakers Market Size Estimates and Forecasts to 2032 (USD Billion)
7.3 Chatbots
7.3.1 Chatbots Market Trends Analysis (2020-2032)
7.3.2 Chatbots Market Size Estimates and Forecasts to 2032 (USD Billion)
8. Healthcare Virtual Assistants Market Segmentation, by User Interface
8.1 Chapter Overview
8.2 Automatic Speech Recognition
8.2.1 Automatic Speech Recognition Market Trends Analysis (2020-2032)
8.2.2 Automatic Speech Recognition Market Size Estimates and Forecasts to 2032 (USD Billion)
8.3 Text-based
8.3.1 Text-based Market Trends Analysis (2020-2032)
8.3.2 Text-based Market Size Estimates and Forecasts to 2032 (USD Billion)
8.4 Text-to-speech
8.4.1 Text-to-speech Market Trends Analysis (2020-2032)
8.4.2 Text-to-speech Market Size Estimates and Forecasts to 2032 (USD Billion)
8.5 Others
8.5.1 Others Market Trends Analysis (2020-2032)
8.5.2 Others Market Size Estimates and Forecasts to 2032 (USD Billion)
9. Healthcare Virtual Assistants Market Segmentation, by End User
9.1 Chapter Overview
9.2 Healthcare Providers
9.2.1 Healthcare Providers Market Trends Analysis (2020-2032)
9.2.2 Healthcare Providers Market Size Estimates and Forecasts to 2032 (USD Billion)
9.3 Patients
9.3.1 Patients Market Trends Analysis (2020-2032)
9.3.2 Patients Market Size Estimates and Forecasts to 2032 (USD Billion)
9.4 Healthcare Payers
9.4.1 Healthcare Payers Market Trends Analysis (2020-2032)
9.4.2 Healthcare Payers Market Size Estimates and Forecasts to 2032 (USD Billion)
9.5 Other End Users
9.5.1 Other End Users Market Trends Analysis (2020-2032)
9.5.2 Other End Users Market Size Estimates and Forecasts to 2032 (USD Billion)
10. Regional Analysis
10.1 Chapter Overview
10.2 North America
10.2.1 Trends Analysis
10.2.2 North America Healthcare Virtual Assistants Market Estimates and Forecasts, by Country (2020-2032) (USD Billion)
10.2.3 North America Healthcare Virtual Assistants Market Estimates and Forecasts, by Product (2020-2032) (USD Billion)
10.2.4 North America Healthcare Virtual Assistants Market Estimates and Forecasts, by User Interface (2020-2032) (USD Billion)
10.2.5 North America Healthcare Virtual Assistants Market Estimates and Forecasts, by End User (2020-2032) (USD Billion)
10.2.6 USA
10.2.6.1 USA Healthcare Virtual Assistants Market Estimates and Forecasts, by Product (2020-2032) (USD Billion)
10.2.6.2 USA Healthcare Virtual Assistants Market Estimates and Forecasts, by User Interface (2020-2032) (USD Billion)
10.2.6.3 USA Healthcare Virtual Assistants Market Estimates and Forecasts, by End User (2020-2032) (USD Billion)
10.2.7 Canada
10.2.7.1 Canada Healthcare Virtual Assistants Market Estimates and Forecasts, by Product (2020-2032) (USD Billion)
10.2.7.2 Canada Healthcare Virtual Assistants Market Estimates and Forecasts, by User Interface (2020-2032) (USD Billion)
10.2.7.3 Canada Healthcare Virtual Assistants Market Estimates and Forecasts, by End User (2020-2032) (USD Billion)
10.2.8 Mexico
10.2.8.1 Mexico Healthcare Virtual Assistants Market Estimates and Forecasts, by Product (2020-2032) (USD Billion)
10.2.8.2 Mexico Healthcare Virtual Assistants Market Estimates and Forecasts, by User Interface (2020-2032) (USD Billion)
10.2.8.3 Mexico Healthcare Virtual Assistants Market Estimates and Forecasts, by End User (2020-2032) (USD Billion)
10.3 Europe
10.3.1 Eastern Europe
10.3.1.1 Trends Analysis
10.3.1.2 Eastern Europe Healthcare Virtual Assistants Market Estimates and Forecasts, by Country (2020-2032) (USD Billion)
10.3.1.3 Eastern Europe Healthcare Virtual Assistants Market Estimates and Forecasts, by Product (2020-2032) (USD Billion)
10.3.1.4 Eastern Europe Healthcare Virtual Assistants Market Estimates and Forecasts, by User Interface (2020-2032) (USD Billion)
10.3.1.5 Eastern Europe Healthcare Virtual Assistants Market Estimates and Forecasts, by End User (2020-2032) (USD Billion)
10.3.1.6 Poland
10.3.1.6.1 Poland Healthcare Virtual Assistants Market Estimates and Forecasts, by Product (2020-2032) (USD Billion)
10.3.1.6.2 Poland Healthcare Virtual Assistants Market Estimates and Forecasts, by User Interface (2020-2032) (USD Billion)
10.3.1.6.3 Poland Healthcare Virtual Assistants Market Estimates and Forecasts, by End User (2020-2032) (USD Billion)
10.3.1.7 Romania
10.3.1.7.1 Romania Healthcare Virtual Assistants Market Estimates and Forecasts, by Product (2020-2032) (USD Billion)
10.3.1.7.2 Romania Healthcare Virtual Assistants Market Estimates and Forecasts, by User Interface (2020-2032) (USD Billion)
10.3.1.7.3 Romania Healthcare Virtual Assistants Market Estimates and Forecasts, by End User (2020-2032) (USD Billion)
10.3.1.8 Hungary
10.3.1.8.1 Hungary Healthcare Virtual Assistants Market Estimates and Forecasts, by Product (2020-2032) (USD Billion)
10.3.1.8.2 Hungary Healthcare Virtual Assistants Market Estimates and Forecasts, by User Interface (2020-2032) (USD Billion)
10.3.1.8.3 Hungary Healthcare Virtual Assistants Market Estimates and Forecasts, by End User (2020-2032) (USD Billion)
10.3.1.9 turkey
10.3.1.9.1 Turkey Healthcare Virtual Assistants Market Estimates and Forecasts, by Product (2020-2032) (USD Billion)
10.3.1.9.2 Turkey Healthcare Virtual Assistants Market Estimates and Forecasts, by User Interface (2020-2032) (USD Billion)
10.3.1.9.3 Turkey Healthcare Virtual Assistants Market Estimates and Forecasts, by End User (2020-2032) (USD Billion)
10.3.1.10 Rest of Eastern Europe
10.3.1.10.1 Rest of Eastern Europe Healthcare Virtual Assistants Market Estimates and Forecasts, by Product (2020-2032) (USD Billion)
10.3.1.10.2 Rest of Eastern Europe Healthcare Virtual Assistants Market Estimates and Forecasts, by User Interface (2020-2032) (USD Billion)
10.3.1.10.3 Rest of Eastern Europe Healthcare Virtual Assistants Market Estimates and Forecasts, by End User (2020-2032) (USD Billion)
10.3.2 Western Europe
10.3.2.1 Trends Analysis
10.3.2.2 Western Europe Healthcare Virtual Assistants Market Estimates and Forecasts, by Country (2020-2032) (USD Billion)
10.3.2.3 Western Europe Healthcare Virtual Assistants Market Estimates and Forecasts, by Product (2020-2032) (USD Billion)
10.3.2.4 Western Europe Healthcare Virtual Assistants Market Estimates and Forecasts, by User Interface (2020-2032) (USD Billion)
10.3.2.5 Western Europe Healthcare Virtual Assistants Market Estimates and Forecasts, by End User (2020-2032) (USD Billion)
10.3.2.6 Germany
10.3.2.6.1 Germany Healthcare Virtual Assistants Market Estimates and Forecasts, by Product (2020-2032) (USD Billion)
10.3.2.6.2 Germany Healthcare Virtual Assistants Market Estimates and Forecasts, by User Interface (2020-2032) (USD Billion)
10.3.2.6.3 Germany Healthcare Virtual Assistants Market Estimates and Forecasts, by End User (2020-2032) (USD Billion)
10.3.2.7 France
10.3.2.7.1 France Healthcare Virtual Assistants Market Estimates and Forecasts, by Product (2020-2032) (USD Billion)
10.3.2.7.2 France Healthcare Virtual Assistants Market Estimates and Forecasts, by User Interface (2020-2032) (USD Billion)
10.3.2.7.3 France Healthcare Virtual Assistants Market Estimates and Forecasts, by End User (2020-2032) (USD Billion)
10.3.2.8 UK
10.3.2.8.1 UK Healthcare Virtual Assistants Market Estimates and Forecasts, by Product (2020-2032) (USD Billion)
10.3.2.8.2 UK Healthcare Virtual Assistants Market Estimates and Forecasts, by User Interface (2020-2032) (USD Billion)
10.3.2.8.3 UK Healthcare Virtual Assistants Market Estimates and Forecasts, by End User (2020-2032) (USD Billion)
10.3.2.9 Italy
10.3.2.9.1 Italy Healthcare Virtual Assistants Market Estimates and Forecasts, by Product (2020-2032) (USD Billion)
10.3.2.9.2 Italy Healthcare Virtual Assistants Market Estimates and Forecasts, by User Interface (2020-2032) (USD Billion)
10.3.2.9.3 Italy Healthcare Virtual Assistants Market Estimates and Forecasts, by End User (2020-2032) (USD Billion)
10.3.2.10 Spain
10.3.2.10.1 Spain Healthcare Virtual Assistants Market Estimates and Forecasts, by Product (2020-2032) (USD Billion)
10.3.2.10.2 Spain Healthcare Virtual Assistants Market Estimates and Forecasts, by User Interface (2020-2032) (USD Billion)
10.3.2.10.3 Spain Healthcare Virtual Assistants Market Estimates and Forecasts, by End User (2020-2032) (USD Billion)
10.3.2.11 Netherlands
10.3.2.11.1 Netherlands Healthcare Virtual Assistants Market Estimates and Forecasts, by Product (2020-2032) (USD Billion)
10.3.2.11.2 Netherlands Healthcare Virtual Assistants Market Estimates and Forecasts, by User Interface (2020-2032) (USD Billion)
10.3.2.11.3 Netherlands Healthcare Virtual Assistants Market Estimates and Forecasts, by End User (2020-2032) (USD Billion)
10.3.2.12 Switzerland
10.3.2.12.1 Switzerland Healthcare Virtual Assistants Market Estimates and Forecasts, by Product (2020-2032) (USD Billion)
10.3.2.12.2 Switzerland Healthcare Virtual Assistants Market Estimates and Forecasts, by User Interface (2020-2032) (USD Billion)
10.3.2.12.3 Switzerland Healthcare Virtual Assistants Market Estimates and Forecasts, by End User (2020-2032) (USD Billion)
10.3.2.13 Austria
10.3.2.13.1 Austria Healthcare Virtual Assistants Market Estimates and Forecasts, by Product (2020-2032) (USD Billion)
10.3.2.13.2 Austria Healthcare Virtual Assistants Market Estimates and Forecasts, by User Interface (2020-2032) (USD Billion)
10.3.2.13.3 Austria Healthcare Virtual Assistants Market Estimates and Forecasts, by End User (2020-2032) (USD Billion)
10.3.2.14 Rest of Western Europe
10.3.2.14.1 Rest of Western Europe Healthcare Virtual Assistants Market Estimates and Forecasts, by Product (2020-2032) (USD Billion)
10.3.2.14.2 Rest of Western Europe Healthcare Virtual Assistants Market Estimates and Forecasts, by User Interface (2020-2032) (USD Billion)
10.3.2.14.3 Rest of Western Europe Healthcare Virtual Assistants Market Estimates and Forecasts, by End User (2020-2032) (USD Billion)
10.4 Asia Pacific
10.4.1 Trends Analysis
10.4.2 Asia Pacific Healthcare Virtual Assistants Market Estimates and Forecasts, by Country (2020-2032) (USD Billion)
10.4.3 Asia Pacific Healthcare Virtual Assistants Market Estimates and Forecasts, by Product (2020-2032) (USD Billion)
10.4.4 Asia Pacific Healthcare Virtual Assistants Market Estimates and Forecasts, by User Interface (2020-2032) (USD Billion)
10.4.5 Asia Pacific Healthcare Virtual Assistants Market Estimates and Forecasts, by End User (2020-2032) (USD Billion)
10.4.6 China
10.4.6.1 China Healthcare Virtual Assistants Market Estimates and Forecasts, by Product (2020-2032) (USD Billion)
10.4.6.2 China Healthcare Virtual Assistants Market Estimates and Forecasts, by User Interface (2020-2032) (USD Billion)
10.4.6.3 China Healthcare Virtual Assistants Market Estimates and Forecasts, by End User (2020-2032) (USD Billion)
10.4.7 India
10.4.7.1 India Healthcare Virtual Assistants Market Estimates and Forecasts, by Product (2020-2032) (USD Billion)
10.4.7.2 India Healthcare Virtual Assistants Market Estimates and Forecasts, by User Interface (2020-2032) (USD Billion)
10.4.7.3 India Healthcare Virtual Assistants Market Estimates and Forecasts, by End User (2020-2032) (USD Billion)
10.4.8 Japan
10.4.8.1 Japan Healthcare Virtual Assistants Market Estimates and Forecasts, by Product (2020-2032) (USD Billion)
10.4.8.2 Japan Healthcare Virtual Assistants Market Estimates and Forecasts, by User Interface (2020-2032) (USD Billion)
10.4.8.3 Japan Healthcare Virtual Assistants Market Estimates and Forecasts, by End User (2020-2032) (USD Billion)
10.4.9 South Korea
10.4.9.1 South Korea Healthcare Virtual Assistants Market Estimates and Forecasts, by Product (2020-2032) (USD Billion)
10.4.9.2 South Korea Healthcare Virtual Assistants Market Estimates and Forecasts, by User Interface (2020-2032) (USD Billion)
10.4.9.3 South Korea Healthcare Virtual Assistants Market Estimates and Forecasts, by End User (2020-2032) (USD Billion)
10.4.10 Vietnam
10.4.10.1 Vietnam Healthcare Virtual Assistants Market Estimates and Forecasts, by Product (2020-2032) (USD Billion)
10.4.10.2 Vietnam Healthcare Virtual Assistants Market Estimates and Forecasts, by User Interface (2020-2032) (USD Billion)
10.4.10.3 Vietnam Healthcare Virtual Assistants Market Estimates and Forecasts, by End User (2020-2032) (USD Billion)
10.4.11 Singapore
10.4.11.1 Singapore Healthcare Virtual Assistants Market Estimates and Forecasts, by Product (2020-2032) (USD Billion)
10.4.11.2 Singapore Healthcare Virtual Assistants Market Estimates and Forecasts, by User Interface (2020-2032) (USD Billion)
10.4.11.3 Singapore Healthcare Virtual Assistants Market Estimates and Forecasts, by End User (2020-2032) (USD Billion)
10.4.12 Australia
10.4.12.1 Australia Healthcare Virtual Assistants Market Estimates and Forecasts, by Product (2020-2032) (USD Billion)
10.4.12.2 Australia Healthcare Virtual Assistants Market Estimates and Forecasts, by User Interface (2020-2032) (USD Billion)
10.4.12.3 Australia Healthcare Virtual Assistants Market Estimates and Forecasts, by End User (2020-2032) (USD Billion)
10.4.13 Rest of Asia Pacific
10.4.13.1 Rest of Asia Pacific Healthcare Virtual Assistants Market Estimates and Forecasts, by Product (2020-2032) (USD Billion)
10.4.13.2 Rest of Asia Pacific Healthcare Virtual Assistants Market Estimates and Forecasts, by User Interface (2020-2032) (USD Billion)
10.4.13.3 Rest of Asia Pacific Healthcare Virtual Assistants Market Estimates and Forecasts, by End User (2020-2032) (USD Billion)
10.5 Middle East and Africa
10.5.1 Middle East
10.5.1.1 Trends Analysis
10.5.1.2 Middle East Healthcare Virtual Assistants Market Estimates and Forecasts, by Country (2020-2032) (USD Billion)
10.5.1.3 Middle East Healthcare Virtual Assistants Market Estimates and Forecasts, by Product (2020-2032) (USD Billion)
10.5.1.4 Middle East Healthcare Virtual Assistants Market Estimates and Forecasts, by User Interface (2020-2032) (USD Billion)
10.5.1.5 Middle East Healthcare Virtual Assistants Market Estimates and Forecasts, by End User (2020-2032) (USD Billion)
10.5.1.6 UAE
10.5.1.6.1 UAE Healthcare Virtual Assistants Market Estimates and Forecasts, by Product (2020-2032) (USD Billion)
10.5.1.6.2 UAE Healthcare Virtual Assistants Market Estimates and Forecasts, by User Interface (2020-2032) (USD Billion)
10.5.1.6.3 UAE Healthcare Virtual Assistants Market Estimates and Forecasts, by End User (2020-2032) (USD Billion)
10.5.1.7 Egypt
10.5.1.7.1 Egypt Healthcare Virtual Assistants Market Estimates and Forecasts, by Product (2020-2032) (USD Billion)
10.5.1.7.2 Egypt Healthcare Virtual Assistants Market Estimates and Forecasts, by User Interface (2020-2032) (USD Billion)
10.5.1.7.3 Egypt Healthcare Virtual Assistants Market Estimates and Forecasts, by End User (2020-2032) (USD Billion)
10.5.1.8 Saudi Arabia
10.5.1.8.1 Saudi Arabia Healthcare Virtual Assistants Market Estimates and Forecasts, by Product (2020-2032) (USD Billion)
10.5.1.8.2 Saudi Arabia Healthcare Virtual Assistants Market Estimates and Forecasts, by User Interface (2020-2032) (USD Billion)
10.5.1.8.3 Saudi Arabia Healthcare Virtual Assistants Market Estimates and Forecasts, by End User (2020-2032) (USD Billion)
10.5.1.9 Qatar
10.5.1.9.1 Qatar Healthcare Virtual Assistants Market Estimates and Forecasts, by Product (2020-2032) (USD Billion)
10.5.1.9.2 Qatar Healthcare Virtual Assistants Market Estimates and Forecasts, by User Interface (2020-2032) (USD Billion)
10.5.1.9.3 Qatar Healthcare Virtual Assistants Market Estimates and Forecasts, by End User (2020-2032) (USD Billion)
10.5.1.10 Rest of Middle East
10.5.1.10.1 Rest of Middle East Healthcare Virtual Assistants Market Estimates and Forecasts, by Product (2020-2032) (USD Billion)
10.5.1.10.2 Rest of Middle East Healthcare Virtual Assistants Market Estimates and Forecasts, by User Interface (2020-2032) (USD Billion)
10.5.1.10.3 Rest of Middle East Healthcare Virtual Assistants Market Estimates and Forecasts, by End User (2020-2032) (USD Billion)
10.5.2 Africa
10.5.2.1 Trends Analysis
10.5.2.2 Africa Healthcare Virtual Assistants Market Estimates and Forecasts, by Country (2020-2032) (USD Billion)
10.5.2.3 Africa Healthcare Virtual Assistants Market Estimates and Forecasts, by Product (2020-2032) (USD Billion)
10.5.2.4 Africa Healthcare Virtual Assistants Market Estimates and Forecasts, by User Interface (2020-2032) (USD Billion)
10.5.2.5 Africa Healthcare Virtual Assistants Market Estimates and Forecasts, by End User (2020-2032) (USD Billion)
10.5.2.6 South Africa
10.5.2.6.1 South Africa Healthcare Virtual Assistants Market Estimates and Forecasts, by Product (2020-2032) (USD Billion)
10.5.2.6.2 South Africa Healthcare Virtual Assistants Market Estimates and Forecasts, by User Interface (2020-2032) (USD Billion)
10.5.2.6.3 South Africa Healthcare Virtual Assistants Market Estimates and Forecasts, by End User (2020-2032) (USD Billion)
10.5.2.7 Nigeria
10.5.2.7.1 Nigeria Healthcare Virtual Assistants Market Estimates and Forecasts, by Product (2020-2032) (USD Billion)
10.5.2.7.2 Nigeria Healthcare Virtual Assistants Market Estimates and Forecasts, by User Interface (2020-2032) (USD Billion)
10.5.2.7.3 Nigeria Healthcare Virtual Assistants Market Estimates and Forecasts, by End User (2020-2032) (USD Billion)
10.5.2.8 Rest of Africa
10.5.2.8.1 Rest of Africa Healthcare Virtual Assistants Market Estimates and Forecasts, by Product (2020-2032) (USD Billion)
10.5.2.8.2 Rest of Africa Healthcare Virtual Assistants Market Estimates and Forecasts, by User Interface (2020-2032) (USD Billion)
10.5.2.8.3 Rest of Africa Healthcare Virtual Assistants Market Estimates and Forecasts, by End User (2020-2032) (USD Billion)
10.6 Latin America
10.6.1 Trends Analysis
10.6.2 Latin America Healthcare Virtual Assistants Market Estimates and Forecasts, by Country (2020-2032) (USD Billion)
10.6.3 Latin America Healthcare Virtual Assistants Market Estimates and Forecasts, by Product (2020-2032) (USD Billion)
10.6.4 Latin America Healthcare Virtual Assistants Market Estimates and Forecasts, by User Interface (2020-2032) (USD Billion)
10.6.5 Latin America Healthcare Virtual Assistants Market Estimates and Forecasts, by End User (2020-2032) (USD Billion)
10.6.6 Brazil
10.6.6.1 Brazil Healthcare Virtual Assistants Market Estimates and Forecasts, by Product (2020-2032) (USD Billion)
10.6.6.2 Brazil Healthcare Virtual Assistants Market Estimates and Forecasts, by User Interface (2020-2032) (USD Billion)
10.6.6.3 Brazil Healthcare Virtual Assistants Market Estimates and Forecasts, by End User (2020-2032) (USD Billion)
10.6.7 Argentina
10.6.7.1 Argentina Healthcare Virtual Assistants Market Estimates and Forecasts, by Product (2020-2032) (USD Billion)
10.6.7.2 Argentina Healthcare Virtual Assistants Market Estimates and Forecasts, by User Interface (2020-2032) (USD Billion)
10.6.7.3 Argentina Healthcare Virtual Assistants Market Estimates and Forecasts, by End User (2020-2032) (USD Billion)
10.6.8 Colombia
10.6.8.1 Colombia Healthcare Virtual Assistants Market Estimates and Forecasts, by Product (2020-2032) (USD Billion)
10.6.8.2 Colombia Healthcare Virtual Assistants Market Estimates and Forecasts, by User Interface (2020-2032) (USD Billion)
10.6.8.3 Colombia Healthcare Virtual Assistants Market Estimates and Forecasts, by End User (2020-2032) (USD Billion)
10.6.9 Rest of Latin America
10.6.9.1 Rest of Latin America Healthcare Virtual Assistants Market Estimates and Forecasts, by Product (2020-2032) (USD Billion)
10.6.9.2 Rest of Latin America Healthcare Virtual Assistants Market Estimates and Forecasts, by User Interface (2020-2032) (USD Billion)
10.6.9.3 Rest of Latin America Healthcare Virtual Assistants Market Estimates and Forecasts, by End User (2020-2032) (USD Billion)
11. Company Profiles
11.1 Microsoft
11.1.1 Company Overview
11.1.2 Financial
11.1.3 Product / Services Offered
11.1.4 SWOT Analysis
11.2 Nuance Communications Inc.
11.2.1 Company Overview
11.2.2 Financial
11.2.3 Product / Services Offered
11.2.4 SWOT Analysis
11.3 amazon
11.3.1 Company Overview
11.3.2 Financial
11.3.3 Product / Services Offered
11.3.4 SWOT Analysis
11.4 HealthTap Inc.
11.4.1 Company Overview
11.4.2 Financial
11.4.3 Product / Services Offered
11.4.4 SWOT Analysis
11.5 eGain Corporation
11.5.1 Company Overview
11.5.2 Financial
11.5.3 Product / Services Offered
11.5.4 SWOT Analysis
11.6 Babylon Healthcare Services Ltd
11.6.1 Company Overview
11.6.2 Financial
11.6.3 Product / Services Offered
11.6.4 SWOT Analysis
11.7 Verint Systems Inc.
11.7.1 Company Overview
11.7.2 Financial
11.7.3 Product / Services Offered
11.7.4 SWOT Analysis
11.8 IBM Watson Health
11.8.1 Company Overview
11.8.2 Financial
11.8.3 Product / Services Offered
11.8.4 SWOT Analysis
11.9 Pyramid Healthcare
11.9.1 Company Overview
11.9.2 Financial
11.9.3 Product / Services Offered
11.9.4 SWOT Analysis
11.10 Kognito Solutions LLC
11.10.1 Company Overview
11.10.2 Financial
11.10.3 Product / Services Offered
11.10.4 SWOT Analysis
12. Use Cases and Best Practices
13. Conclusion
An accurate research report requires proper strategizing as well as implementation. There are multiple factors involved in the completion of good and accurate research report and selecting the best methodology to compete the research is the toughest part. Since the research reports we provide play a crucial role in any company’s decision-making process, therefore we at SNS Insider always believe that we should choose the best method which gives us results closer to reality. This allows us to reach at a stage wherein we can provide our clients best and accurate investment to output ratio.
Each report that we prepare takes a timeframe of 350-400 business hours for production. Starting from the selection of titles through a couple of in-depth brain storming session to the final QC process before uploading our titles on our website we dedicate around 350 working hours. The titles are selected based on their current market cap and the foreseen CAGR and growth.
The 5 steps process:
Step 1: Secondary Research:
Secondary Research or Desk Research is as the name suggests is a research process wherein, we collect data through the readily available information. In this process we use various paid and unpaid databases which our team has access to and gather data through the same. This includes examining of listed companies’ annual reports, Journals, SEC filling etc. Apart from this our team has access to various associations across the globe across different industries. Lastly, we have exchange relationships with various university as well as individual libraries.

Step 2: Primary Research
When we talk about primary research, it is a type of study in which the researchers collect relevant data samples directly, rather than relying on previously collected data. This type of research is focused on gaining content specific facts that can be sued to solve specific problems. Since the collected data is fresh and first hand therefore it makes the study more accurate and genuine.
We at SNS Insider have divided Primary Research into 2 parts.
Part 1 wherein we interview the KOLs of major players as well as the upcoming ones across various geographic regions. This allows us to have their view over the market scenario and acts as an important tool to come closer to the accurate market numbers. As many as 45 paid and unpaid primary interviews are taken from both the demand and supply side of the industry to make sure we land at an accurate judgement and analysis of the market.
This step involves the triangulation of data wherein our team analyses the interview transcripts, online survey responses and observation of on filed participants. The below mentioned chart should give a better understanding of the part 1 of the primary interview.

Part 2: In this part of primary research the data collected via secondary research and the part 1 of the primary research is validated with the interviews from individual consultants and subject matter experts.
Consultants are those set of people who have at least 12 years of experience and expertise within the industry whereas Subject Matter Experts are those with at least 15 years of experience behind their back within the same space. The data with the help of two main processes i.e., FGDs (Focused Group Discussions) and IDs (Individual Discussions). This gives us a 3rd party nonbiased primary view of the market scenario making it a more dependable one while collation of the data pointers.
Step 3: Data Bank Validation
Once all the information is collected via primary and secondary sources, we run that information for data validation. At our intelligence centre our research heads track a lot of information related to the market which includes the quarterly reports, the daily stock prices, and other relevant information. Our data bank server gets updated every fortnight and that is how the information which we collected using our primary and secondary information is revalidated in real time.

Step 4: QA/QC Process
After all the data collection and validation our team does a final level of quality check and quality assurance to get rid of any unwanted or undesired mistakes. This might include but not limited to getting rid of the any typos, duplication of numbers or missing of any important information. The people involved in this process include technical content writers, research heads and graphics people. Once this process is completed the title gets uploader on our platform for our clients to read it.
Step 5: Final QC/QA Process:
This is the last process and comes when the client has ordered the study. In this process a final QA/QC is done before the study is emailed to the client. Since we believe in giving our clients a good experience of our research studies, therefore, to make sure that we do not lack at our end in any way humanly possible we do a final round of quality check and then dispatch the study to the client.
By Product
Smart Speakers
Chatbots
By User Interface
Automatic Speech Recognition
Text-based
Text-to-speech
Others
By End User
Healthcare Providers
Patients
Other End Users
Request for Segment Customization as per your Business Requirement: Segment Customization Request
Regional Coverage:
North America
US
Canada
Mexico
Europe
Eastern Europe
Poland
Romania
Hungary
Turkey
Rest of Eastern Europe
Western Europe
Germany
France
UK
Italy
Spain
Netherlands
Switzerland
Austria
Rest of Western Europe
Asia Pacific
China
India
Japan
South Korea
Vietnam
Singapore
Australia
Rest of Asia Pacific
Middle East & Africa
Middle East
UAE
Egypt
Saudi Arabia
Qatar
Rest of the Middle East
Africa
Nigeria
South Africa
Rest of Africa
Latin America
Brazil
Argentina
Colombia
Rest of Latin America
Request for Country Level Research Report: Country Level Customization Request
Available Customization
With the given market data, SNS Insider offers customization to meet the company’s specific needs. The following customization options are available for the report:
Product Analysis
Criss-Cross segment analysis (e.g. Product X Application)
Product Matrix which gives a detailed comparison of the product portfolio of each company
Geographic Analysis
Additional countries in any of the regions
Company Information
Detailed analysis and profiling of additional market players (Up to five)
The Pet Sitting Market was valued at USD 2.62 billion in 2023 and is expected to reach USD 6.5 billion by 2032, growing at a CAGR of 10.64% over the forecast period 2024-2032.
Pathology Laboratories Market was valued at USD 355.56 billion in 2023 and is expected to reach USD 720.60 billion by 2032, growing at a CAGR of 8.13% from 2024-2032.
Dimpleplasty Market was valued at USD 320.31 million in 2023 and is expected to reach USD 473.28 million by 2032, growing at a CAGR of 4.46% from 2024-2032.
The Healthcare Information Technology Market Size was valued at USD 229.43 billion in 2023, and is expected to reach USD 1827.12 billion by 2031 and grow at a CAGR of 29.61% over the forecast period 2024-2031.
The Medical Clothing Market, valued at USD 110 Billion in 2023, The Medical Clothing Market valued USD 85.95 Billion in 2023 and anticipated to reach USD 163.84 billion by 2032 with compound annual growth rate 7.45% over the forecast period 2024-2032.
The Electrosurgical Devices Market Size was valued at USD 5.4 Billion in 2023, and is expected to reach USD 7.7 Billion by 2032, and grow at a CAGR of 4.1% over the forecast period 2024-2032.

Hi! Click one of our member below to chat on Phone
© 2025 All Rights Reserved by SNS Insider Pvt Ltd


