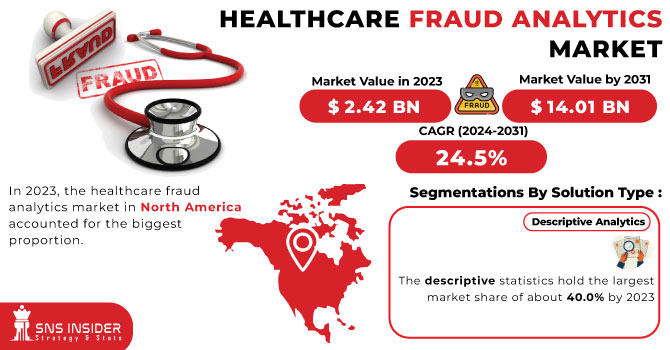
Healthcare Fraud Analytics Market Size was valued at USD 2.36 Billion in 2023 and is expected to reach USD 17.6 Billion by 2032, growing at a CAGR of 25% over the forecast period 2024-2032. The Healthcare Fraud Analytics Market Report provides valuable information on the detection rates of fraud, financial losses, key drivers of the market, and the increasing adoption of AI and machine learning. It provides breakdowns of types of fraud and frequency by region, with emphasis on billing fraud, identity theft, and false claims. Furthermore, the report assesses the investments in fraud analytics solutions over time across the public and private sectors and also assesses the effect of regulatory compliance (HIPAA, GDPR) on fraud detection. The new report also compares cloud-based vs. on-premise fraud analytics adoption, illustrating the overall shift of the industry towards advanced, scalable fraud detection technologies. The healthcare fraud analytics market is driven by the increasing sophistication of fraudulent activities in the healthcare sector.
Get more information on Healthcare Fraud Analytics Market - Request Sample Report
Drivers
The increasing prevalence of fraudulent activities in the healthcare sector necessitates advanced analytics solutions for effective detection and prevention.
The rising occurrence of healthcare fraud has become a major issue and has led to the implementation of advanced analytics solutions for efficient detection and prevention. In Q1 2024, Americans lost more than USD 16 million to numerous healthcare fraud schemes-as the Federal Trade Commission (FTC) received 16,396 fraud reports, 53% of which reported losing money. The median loss per incident was USD 258, with most fraudulent activities being made via calls and payments via credit cards. Florida emerged as a hotspot, contributing 1,562 complaints during this period. A particularly worrisome trend is the rise of fraudulent medical treatments and cures. In the first quarter of 2024, losses in this category amounted to USD 12 million, a staggering 1,100 percent increase compared to the same quarter last year. Such a sharp increase highlights the critical need for strong fraud detection mechanisms to protect consumers against fraudulent medical claims. Moreover, systemic issues such as "ghost networks" exacerbate the problem. A class-action lawsuit filed in November 2024 accused Anthem Blue Cross Blue Shield of New York of maintaining inaccurate directories of mental health providers. Investigations revealed that out of 100 listed providers, only seven were available for appointments, highlighting the deceptive practices that hinder patient access to legitimate care.
Restraint:
Handling sensitive patient information requires robust data protection measures, posing challenges in the implementation of fraud analytics solutions.
Data privacy and security concerns significantly hinder the adoption of healthcare fraud analytics solutions. The healthcare sector has become a prime target for cyberattacks, with 84% of organizations experiencing at least one incident in the past year. These breaches often lead to severe financial repercussions, as evidenced by the average cost of a healthcare data breach reaching USD 9.8 million in 2024. The sensitivity of protected health information (PHI) exacerbates these concerns, as unauthorized access can result in identity theft, financial fraud, and compromised patient trust. For instance, in 2024, hacking and IT incidents accounted for 81.2% of large healthcare data breaches, exposing over 259 million records. The implementation of fraud analytics necessitates access to vast amounts of sensitive data, raising fears about potential vulnerabilities and unauthorized disclosures. Consequently, healthcare organizations may hesitate to adopt these solutions, prioritizing the protection of patient information over the integration of advanced analytics tools. This cautious approach underscores the critical need for robust security measures and compliance with stringent data protection regulations to foster trust and facilitate the adoption of fraud analytics in the healthcare industry.
Opportunity:
Innovations in artificial intelligence and machine learning enhance the capabilities of fraud detection systems, offering more efficient and accurate identification of fraudulent activities.
AI and ML are also used for healthcare fraud detection, as monitoring searches for anomalies in the data ensures a consistently high level of performance. Recent innovation has shown that AI-based solutions are feasible here. Moreover, the U.S. Department of Justice's Fraud Section reported a substantial increase in enforcement actions in 2024, charging 234 individuals and securing 252 convictions related to healthcare fraud. This increase can be partly attributed to the adoption of advanced data analytics and AI technologies that have improved the ability to detect and prosecute complex fraud schemes.
According to the National Health Care Anti-Fraud Association, healthcare fraud accounts for as much as USD 68 billion a year in costs to the U.S. industry. Adopting AI-powered fraud detection tools led to a 30% decrease in false positives and a 45% increase in detection accuracy. These statistics demonstrate the financial and operational advantages of implementing AI technologies in the fight against healthcare fraud. These developments illustrate the transformative impact of AI and ML in healthcare fraud detection, offering robust tools to identify and prevent fraudulent activities, thereby safeguarding financial resources and ensuring compliance within the healthcare system.
Challenge:
Incorporating advanced fraud analytics into existing healthcare infrastructures can be complex due to compatibility issues with outdated systems.
The lack of governance mechanisms, however, such as Healthcare data privacy and security, is one of the major challenges in adopting Healthcare Fraud Analytics Solutions. The healthcare sector has been singled out as a key target of cyberattacks with 84% of organizations reporting that they had at least one incident during the last year. Such breaches often carry heavy financial penalties in 2024, the average cost of a healthcare data breach was USD 9.8 million. These challenges are particularly problematic because of the sensitivity of protected health information (PHI) unauthorized access which can cause identity theft, financial fraud, and violate patient trust. For example, in 2024, hacking & IT incidents represented 81.2% of large-scale healthcare data breaches, exposing more than 259 million records. As part of implementing fraud analytics, there will be potential access to huge amounts of sensitive data that can spark fears of destroyed integrity and unauthorized disclosures. As a result, healthcare organizations might be reluctant to implement these solutions, putting more emphasis on safeguarding patient information than utilizing cutting-edge analytics solutions. This prudential stance emphasizes the necessity of stringent security protocols and adherence to rigorous data privacy laws to ensure confidence and encourage the implementation of fraud analytics in healthcare.
By Solution Type
In 2023, the descriptive analytics segment accounted for the largest market share, over 39%. The popularity of this method can be attributed to several reasons, such as its capability to give an overview of historical information as well as spotting patterns that can help characterize fraudulent activities. Through descriptive analytics, healthcare organizations can gain valuable insights into historical trends and past behaviours so that anomalies and potential fraud can be detected in a more timely manner. In fiscal year 2023, the U.S. Centers for Medicare & Medicaid Services (CMS) said descriptive analytics found USD 1.87 billion in improper payments through its Fraud Prevention System (FPS). The figures above show a significant increase over previous years and a maturing in the value that descriptive analytics can provide for fraud detection.
Additionally, the U.S. Department of Health and Human Services’ Office of Inspector General (OIG) reported that descriptive analytics were key in identifying 1,648 providers for fraud investigations in 2023. This resulted in 324 law enforcement actions and the recovery of USD 496 million in fraudulent claims. Because descriptive analytics is more accessible and interpretable than other statistical methods, it can be adopted by healthcare organizations of any size. Its ability to provide clear, actionable insights without requiring advanced statistical knowledge has contributed to its widespread adoption across the industry.
By Delivery Model
In 2023, the on-premise segment held the majority of revenue share 52%. This remarkable market share can be primarily ascribed to various factors including the improved security and control of on-premise solutions that aid healthcare organizations in handling sensitive patient data accompanied by financial information. In 2023, 713 healthcare data breaches involving more than 51 million individuals occurred, according to the Office for Civil Rights within the U.S. Department of Health and Human Services. This one statistic highlights the need for strong data security measures within the healthcare space. On-premise solutions offer organizations extensive control over their data and security protocols, which is critical when working with personal healthcare information and fraud detection operations.
In 2023, healthcare-related cybersecurity crimes caused over USD 4.6 billion in losses, according to the Federal Bureau of Investigation (FBI). Such exorbitant figures have led to a focus for many healthcare organizations to prioritize on-premise solutions that provide additional security features and compliance with strict data protection regulations, including HIPAA. Furthermore, the U.S. Government Accountability Office (GAO) found that federal agencies and organizations within the healthcare sector are increasingly choosing to deploy on-premise solutions for vital systems so that they can maintain direct control of their data and minimize exposure to outside threats. This further contributes to the market share of on-premise delivery models in the healthcare fraud analytics market.
By Application
The insurance claims review segment held the largest market share of over 35% in 2023. This significant market share can be attributed to the critical role that insurance claims review plays in detecting and preventing healthcare fraud, waste, and abuse. According to the National Health Care Anti-Fraud Association (NHCAA), the United States loses tens of billions of dollars to healthcare fraud each year. The Centers for Medicare & Medicaid Services (CMS) reported that in fiscal year 2023, improper payments in Medicare Fee-for-Service (FFS) programs amounted to USD 31.6 billion, representing an improper payment rate of 7.7%. This staggering figure highlights the urgent need for robust insurance claims review processes.
The U.S. Department of Justice (DOJ) reported that in 2023, it recovered over USD 1.8 billion from healthcare fraud cases related to false claims submitted to federal healthcare programs. This statistic underscores the effectiveness of advanced analytics in identifying and investigating fraudulent insurance claims. Furthermore, the Office of Inspector General (OIG) of the Department of Health and Human Services stated that their use of advanced analytics in claims review led to the identification of USD 3.2 billion in expected investigative recoveries in fiscal year 2023. This demonstrates the significant financial impact of implementing sophisticated insurance claims review processes.
By End-user
Public & government organizations accounted for the largest share of more than 41.0% of the healthcare fraud analytics market in 2023. The substantial market share can be linked to the large-scale media commitment by government organizations to prevent misuse of social security and other health programs against monetary loss. According to the CMS Report for Fiscal Year 2023, the CMS Fraud Prevention System (FPS) identified or prevented $1.87 billion in improper payments. As public agencies have started using this sophisticated analytics system, this is proof that the government is committed to using cutting-edge technologies for fraud detection as well as prevention.
The U.S. Department of Health and Human Services Office of Inspector General (HHS-OIG) released a report stating that their investigative enforcement activity in 2023 led to a total of 1,648 criminal actions against individuals or entities whose actions violated Medicare and Medicaid. They also excluded 3,005 individuals and entities from participation in Federal health care programs. They also show the power of fraud analytics used by government agencies to detect and prevent fraud. In addition, the Department of Justice (DOJ) reported that it secured over USD 2.68 billion in settlements and judgments in civil cases involving fraud and false claims against the government during the fiscal year 2023. Almost half of these recovery actions were related to healthcare fraud, demonstrating the important role of public agencies in using fraud analytics to combat cheating in government healthcare programs.
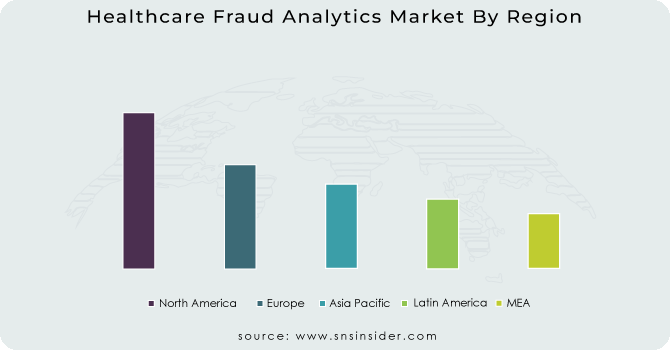
In 2023, North America held the largest market share of healthcare fraud analytics, accounting for around 39% of the total market share. The dominance can be ascribed to the region's advanced healthcare infrastructure, high adoption rate of digital health technologies, and stringent regulatory environment. In particular, the United States has served as a pioneer in the deployment of methods for the analytics of healthcare fraud. In the United States, recoveries from healthcare fraud investigations totaled more than USD 1.72 billion for 2023, including nearly USD 1.2 billion returned to the Medicare Trust Funds, according to estimations from the U.S. Department of Health and Human Services (HHS). This significant recovery demonstrates the effectiveness and widespread use of fraud analytics in the region.
The Asia Pacific region is projected to record the highest compound annual growth rate (CAGR) during the forecast period. The market's notable advancement is primarily driven by several factors including an increase in healthcare expenditure, growing concern regarding healthcare fraud, and government initiatives to incorporate advanced analytics solutions into the healthcare landscape. Cases of medical insurance fraud grew 15% in Japan in 2023 compared to 2022, according to data from Japan's Ministry of Health, Labour and Welfare. The growth of fraudulent activities is leading the government to invest in advanced analytics solutions, which is adding to the region's swift market growth. In late 2023, China's National Healthcare Security Administration said it rolled out a national fraud detection system that uncovered more than 500,000 suspicious claims in the system’s first six months. This initiative underscores the increasing adoption of healthcare fraud analytics in the Asia Pacific region and corroborates its anticipated high growth rate.
Need any customization research on Healthcare Fraud Analytics Market - Enquiry Now
Key Service Providers/Manufacturers
IBM Corporation (US) (IBM Watson Health, IBM Safer Payments)
Optum, Inc. (US) (Optum Program Integrity, Optum Fraud Waste & Abuse Detection)
SAS Institute Inc. (US) (SAS Fraud Framework, SAS Detection and Investigation for Health Care)
LexisNexis Risk Solutions (US) (LexisNexis Fraud Intelligence, LexisNexis Risk Management Solutions)
Veradigm (US) (Veradigm AccelRx, Veradigm ePrescribe)
Feedzai (Portugal) (Feedzai Enterprise, Feedzai Solutions)
Change Healthcare (US) (ClaimsXten, Payment Accuracy Solutions)
Cotiviti, Inc (US) (Fraud Waste and Abuse Detection, Payment Accuracy)
HMS Holdings Corp. (US) (Program Integrity Services, Payment Integrity Solutions)
Pondera Solutions, Inc. (US) (Fraud Detection as a Service, FraudCaster)
Users:
UnitedHealth Group (US)
Anthem, Inc. (US)
Aetna Inc. (US)
Cigna Corporation (US)
Humana Inc. (US)
Kaiser Permanente (US)
Blue Cross Blue Shield Association (US)
Centene Corporation (US)
Molina Healthcare, Inc. (US)
WellCare Health Plans, Inc. (US)
In November 2024, the U.S. Department of Health and Human Services Office of Inspector General (OIG) published a report assessing the effectiveness of predictive analytics for healthcare fraud detection. The report highlighted a 25% increase in fraud identification when using these advanced techniques.
In June 2023, Jack Henry introduced Payrailz Fraud Monitor, a new, cloud-based component of the Payrailz Digital Payments Platform. It recognizes fraudulent transactions in real-time, starting from the point when a payment is initiated.
| Report Attributes | Details |
|---|---|
| Market Size in 2023 | USD 2.36 Billion |
| Market Size by 2032 | USD 17.6 Billion |
| CAGR | CAGR of 25% From 2024 to 2032 |
| Base Year | 2023 |
| Forecast Period | 2024-2032 |
| Historical Data | 2020-2022 |
| Report Scope & Coverage | Market Size, Segments Analysis, Competitive Landscape, Regional Analysis, DROC & SWOT Analysis, Forecast Outlook |
| Key Segments | • By Solution Type (Descriptive Analytics, Prescriptive Analytics, Predictive Analytics) • By Delivery Model (On-premises, Cloud-based) • By Application (Insurance Claim Review {Postpayment Review, Prepayment Review}), Pharmacy billing Issue, Payment Integrity, Others) • By End User (Public & Government Agencies, Private Insurance Payers, Third-party Service Providers, Employers) |
| Regional Analysis/Coverage | North America (US, Canada, Mexico), Europe (Eastern Europe [Poland, Romania, Hungary, Turkey, Rest of Eastern Europe] Western Europe] Germany, France, UK, Italy, Spain, Netherlands, Switzerland, Austria, Rest of Western Europe]), Asia Pacific (China, India, Japan, South Korea, Vietnam, Singapore, Australia, Rest of Asia Pacific), Middle East & Africa (Middle East [UAE, Egypt, Saudi Arabia, Qatar, Rest of Middle East], Africa [Nigeria, South Africa, Rest of Africa], Latin America (Brazil, Argentina, Colombia, Rest of Latin America) |
| Company Profiles | IBM Corporation, Optum, Inc., SAS Institute Inc., LexisNexis Risk Solutions, Veradigm, Feedzai, Change Healthcare, Cotiviti, Inc., HMS Holdings Corp., Pondera Solutions, Inc. |
Ans. The projected market size for the Healthcare Fraud Analytics Market is USD 17.6 Billion by 2032.
Ans: The North American region dominated the Healthcare Fraud Analytics Market in 2023.
Ans. The CAGR of the Healthcare Fraud Analytics Market is 25% During the forecast period of 2024-2032.
Ans: The major key players in the market are IBM Corporation, Optum, Inc., SAS Institute Inc., LexisNexis Risk Solutions, Veradigm, Feedzai, Change Healthcare, Cotiviti, Inc., HMS Holdings Corp., Pondera Solutions, Inc., and others in the final report.
Ans: The insurance claims review application segment dominated the Healthcare Fraud Analytics Market.
Table of Contents
1. Introduction
1.1 Market Definition
1.2 Scope (Inclusion and Exclusions)
1.3 Research Assumptions
2. Executive Summary
2.1 Market Overview
2.2 Regional Synopsis
2.3 Competitive Summary
3. Research Methodology
3.1 Top-Down Approach
3.2 Bottom-up Approach
3.3. Data Validation
3.4 Primary Interviews
4. Market Dynamics Impact Analysis
4.1 Market Driving Factors Analysis
4.1.1 Drivers
4.1.2 Restraints
4.1.3 Opportunities
4.1.4 Challenges
4.2 PESTLE Analysis
4.3 Porter’s Five Forces Model
5. Statistical Insights and Trends Reporting
5.1 Fraud Detection Rate & Financial Impact (2023)
5.2 AI & Machine Learning Adoption in Fraud Analytics (2023)
5.3 Fraud Types & Prevalence, by Region (2023)
5.4 Healthcare Payer Investment in Fraud Analytics Solutions (2023-2032)
5.5 Regulatory Compliance & Impact on Fraud Detection (2023)
6. Competitive Landscape
6.1 List of Major Companies, By Region
6.2 Market Share Analysis, By Region
6.3 Product Benchmarking
6.3.1 Product specifications and features
6.3.2 Pricing
6.4 Strategic Initiatives
6.4.1 Marketing and promotional activities
6.4.2 Distribution and Supply Chain Strategies
6.4.3 Expansion plans and new product launches
6.4.4 Strategic partnerships and collaborations
6.5 Technological Advancements
6.6 Market Positioning and Branding
7. Healthcare Fraud Analytics Market Segmentation, By Solution Type
7.1 Chapter Overview
7.2 Descriptive Analytics
7.2.1 Descriptive Analytics Market Trends Analysis (2020-2032)
7.2.2 Descriptive Analytics Market Size Estimates and Forecasts to 2032 (USD Billion)
7.3 Prescriptive Analytics
7.3.1 Prescriptive Analytics Market Trends Analysis (2020-2032)
7.3.2 Prescriptive Analytics Market Size Estimates and Forecasts to 2032 (USD Billion)
7.4 Predictive Analytics
7.4.1 Predictive Analytics Market Trends Analysis (2020-2032)
7.4.2 Predictive Analytics Market Size Estimates and Forecasts to 2032 (USD Billion)
8. Healthcare Fraud Analytics Market Segmentation, By Delivery Model
8.1 Chapter Overview
8.2 On-premises
8.2.1 On-premises Market Trends Analysis (2020-2032)
8.2.2 On-premises Market Size Estimates and Forecasts to 2032 (USD Billion)
8.3 Cloud-based
8.3.1 Cloud-based Market Trends Analysis (2020-2032)
8.3.2 Cloud-based Market Size Estimates and Forecasts to 2032 (USD Billion)
9. Healthcare Fraud Analytics Market Segmentation, By Application
9.1 Chapter Overview
9.2 Insurance Claim Review
9.2.1 Insurance Claim Review Market Trends Analysis (2020-2032)
9.2.2 Insurance Claim Review Market Size Estimates and Forecasts to 2032 (USD Billion)
9.2.3 Postpayment Review
9.2.3.1 Postpayment Review Market Trends Analysis (2020-2032)
9.2.3.2 Postpayment Review Market Size Estimates and Forecasts to 2032 (USD Billion)
9.2.4 Prepayment Review
9.2.4.1 Prepayment Review Market Trends Analysis (2020-2032)
9.2.4.2 Prepayment Review Market Size Estimates and Forecasts to 2032 (USD Billion)
9.3 Pharmacy billing Issue
9.3.1 Pharmacy billing Issue Market Trends Analysis (2020-2032)
9.3.2 Pharmacy billing Issue Market Size Estimates and Forecasts to 2032 (USD Billion)
9.4 Payment Integrity
9.4.1 Payment Integrity Market Trends Analysis (2020-2032)
9.4.2 Payment Integrity Market Size Estimates and Forecasts to 2032 (USD Billion)
9.5 Others
9.5.1 Others Market Trends Analysis (2020-2032)
9.5.2 Others Market Size Estimates and Forecasts to 2032 (USD Billion)
10. Healthcare Fraud Analytics Market Segmentation, By End User
10.1 Chapter Overview
10.2 Public & Government Agencies
10.2.1 Public & Government Agencies Market Trends Analysis (2020-2032)
10.2.2 Public & Government Agencies Market Size Estimates and Forecasts to 2032 (USD Billion)
10.3 Private Insurance Payers
10.3.1 Private Insurance Payers Market Trends Analysis (2020-2032)
10.3.2 Private Insurance Payers Market Size Estimates and Forecasts to 2032 (USD Billion)
10.4 Third-party Service Providers
10.4.1 Third-party Service Providers Market Trends Analysis (2020-2032)
10.4.2 Third-party Service Providers Market Size Estimates and Forecasts to 2032 (USD Billion)
10.5 Employers
10.5.1 Employers Market Trends Analysis (2020-2032)
10.5.2 Employers Market Size Estimates and Forecasts to 2032 (USD Billion)
11. Regional Analysis
11.1 Chapter Overview
11.2 North America
11.2.1 Trends Analysis
11.2.2 North America Healthcare Fraud Analytics Market Estimates and Forecasts, by Country (2020-2032) (USD Billion)
11.2.3 North America Healthcare Fraud Analytics Market Estimates and Forecasts, By Solution Type (2020-2032) (USD Billion)
11.2.4 North America Healthcare Fraud Analytics Market Estimates and Forecasts, By Delivery Model (2020-2032) (USD Billion)
11.2.5 North America Healthcare Fraud Analytics Market Estimates and Forecasts, By Application (2020-2032) (USD Billion)
11.2.6 North America Healthcare Fraud Analytics Market Estimates and Forecasts, By End User (2020-2032) (USD Billion)
11.2.7 USA
11.2.7.1 USA Healthcare Fraud Analytics Market Estimates and Forecasts, By Solution Type (2020-2032) (USD Billion)
11.2.7.2 USA Healthcare Fraud Analytics Market Estimates and Forecasts, By Delivery Model (2020-2032) (USD Billion)
11.2.7.3 USA Healthcare Fraud Analytics Market Estimates and Forecasts, By Application (2020-2032) (USD Billion)
11.2.7.4 USA Healthcare Fraud Analytics Market Estimates and Forecasts, By End User (2020-2032) (USD Billion)
11.2.7 Canada
11.2.7.1 Canada Healthcare Fraud Analytics Market Estimates and Forecasts, By Solution Type (2020-2032) (USD Billion)
11.2.7.2 Canada Healthcare Fraud Analytics Market Estimates and Forecasts, By Delivery Model (2020-2032) (USD Billion)
11.2.7.3 Canada Healthcare Fraud Analytics Market Estimates and Forecasts, By Application (2020-2032) (USD Billion)
11.2.7.3 Canada Healthcare Fraud Analytics Market Estimates and Forecasts, By End User (2020-2032) (USD Billion)
11.2.8 Mexico
11.2.8.1 Mexico Healthcare Fraud Analytics Market Estimates and Forecasts, By Solution Type (2020-2032) (USD Billion)
11.2.8.2 Mexico Healthcare Fraud Analytics Market Estimates and Forecasts, By Delivery Model (2020-2032) (USD Billion)
11.2.8.3 Mexico Healthcare Fraud Analytics Market Estimates and Forecasts, By Application (2020-2032) (USD Billion)
11.2.8.3 Mexico Healthcare Fraud Analytics Market Estimates and Forecasts, By End User (2020-2032) (USD Billion)
11.3 Europe
11.3.1 Eastern Europe
11.3.1.1 Trends Analysis
11.3.1.2 Eastern Europe Healthcare Fraud Analytics Market Estimates and Forecasts, by Country (2020-2032) (USD Billion)
11.3.1.3 Eastern Europe Healthcare Fraud Analytics Market Estimates and Forecasts, By Solution Type (2020-2032) (USD Billion)
11.3.1.4 Eastern Europe Healthcare Fraud Analytics Market Estimates and Forecasts, By Delivery Model (2020-2032) (USD Billion)
11.3.1.5 Eastern Europe Healthcare Fraud Analytics Market Estimates and Forecasts, By Application (2020-2032) (USD Billion)
11.3.1.5 Eastern Europe Healthcare Fraud Analytics Market Estimates and Forecasts, By End User (2020-2032) (USD Billion)
11.3.1.6 Poland
11.3.1.6.1 Poland Healthcare Fraud Analytics Market Estimates and Forecasts, By Solution Type (2020-2032) (USD Billion)
11.3.1.6.2 Poland Healthcare Fraud Analytics Market Estimates and Forecasts, By Delivery Model (2020-2032) (USD Billion)
11.3.1.6.3 Poland Healthcare Fraud Analytics Market Estimates and Forecasts, By Application (2020-2032) (USD Billion)
11.3.1.6.3 Poland Healthcare Fraud Analytics Market Estimates and Forecasts, By End User (2020-2032) (USD Billion)
11.3.1.7 Romania
11.3.1.7.1 Romania Healthcare Fraud Analytics Market Estimates and Forecasts, By Solution Type (2020-2032) (USD Billion)
11.3.1.7.2 Romania Healthcare Fraud Analytics Market Estimates and Forecasts, By Delivery Model (2020-2032) (USD Billion)
11.3.1.7.3 Romania Healthcare Fraud Analytics Market Estimates and Forecasts, By Application (2020-2032) (USD Billion)
11.3.1.7.3 Romania Healthcare Fraud Analytics Market Estimates and Forecasts, By End User (2020-2032) (USD Billion)
11.3.1.8 Hungary
11.3.1.8.1 Hungary Healthcare Fraud Analytics Market Estimates and Forecasts, By Solution Type (2020-2032) (USD Billion)
11.3.1.8.2 Hungary Healthcare Fraud Analytics Market Estimates and Forecasts, By Delivery Model (2020-2032) (USD Billion)
11.3.1.8.3 Hungary Healthcare Fraud Analytics Market Estimates and Forecasts, By Application (2020-2032) (USD Billion)
11.3.1.8.3 Hungary Healthcare Fraud Analytics Market Estimates and Forecasts, By End User (2020-2032) (USD Billion)
11.3.1.9 Turkey
11.3.1.9.1 Turkey Healthcare Fraud Analytics Market Estimates and Forecasts, By Solution Type (2020-2032) (USD Billion)
11.3.1.9.2 Turkey Healthcare Fraud Analytics Market Estimates and Forecasts, By Delivery Model (2020-2032) (USD Billion)
11.3.1.9.3 Turkey Healthcare Fraud Analytics Market Estimates and Forecasts, By Application (2020-2032) (USD Billion)
11.3.1.9.3 Turkey Healthcare Fraud Analytics Market Estimates and Forecasts, By End User (2020-2032) (USD Billion)
11.3.1.11 Rest of Eastern Europe
11.3.1.11.1 Rest of Eastern Europe Healthcare Fraud Analytics Market Estimates and Forecasts, By Solution Type (2020-2032) (USD Billion)
11.3.1.11.2 Rest of Eastern Europe Healthcare Fraud Analytics Market Estimates and Forecasts, By Delivery Model (2020-2032) (USD Billion)
11.3.1.11.3 Rest of Eastern Europe Healthcare Fraud Analytics Market Estimates and Forecasts, By Application (2020-2032) (USD Billion)
11.3.1.11.3 Rest of Eastern Europe Healthcare Fraud Analytics Market Estimates and Forecasts, By End User (2020-2032) (USD Billion)
11.3.2 Western Europe
11.3.2.1 Trends Analysis
11.3.2.2 Western Europe Healthcare Fraud Analytics Market Estimates and Forecasts, by Country (2020-2032) (USD Billion)
11.3.2.3 Western Europe Healthcare Fraud Analytics Market Estimates and Forecasts, By Solution Type (2020-2032) (USD Billion)
11.3.2.4 Western Europe Healthcare Fraud Analytics Market Estimates and Forecasts, By Delivery Model (2020-2032) (USD Billion)
11.3.2.5 Western Europe Healthcare Fraud Analytics Market Estimates and Forecasts, By Application (2020-2032) (USD Billion)
11.3.2.5 Western Europe Healthcare Fraud Analytics Market Estimates and Forecasts, By End User (2020-2032) (USD Billion)
11.3.2.6 Germany
11.3.2.6.1 Germany Healthcare Fraud Analytics Market Estimates and Forecasts, By Solution Type (2020-2032) (USD Billion)
11.3.2.6.2 Germany Healthcare Fraud Analytics Market Estimates and Forecasts, By Delivery Model (2020-2032) (USD Billion)
11.3.2.6.3 Germany Healthcare Fraud Analytics Market Estimates and Forecasts, By Application (2020-2032) (USD Billion)
11.3.2.6.3 Germany Healthcare Fraud Analytics Market Estimates and Forecasts, By End User (2020-2032) (USD Billion)
11.3.2.7 France
11.3.2.7.1 France Healthcare Fraud Analytics Market Estimates and Forecasts, By Solution Type (2020-2032) (USD Billion)
11.3.2.7.2 France Healthcare Fraud Analytics Market Estimates and Forecasts, By Delivery Model (2020-2032) (USD Billion)
11.3.2.7.3 France Healthcare Fraud Analytics Market Estimates and Forecasts, By Application (2020-2032) (USD Billion)
11.3.2.7.3 France Healthcare Fraud Analytics Market Estimates and Forecasts, By End User (2020-2032) (USD Billion)
11.3.2.8 UK
11.3.2.8.1 UK Healthcare Fraud Analytics Market Estimates and Forecasts, By Solution Type (2020-2032) (USD Billion)
11.3.2.8.2 UK Healthcare Fraud Analytics Market Estimates and Forecasts, By Delivery Model (2020-2032) (USD Billion)
11.3.2.8.3 UK Healthcare Fraud Analytics Market Estimates and Forecasts, By Application (2020-2032) (USD Billion)
11.3.2.8.3 UK Healthcare Fraud Analytics Market Estimates and Forecasts, By End User (2020-2032) (USD Billion)
11.3.2.9 Italy
11.3.2.9.1 Italy Healthcare Fraud Analytics Market Estimates and Forecasts, By Solution Type (2020-2032) (USD Billion)
11.3.2.9.2 Italy Healthcare Fraud Analytics Market Estimates and Forecasts, By Delivery Model (2020-2032) (USD Billion)
11.3.2.9.3 Italy Healthcare Fraud Analytics Market Estimates and Forecasts, By Application (2020-2032) (USD Billion)
11.3.2.9.3 Italy Healthcare Fraud Analytics Market Estimates and Forecasts, By End User (2020-2032) (USD Billion)
11.3.2.11 Spain
11.3.2.11.1 Spain Healthcare Fraud Analytics Market Estimates and Forecasts, By Solution Type (2020-2032) (USD Billion)
11.3.2.11.2 Spain Healthcare Fraud Analytics Market Estimates and Forecasts, By Delivery Model (2020-2032) (USD Billion)
11.3.2.11.3 Spain Healthcare Fraud Analytics Market Estimates and Forecasts, By Application (2020-2032) (USD Billion)
11.3.2.11.3 Spain Healthcare Fraud Analytics Market Estimates and Forecasts, By End User (2020-2032) (USD Billion)
11.3.2.11 Netherlands
11.3.2.11.1 Netherlands Healthcare Fraud Analytics Market Estimates and Forecasts, By Solution Type (2020-2032) (USD Billion)
11.3.2.11.2 Netherlands Healthcare Fraud Analytics Market Estimates and Forecasts, By Delivery Model (2020-2032) (USD Billion)
11.3.2.11.3 Netherlands Healthcare Fraud Analytics Market Estimates and Forecasts, By Application (2020-2032) (USD Billion)
11.3.2.11.3 Netherlands Healthcare Fraud Analytics Market Estimates and Forecasts, By End User (2020-2032) (USD Billion)
11.3.2.12 Switzerland
11.3.2.12.1 Switzerland Healthcare Fraud Analytics Market Estimates and Forecasts, By Solution Type (2020-2032) (USD Billion)
11.3.2.12.2 Switzerland Healthcare Fraud Analytics Market Estimates and Forecasts, By Delivery Model (2020-2032) (USD Billion)
11.3.2.12.3 Switzerland Healthcare Fraud Analytics Market Estimates and Forecasts, By Application (2020-2032) (USD Billion)
11.3.2.12.3 Switzerland Healthcare Fraud Analytics Market Estimates and Forecasts, By End User (2020-2032) (USD Billion)
11.3.2.13 Austria
11.3.2.13.1 Austria Healthcare Fraud Analytics Market Estimates and Forecasts, By Solution Type (2020-2032) (USD Billion)
11.3.2.13.2 Austria Healthcare Fraud Analytics Market Estimates and Forecasts, By Delivery Model (2020-2032) (USD Billion)
11.3.2.13.3 Austria Healthcare Fraud Analytics Market Estimates and Forecasts, By Application (2020-2032) (USD Billion)
11.3.2.13.3 Austria Healthcare Fraud Analytics Market Estimates and Forecasts, By End User (2020-2032) (USD Billion)
11.3.2.14 Rest of Western Europe
11.3.2.14.1 Rest of Western Europe Healthcare Fraud Analytics Market Estimates and Forecasts, By Solution Type (2020-2032) (USD Billion)
11.3.2.14.2 Rest of Western Europe Healthcare Fraud Analytics Market Estimates and Forecasts, By Delivery Model (2020-2032) (USD Billion)
11.3.2.14.3 Rest of Western Europe Healthcare Fraud Analytics Market Estimates and Forecasts, By Application (2020-2032) (USD Billion)
11.3.2.14.3 Rest of Western Europe Healthcare Fraud Analytics Market Estimates and Forecasts, By End User (2020-2032) (USD Billion)
11.4 Asia Pacific
11.4.1 Trends Analysis
11.4.2 Asia Pacific Healthcare Fraud Analytics Market Estimates and Forecasts, by Country (2020-2032) (USD Billion)
11.4.3 Asia Pacific Healthcare Fraud Analytics Market Estimates and Forecasts, By Solution Type (2020-2032) (USD Billion)
11.4.4 Asia Pacific Healthcare Fraud Analytics Market Estimates and Forecasts, By Delivery Model (2020-2032) (USD Billion)
11.4.5 Asia Pacific Healthcare Fraud Analytics Market Estimates and Forecasts, By Application (2020-2032) (USD Billion)
11.4.5 Asia Pacific Healthcare Fraud Analytics Market Estimates and Forecasts, By End User (2020-2032) (USD Billion)
11.4.6 China
11.4.6.1 China Healthcare Fraud Analytics Market Estimates and Forecasts, By Solution Type (2020-2032) (USD Billion)
11.4.6.2 China Healthcare Fraud Analytics Market Estimates and Forecasts, By Delivery Model (2020-2032) (USD Billion)
11.4.6.3 China Healthcare Fraud Analytics Market Estimates and Forecasts, By Application (2020-2032) (USD Billion)
11.4.6.3 China Healthcare Fraud Analytics Market Estimates and Forecasts, By End User (2020-2032) (USD Billion)
11.4.7 India
11.4.7.1 India Healthcare Fraud Analytics Market Estimates and Forecasts, By Solution Type (2020-2032) (USD Billion)
11.4.7.2 India Healthcare Fraud Analytics Market Estimates and Forecasts, By Delivery Model (2020-2032) (USD Billion)
11.4.7.3 India Healthcare Fraud Analytics Market Estimates and Forecasts, By Application (2020-2032) (USD Billion)
11.4.7.3 India Healthcare Fraud Analytics Market Estimates and Forecasts, By End User (2020-2032) (USD Billion)
11.4.8 Japan
11.4.8.1 Japan Healthcare Fraud Analytics Market Estimates and Forecasts, By Solution Type (2020-2032) (USD Billion)
11.4.8.2 Japan Healthcare Fraud Analytics Market Estimates and Forecasts, By Delivery Model (2020-2032) (USD Billion)
11.4.8.3 Japan Healthcare Fraud Analytics Market Estimates and Forecasts, By Application (2020-2032) (USD Billion)
11.4.8.3 Japan Healthcare Fraud Analytics Market Estimates and Forecasts, By End User (2020-2032) (USD Billion)
11.4.9 South Korea
11.4.9.1 South Korea Healthcare Fraud Analytics Market Estimates and Forecasts, By Solution Type (2020-2032) (USD Billion)
11.4.9.2 South Korea Healthcare Fraud Analytics Market Estimates and Forecasts, By Delivery Model (2020-2032) (USD Billion)
11.4.9.3 South Korea Healthcare Fraud Analytics Market Estimates and Forecasts, By Application (2020-2032) (USD Billion)
11.4.9.3 South Korea Healthcare Fraud Analytics Market Estimates and Forecasts, By End User (2020-2032) (USD Billion)
11.4.11 Vietnam
11.4.11.1 Vietnam Healthcare Fraud Analytics Market Estimates and Forecasts, By Solution Type (2020-2032) (USD Billion)
11.4.11.2 Vietnam Healthcare Fraud Analytics Market Estimates and Forecasts, By Delivery Model (2020-2032) (USD Billion)
11.4.11.3 Vietnam Healthcare Fraud Analytics Market Estimates and Forecasts, By Application (2020-2032) (USD Billion)
11.4.11.3 Vietnam Healthcare Fraud Analytics Market Estimates and Forecasts, By End User (2020-2032) (USD Billion)
11.4.11 Singapore
11.4.11.1 Singapore Healthcare Fraud Analytics Market Estimates and Forecasts, By Solution Type (2020-2032) (USD Billion)
11.4.11.2 Singapore Healthcare Fraud Analytics Market Estimates and Forecasts, By Delivery Model (2020-2032) (USD Billion)
11.4.11.3 Singapore Healthcare Fraud Analytics Market Estimates and Forecasts, By Application (2020-2032) (USD Billion)
11.4.11.3 Singapore Healthcare Fraud Analytics Market Estimates and Forecasts, By End User (2020-2032) (USD Billion)
11.4.12 Australia
11.4.12.1 Australia Healthcare Fraud Analytics Market Estimates and Forecasts, By Solution Type (2020-2032) (USD Billion)
11.4.12.2 Australia Healthcare Fraud Analytics Market Estimates and Forecasts, By Delivery Model (2020-2032) (USD Billion)
11.4.12.3 Australia Healthcare Fraud Analytics Market Estimates and Forecasts, By Application (2020-2032) (USD Billion)
11.4.12.3 Australia Healthcare Fraud Analytics Market Estimates and Forecasts, By End User (2020-2032) (USD Billion)
11.4.13 Rest of Asia Pacific
11.4.13.1 Rest of Asia Pacific Healthcare Fraud Analytics Market Estimates and Forecasts, By Solution Type (2020-2032) (USD Billion)
11.4.13.2 Rest of Asia Pacific Healthcare Fraud Analytics Market Estimates and Forecasts, By Delivery Model (2020-2032) (USD Billion)
11.4.13.3 Rest of Asia Pacific Healthcare Fraud Analytics Market Estimates and Forecasts, By Application (2020-2032) (USD Billion)
11.4.13.3 Rest of Asia Pacific Healthcare Fraud Analytics Market Estimates and Forecasts, By End User (2020-2032) (USD Billion)
11.5 Middle East and Africa
11.5.1 Middle East
11.5.1.1 Trends Analysis
11.5.1.2 Middle East Healthcare Fraud Analytics Market Estimates and Forecasts, by Country (2020-2032) (USD Billion)
11.5.1.3 Middle East Healthcare Fraud Analytics Market Estimates and Forecasts, By Solution Type (2020-2032) (USD Billion)
11.5.1.4 Middle East Healthcare Fraud Analytics Market Estimates and Forecasts, By Delivery Model (2020-2032) (USD Billion)
11.5.1.5 Middle East Healthcare Fraud Analytics Market Estimates and Forecasts, By Application (2020-2032) (USD Billion)
11.5.1.5 Middle East Healthcare Fraud Analytics Market Estimates and Forecasts, By End User (2020-2032) (USD Billion)
11.5.1.6 UAE
11.5.1.6.1 UAE Healthcare Fraud Analytics Market Estimates and Forecasts, By Solution Type (2020-2032) (USD Billion)
11.5.1.6.2 UAE Healthcare Fraud Analytics Market Estimates and Forecasts, By Delivery Model (2020-2032) (USD Billion)
11.5.1.6.3 UAE Healthcare Fraud Analytics Market Estimates and Forecasts, By Application (2020-2032) (USD Billion)
11.5.1.6.3 UAE Healthcare Fraud Analytics Market Estimates and Forecasts, By End User (2020-2032) (USD Billion)
11.5.1.7 Egypt
11.5.1.7.1 Egypt Healthcare Fraud Analytics Market Estimates and Forecasts, By Solution Type (2020-2032) (USD Billion)
11.5.1.7.2 Egypt Healthcare Fraud Analytics Market Estimates and Forecasts, By Delivery Model (2020-2032) (USD Billion)
11.5.1.7.3 Egypt Healthcare Fraud Analytics Market Estimates and Forecasts, By Application (2020-2032) (USD Billion)
11.5.1.7.3 Egypt Healthcare Fraud Analytics Market Estimates and Forecasts, By End User (2020-2032) (USD Billion)
11.5.1.8 Saudi Arabia
11.5.1.8.1 Saudi Arabia Healthcare Fraud Analytics Market Estimates and Forecasts, By Solution Type (2020-2032) (USD Billion)
11.5.1.8.2 Saudi Arabia Healthcare Fraud Analytics Market Estimates and Forecasts, By Delivery Model (2020-2032) (USD Billion)
11.5.1.8.3 Saudi Arabia Healthcare Fraud Analytics Market Estimates and Forecasts, By Application (2020-2032) (USD Billion)
11.5.1.8.3 Saudi Arabia Healthcare Fraud Analytics Market Estimates and Forecasts, By End User (2020-2032) (USD Billion)
11.5.1.9 Qatar
11.5.1.9.1 Qatar Healthcare Fraud Analytics Market Estimates and Forecasts, By Solution Type (2020-2032) (USD Billion)
11.5.1.9.2 Qatar Healthcare Fraud Analytics Market Estimates and Forecasts, By Delivery Model (2020-2032) (USD Billion)
11.5.1.9.3 Qatar Healthcare Fraud Analytics Market Estimates and Forecasts, By Application (2020-2032) (USD Billion)
11.5.1.9.3 Qatar Healthcare Fraud Analytics Market Estimates and Forecasts, By End User (2020-2032) (USD Billion)
11.5.1.11 Rest of Middle East
11.5.1.11.1 Rest of Middle East Healthcare Fraud Analytics Market Estimates and Forecasts, By Solution Type (2020-2032) (USD Billion)
11.5.1.11.2 Rest of Middle East Healthcare Fraud Analytics Market Estimates and Forecasts, By Delivery Model (2020-2032) (USD Billion)
11.5.1.11.3 Rest of Middle East Healthcare Fraud Analytics Market Estimates and Forecasts, By Application (2020-2032) (USD Billion)
11.5.1.11.3 Rest of Middle East Healthcare Fraud Analytics Market Estimates and Forecasts, By End User (2020-2032) (USD Billion)
11.5.2 Africa
11.5.2.1 Trends Analysis
11.5.2.2 Africa Healthcare Fraud Analytics Market Estimates and Forecasts, by Country (2020-2032) (USD Billion)
11.5.2.3 Africa Healthcare Fraud Analytics Market Estimates and Forecasts, By Solution Type (2020-2032) (USD Billion)
11.5.2.4 Africa Healthcare Fraud Analytics Market Estimates and Forecasts, By Delivery Model (2020-2032) (USD Billion)
11.5.2.5 Africa Healthcare Fraud Analytics Market Estimates and Forecasts, By Application (2020-2032) (USD Billion)
11.5.2.8.3 Africa Healthcare Fraud Analytics Market Estimates and Forecasts, By End User (2020-2032) (USD Billion)
11.5.2.6 South Africa
11.5.2.6.1 South Africa Healthcare Fraud Analytics Market Estimates and Forecasts, By Solution Type (2020-2032) (USD Billion)
11.5.2.6.2 South Africa Healthcare Fraud Analytics Market Estimates and Forecasts, By Delivery Model (2020-2032) (USD Billion)
11.5.2.6.3 South Africa Healthcare Fraud Analytics Market Estimates and Forecasts, By Application (2020-2032) (USD Billion)
11.5.2.8.3 South Africa Healthcare Fraud Analytics Market Estimates and Forecasts, By End User (2020-2032) (USD Billion)
11.5.2.7 Nigeria
11.5.2.7.1 Nigeria Healthcare Fraud Analytics Market Estimates and Forecasts, By Solution Type (2020-2032) (USD Billion)
11.5.2.7.2 Nigeria Healthcare Fraud Analytics Market Estimates and Forecasts, By Delivery Model (2020-2032) (USD Billion)
11.5.2.7.3 Nigeria Healthcare Fraud Analytics Market Estimates and Forecasts, By Application (2020-2032) (USD Billion)
11.5.2.8.3 Nigeria Healthcare Fraud Analytics Market Estimates and Forecasts, By End User (2020-2032) (USD Billion)
11.5.2.8 Rest of Africa
11.5.2.8.1 Rest of Africa Healthcare Fraud Analytics Market Estimates and Forecasts, By Solution Type (2020-2032) (USD Billion)
11.5.2.8.2 Rest of Africa Healthcare Fraud Analytics Market Estimates and Forecasts, By Delivery Model (2020-2032) (USD Billion)
11.5.2.8.3 Rest of Africa Healthcare Fraud Analytics Market Estimates and Forecasts, By Application (2020-2032) (USD Billion)
11.5.2.8.3 Rest of Africa Healthcare Fraud Analytics Market Estimates and Forecasts, By End User (2020-2032) (USD Billion)
11.6 Latin America
11.6.1 Trends Analysis
11.6.2 Latin America Healthcare Fraud Analytics Market Estimates and Forecasts, by Country (2020-2032) (USD Billion)
11.6.3 Latin America Healthcare Fraud Analytics Market Estimates and Forecasts, By Solution Type (2020-2032) (USD Billion)
11.6.4 Latin America Healthcare Fraud Analytics Market Estimates and Forecasts, By Delivery Model (2020-2032) (USD Billion)
11.6.5 Latin America Healthcare Fraud Analytics Market Estimates and Forecasts, By Application (2020-2032) (USD Billion)
11.6.5 Latin America Healthcare Fraud Analytics Market Estimates and Forecasts, By End User (2020-2032) (USD Billion)
11.6.6 Brazil
11.6.6.1 Brazil Healthcare Fraud Analytics Market Estimates and Forecasts, By Solution Type (2020-2032) (USD Billion)
11.6.6.2 Brazil Healthcare Fraud Analytics Market Estimates and Forecasts, By Delivery Model (2020-2032) (USD Billion)
11.6.6.3 Brazil Healthcare Fraud Analytics Market Estimates and Forecasts, By Application (2020-2032) (USD Billion)
11.6.6.3 Brazil Healthcare Fraud Analytics Market Estimates and Forecasts, By End User (2020-2032) (USD Billion)
11.6.7 Argentina
11.6.7.1 Argentina Healthcare Fraud Analytics Market Estimates and Forecasts, By Solution Type (2020-2032) (USD Billion)
11.6.7.2 Argentina Healthcare Fraud Analytics Market Estimates and Forecasts, By Delivery Model (2020-2032) (USD Billion)
11.6.7.3 Argentina Healthcare Fraud Analytics Market Estimates and Forecasts, By Application (2020-2032) (USD Billion)
11.6.7.3 Argentina Healthcare Fraud Analytics Market Estimates and Forecasts, By End User (2020-2032) (USD Billion)
11.6.8 Colombia
11.6.8.1 Colombia Healthcare Fraud Analytics Market Estimates and Forecasts, By Solution Type (2020-2032) (USD Billion)
11.6.8.2 Colombia Healthcare Fraud Analytics Market Estimates and Forecasts, By Delivery Model (2020-2032) (USD Billion)
11.6.8.3 Colombia Healthcare Fraud Analytics Market Estimates and Forecasts, By Application (2020-2032) (USD Billion)
11.6.8.3 Colombia Healthcare Fraud Analytics Market Estimates and Forecasts, By End User (2020-2032) (USD Billion)
11.6.9 Rest of Latin America
11.6.9.1 Rest of Latin America Healthcare Fraud Analytics Market Estimates and Forecasts, By Solution Type (2020-2032) (USD Billion)
11.6.9.2 Rest of Latin America Healthcare Fraud Analytics Market Estimates and Forecasts, By Delivery Model (2020-2032) (USD Billion)
11.6.9.3 Rest of Latin America Healthcare Fraud Analytics Market Estimates and Forecasts, By Application (2020-2032) (USD Billion)
11.6.9.3 Rest of Latin America Healthcare Fraud Analytics Market Estimates and Forecasts, By End User (2020-2032) (USD Billion)
12. Company Profiles
12.1 IBM Corporation
12.1.1 Company Overview
12.1.2 Financial
12.1.3 Products/ Services Offered
12.1.4 SWOT Analysis
12.2 Optum, Inc.
12.2.1 Company Overview
12.2.2 Financial
12.2.3 Products/ Services Offered
12.2.4 SWOT Analysis
12.3 SAS Institute Inc.
12.3.1 Company Overview
12.3.2 Financial
12.3.3 Products/ Services Offered
12.3.4 SWOT Analysis
12.4 LexisNexis Risk Solutions
12.4.1 Company Overview
12.4.2 Financial
12.4.3 Products/ Services Offered
12.4.4 SWOT Analysis
12.5 Veradigm
12.5.1 Company Overview
12.5.2 Financial
12.5.3 Products/ Services Offered
12.5.4 SWOT Analysis
12.6 Feedzai
12.6.1 Company Overview
12.6.2 Financial
12.6.3 Products/ Services Offered
12.6.4 SWOT Analysis
12.7 Change Healthcare
12.7.1 Company Overview
12.7.2 Financial
12.7.3 Products/ Services Offered
12.7.4 SWOT Analysis
12.8 Cotiviti, Inc.
12.8.1 Company Overview
12.8.2 Financial
12.8.3 Products/ Services Offered
12.8.4 SWOT Analysis
12.9 HMS Holdings Corp.
12.9.1 Company Overview
12.9.2 Financial
12.9.3 Products/ Services Offered
12.9.4 SWOT Analysis
12.10 Pondera Solutions, Inc.
12.10.1 Company Overview
12.10.2 Financial
12.10.3 Products/ Services Offered
12.10.4 SWOT Analysis
13. Use Cases and Best Practices
14. Conclusion
An accurate research report requires proper strategizing as well as implementation. There are multiple factors involved in the completion of good and accurate research report and selecting the best methodology to compete the research is the toughest part. Since the research reports we provide play a crucial role in any company’s decision-making process, therefore we at SNS Insider always believe that we should choose the best method which gives us results closer to reality. This allows us to reach at a stage wherein we can provide our clients best and accurate investment to output ratio.
Each report that we prepare takes a timeframe of 350-400 business hours for production. Starting from the selection of titles through a couple of in-depth brain storming session to the final QC process before uploading our titles on our website we dedicate around 350 working hours. The titles are selected based on their current market cap and the foreseen CAGR and growth.
The 5 steps process:
Step 1: Secondary Research:
Secondary Research or Desk Research is as the name suggests is a research process wherein, we collect data through the readily available information. In this process we use various paid and unpaid databases which our team has access to and gather data through the same. This includes examining of listed companies’ annual reports, Journals, SEC filling etc. Apart from this our team has access to various associations across the globe across different industries. Lastly, we have exchange relationships with various university as well as individual libraries.

Step 2: Primary Research
When we talk about primary research, it is a type of study in which the researchers collect relevant data samples directly, rather than relying on previously collected data. This type of research is focused on gaining content specific facts that can be sued to solve specific problems. Since the collected data is fresh and first hand therefore it makes the study more accurate and genuine.
We at SNS Insider have divided Primary Research into 2 parts.
Part 1 wherein we interview the KOLs of major players as well as the upcoming ones across various geographic regions. This allows us to have their view over the market scenario and acts as an important tool to come closer to the accurate market numbers. As many as 45 paid and unpaid primary interviews are taken from both the demand and supply side of the industry to make sure we land at an accurate judgement and analysis of the market.
This step involves the triangulation of data wherein our team analyses the interview transcripts, online survey responses and observation of on filed participants. The below mentioned chart should give a better understanding of the part 1 of the primary interview.

Part 2: In this part of primary research the data collected via secondary research and the part 1 of the primary research is validated with the interviews from individual consultants and subject matter experts.
Consultants are those set of people who have at least 12 years of experience and expertise within the industry whereas Subject Matter Experts are those with at least 15 years of experience behind their back within the same space. The data with the help of two main processes i.e., FGDs (Focused Group Discussions) and IDs (Individual Discussions). This gives us a 3rd party nonbiased primary view of the market scenario making it a more dependable one while collation of the data pointers.
Step 3: Data Bank Validation
Once all the information is collected via primary and secondary sources, we run that information for data validation. At our intelligence centre our research heads track a lot of information related to the market which includes the quarterly reports, the daily stock prices, and other relevant information. Our data bank server gets updated every fortnight and that is how the information which we collected using our primary and secondary information is revalidated in real time.

Step 4: QA/QC Process
After all the data collection and validation our team does a final level of quality check and quality assurance to get rid of any unwanted or undesired mistakes. This might include but not limited to getting rid of the any typos, duplication of numbers or missing of any important information. The people involved in this process include technical content writers, research heads and graphics people. Once this process is completed the title gets uploader on our platform for our clients to read it.
Step 5: Final QC/QA Process:
This is the last process and comes when the client has ordered the study. In this process a final QA/QC is done before the study is emailed to the client. Since we believe in giving our clients a good experience of our research studies, therefore, to make sure that we do not lack at our end in any way humanly possible we do a final round of quality check and then dispatch the study to the client.
Key Segments:
By Solution Type
Descriptive Analytics
By Delivery Model
On-premises
Cloud-based
By Application
Insurance Claim Review
Postpayment Review
Prepayment Review
Pharmacy billing Issue
Payment Integrity
Others
By End User
Public & Government Agencies
Private Insurance Payers
Third-party Service Providers
Employers
Request for Segment Customization as per your Business Requirement: Segment Customization Request
Regional Coverage:
North America
US
Canada
Mexico
Europe
Eastern Europe
Poland
Romania
Hungary
Turkey
Rest of Eastern Europe
Western Europe
Germany
France
UK
Italy
Spain
Netherlands
Switzerland
Austria
Rest of Western Europe
Asia Pacific
China
India
Japan
South Korea
Vietnam
Singapore
Australia
Rest of Asia Pacific
Middle East & Africa
Middle East
UAE
Egypt
Saudi Arabia
Qatar
Rest of Middle East
Africa
Nigeria
South Africa
Rest of Africa
Latin America
Brazil
Argentina
Colombia
Rest of Latin America
Request for Country Level Research Report: Country Level Customization Request
Available Customization
With the given market data, SNS Insider offers customization as per the company’s specific needs. The following customization options are available for the report:
Detailed Volume Analysis
Criss-Cross segment analysis (e.g. Product X Application)
Competitive Product Benchmarking
Geographic Analysis
Additional countries in any of the regions
Customized Data Representation
Detailed analysis and profiling of additional market players
The Healthcare/Medical Simulation Market size was valued at USD 1.81 billion in 2023 is projected grow at a CAGR of 16.31% to reach USD 7.04 billion by 2032.
The Clinical Risk Grouping Solutions Market Size was valued at USD 640 million in 2022, and is expected to reach USD 1890 million by 2030, and grow at a CAGR of 14.5% over the forecast period 2023-2030.
The Proteomics Market Size was valued at USD 30.61 billion in 2023 and is expected to reach USD 96.35 Billion by 2032, growing at a CAGR of 13.61% from 2024-2032.
The Interactive Patient Engagement Solutions Market size was valued USD 17.51 Bn by 2023, & will reach $72.46 Bn by 2032, with CAGR of 17.12% by 2024-2032.
The Healthcare Data Storage Market Size was valued at USD 4.7 Bn in 2023 and will reach to USD 15.54 Bn by 2032 and grow at a CAGR of 14.23% by 2024-2032.
The 4D Printing in Healthcare Market Size was valued at USD 35.41 billion in 2023 and is expected to reach USD 203.45 billion by 2032 and grow at a CAGR of 21.5% over the forecast period 2024-2031.

Hi! Click one of our member below to chat on Phone
© 2025 All Rights Reserved by SNS Insider Pvt Ltd


