Get more information on Healthcare Biometrics Market - Request Sample Report
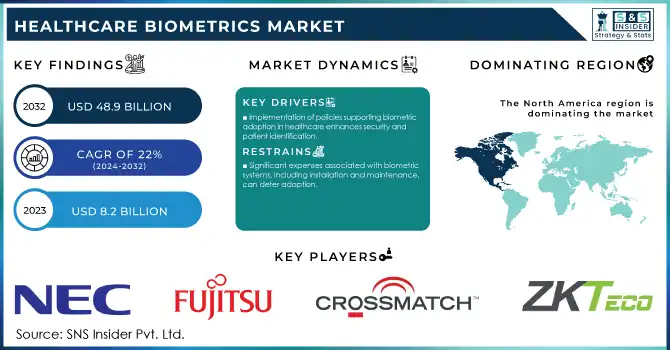
The Healthcare Biometrics Market size was valued at USD 8.2 billion in 2023 and is expected to reach USD 48.9 billion by 2032, growing at a CAGR of 22% over the forecast period 2024-2032.
Increasing concerns about patient data security, growing incidences of healthcare fraud, and the requirement for attention in the patient identification process are some of the forces that are driving the healthcare biometrics market, and developing markets in the Asia-Pacific region are also expected to create growth opportunities. Growing government initiatives across the globe also represent a significant market-driving factor. As an example, HHS reported that healthcare data breaches in 2020 had increased by 55% in comparison to 2019 which underscores the need for strong security. To meet this challenge, the HHS Office for Civil Rights (OCR) has ramped up its enforcement attention on institutions that are not in compliance with HIPAA and imposed fines of more than $13 million for data breaches in 2022. On another hand, the fine for non-compliance with the European Union's General Data Protection Regulation (GDPR) was €1.6 billion in 2022 which has triggered the uptake of Biometric technologies in healthcare.
The pandemic of COVID-19 has accelerated the shift towards biometric solutions in healthcare even more, in 2020 the World Health Organisation (WHO), announced a global increase of 63% of telemedicine services. With the shift has come an increased need for secure remote patient identification. In addition, U.S. Centers for Medicare & Medicaid Services (CMS) have introduced new rules for healthcare providers to access electronic health records using multi-factor authentication, which in turn propels the biometric solutions demand. Facial recognition still has some way to go, but technological progress is also helping out, with the U.S. National Institute of Standards and Technology (NIST) reporting a 20x boost in accuracy over facial recognition test databases between 2014 and 2023.
Drivers
Implementation of policies supporting biometric adoption in healthcare enhances security and patient identification.
Increasing incidents of data breaches and medical identity theft necessitate advanced biometric solutions for protection.
Government projects have been some of the initiatives facilitating the adoption of biometric technologies within the healthcare sector, aimed to enhance information safety, patient identification, and healthcare services. For instance, the South African Social Security Agency (SASSA) implemented a biometric enrollment system to authenticate beneficiaries, effectively reducing fraud in social grant distributions. In India, more and more healthcare institutions have begun to implement biometric attendance services over the past years. The system seems to be very productive in terms of staff punctuality and, as a result, hospital care. Recent studies demonstrate that biological attendance has been integrated into 96% of district hospitals, 99% of sub-district hospitals, and over 62% of satellite hospitals. At the same time, 96% of district hospitals, 100% of sub-district hospitals, and over 62% of satellite hospitals use CCTV cameras to control timely staff arrivals. In this way, the integration of biometrics within the healthcare sector seems productive for patient care and overall hospital performance. The examples prove that government initiatives are efficient in fostering the implementation of biometric systems. When governments focus on establishing biometric systems, they can target a range of problems like fraud, healthcare delivery inefficiency, or information safety. In turn, more effective hospitals and improved patient care will be achieved.
Restraints:
Significant expenses associated with biometric systems, including installation and maintenance, can deter adoption.
Issues like false positives/negatives in recognition technologies may impact accuracy and reliability.
The use of biometric systems in the healthcare system is often limited by high purchase, installation, and maintenance costs for hardware and software. However, advanced biometric technologies, such as fingerprint scanners, facial recognition systems, and iris scanners, can be relatively costly to implement, which may pose a barrier to entry for smaller to medium-sized healthcare providers due to the high up-front costs of technology adoption. The need for specialized skills to integrate these systems with current healthcare IT is noticeable to increase costs.
Operational costs such as frequent software updates, periodic system calibration, and personnel training into the cost equation. Such costs can be prohibitive to adoption, especially in geographies without deep healthcare budgets or healthcare systems working in low-margin environments. Despite their potential to enhance security and patient management, the financial implications of biometric systems pose a significant barrier, slowing down their widespread deployment and limiting their accessibility to resource-constrained organizations.
By Type
In 2023, the single-factor authentication segment accounted for the highest market share of 63%. This dominance is driven by the widespread adoption, affordability, and availability of nucleic acid testing in the healthcare environment. This level of authentication primarily uses fingerprints or facial recognition to help ensure that patient data is accessed only by the right people, while reducing the burden of providing multiple passwords or logins, thus falling in the middle ground between security and usability, which is why many healthcare providers prefer to opt for this. A 2023 survey conducted by the U.S. Department of Health and Human Services (HHS) found that 78% of healthcare organizations have adopted a biometric authenticator in some form, although the most deployed systems are single-factor in nature. According to the National Institute of Standards and Technology (NIST), single-factor biometric systems can achieve up to a 99.7% accuracy rate in a controlled environment, which is good enough for various use case scenarios of the healthcare system.
In addition, the Centers for Medicare & Medicaid Services (CMS) implemented a requirement for at least single-factor authentication to access electronic health records, fostering significant usage. One of the leading reasons is the cost-effectiveness of single-factor systems, as the U.S. Government Accountability Office (GAO) estimates implementing multi-factor authentication can cost as much as 3.5 times compared to a single-factor solution. This cost differential is especially relevant to smaller healthcare providers and rural hospitals that operate on thin profit margins. Moreover, the relative ease of use of single-factor systems fits well with the current demand to process patients rapidly and efficiently for better patient accommodation in high-volume healthcare environments (AHA; 2023).
By Technology
In 2023, the fingerprint recognition segment dominated the Global Biometric Systems Market with a revenue share of 38%. This leadership position can be attributed to the technology's maturity, widespread acceptance, and proven reliability in healthcare settings. Fingerprint recognition, due to its unique combination of accuracy, usability, and cost has made it the top selection for many healthcare providers. The National Institute of Standards and Technology (NIST), in tests, has found that, in controlled environments, fingerprint recognition systems can achieve accuracy rates as high as 99.9%, outperforming numerous other biometric modalities. Many fingerprint-based systems have been approved by the U.S. Food and Drug Administration (FDA) for use in the healthcare sector as they are reliable and non-invasive.
The Centers for Disease Control and Prevention (CDC) has also endorsed fingerprint biometrics as a hygiene-friendly option when implemented with proper sanitization protocols, especially important in healthcare settings. U.S. Department of Health and Human Services (HHS) revealed that 65% of healthcare data breaches in 2022 were preventable with better authentication solutions, which certainly shows the need for reliable biometric solutions such as fingerprint technology. The range of use cases for the versatile technology is seen in its widespread adoption in healthcare from patient identification to safe access to electronic health records (EHRs). The Office of the National Coordinator for Health Information Technology (ONC) has reported that 72% of hospitals using biometric authentication in 2023 employed fingerprint recognition systems, underscoring its dominance in the healthcare sector.
By Application
In 2023, the patient identification & tracking segment dominated the market, accounting for 34% of the global share. The critical need for accurate patient identification to prevent medical errors, improve patient safety, and enhance care quality in healthcare settings has been attributed to this dominance. The World Health Organization (WHO) notes that the misidentification of patients is one of the top contributors to medical errors and leads to 400,000 deaths a year globally. a National Patient Safety Goal that focuses on accurate patient identification in healthcare delivery within the United States by the Joint Commission on Accreditation of Healthcare Organizations (JCAHO). According to the U.S. Department of Health and Human Services (HHS), patient identification errors result in more than $6 billion in annual costs to the healthcare industry annually, which illustrates the financial impact that this problem has. These concerns have been met with great efficacy by identifying patients with biometric patient identification systems.
Research performed by the National Institutes of Health (NIH) showed that medical errors were 35% lower and patient satisfaction scores were 22% higher after using biometric patient identification. CMS also sees the value in biometric patient identification and has made it a recommended practice for reducing hospital readmissions. Information Technology (ONC) said that in 2023, among healthcare providers that had deployed the use of biometrics, 68% used biometrics for patient identification and tracking. This widespread adoption is driven by the technology's ability to prevent duplicate medical records, reduce fraud, and ensure continuity of care across different healthcare settings.
By End Use
The hospitals & clinics segment was the largest in the market in 2023 and accounted for 49% of the overall revenue share. The largest share of the patient verification market can be attributed to a large volume of patient interactions, a high need for reliable patient identification, and complex security requirements in hospital and clinic settings. As of 2022, there were more than 36 million hospital admissions in the USA, highlighting how many patients experience these appointments and stay in these buildings, according to the American Hospital Association (AHA). In the same year, there were more than 883 million outpatient clinic visits in the United States, according to the Centers for Disease Control and Prevention (CDC). The healthcare sector is considered to be a significant adopter of biometric technologies and is mainly driven by the requirement of stringent regulatory adherence in hospitals and clinics.
In a 2022 report by the U.S. Department of Health and Human Services (HHS) Office for Civil Rights (OCR), hospitals and clinics were cited in 60% of healthcare data breaches, further supporting the need for up-to-date security. As a result, the Joint Commission on the Accreditation of Healthcare Organizations (JCAHO) has added biometrics as a best practice in their patient safety goals. As per the National Institute of Standards and Technology (NIST), biometric systems operated in a healthcare setting can attain accuracy rates of as high as 99.8%, thus ensuring the best patient identification and access control in the healthcare systems. Furthermore, a study by the Agency for Healthcare Research and Quality (AHRQ) found that implementing biometric patient identification in hospitals reduced medical errors by 25% and improved patient throughput times by 15%, demonstrating the tangible benefits of these technologies in hospital operations.
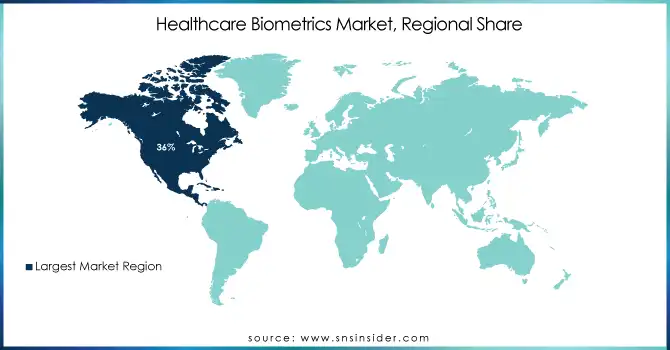
North America held the largest share of 36% in the healthcare biometrics market. The region's mature healthcare system, stringent regulatory environment, and favorable early adoption of leading-edge technologies have all contributed to this leadership position. Biometric implementations in healthcare are especially growing in the United States. By 2023, more than 75% of hospitals in the country will use some cool kind of biometric technology, mainly inpatient identifications and staff authentications (HHS). The region's dominance is further reinforced by substantial government investments in healthcare IT infrastructure. The Office of the National Coordinator for Health Information Technology (ONC) reported that federal spending on healthcare IT reached $8.5 billion in 2023, with a significant portion allocated to enhancing data security and patient identification systems.
On the contrary, the Asia-Pacific region is the fastest-growing region and is expected to register an exceptional CAGR during the forecast period 2024–2032. The increasing healthcare expenditure, the growing awareness towards patient safety, and initiatives taken by governments to modernize healthcare systems are leading to faster expansion. Asia-Pacific had a share of the global healthcare biometrics market in 2023. China and India are the main growth drivers in this area. China devotes massive money to healthcare digitization (biometric technologies particularly) through its so-called Healthy China 2030 plan. The Ayushman Bharat Digital Mission (ABDM) in India is focused on developing an integrated digital health infrastructure with biometric authentication for accessing health records. A testament to the overwhelming scale of biometric adoption in the region with over 300 million Indian citizens enrolled as of 2023. This is surging owing to the region's population base, along with the rising chronic diseases that need robust, cost-effective, and secure healthcare systems to manage them.
Need any customization research on Healthcare Biometrics Market - Enquiry Now
Imprivata, Inc., a provider of patient identity solutions, announced Biometric Patient Identity, a facial recognition tool that helps healthcare institutions guarantee correct and secure patient identification in February 2024. This solution assists healthcare providers in reducing medical errors and improves patient safety.
Key Service Providers/Manufacturers
NEC Corporation (NeoFace®, Bio-IDiom)
Fujitsu Limited (PalmSecure™, BioSec)
3M Cogent, Inc. (Cogent BioTrust™, Cogent BioKit)
Bio-Key International, Inc. (ID Director for Healthcare™, Biometric Service Platform)
Crossmatch Technologies (DigitalPersona®, Verifier Sentry)
M2SYS Technology (RightPatient®, CloudApper Biometric)
Safran Identity & Security (MorphoWave™, MorphoTablet)
Imprivata, Inc. (OneSign®, Confirm ID)
Integrated Biometrics, LLC (Watson Mini®, Kojak)
ZKTeco USA (BioTime®, ZPad Plus)
Key Users of Services and Products
Mayo Clinic
Cleveland Clinic
Kaiser Permanente
Mount Sinai Health System
Johns Hopkins Medicine
Apollo Hospitals
Fortis Healthcare
NHS (National Health Service)
Singapore General Hospital
Medanta - The Medicity
| Report Attributes | Details |
|---|---|
| Market Size in 2023 | USD 8.2 Billion |
| Market Size by 2032 | USD 48.9 Billion |
| CAGR | CAGR of 22% From 2024 to 2032 |
| Base Year | 2023 |
| Forecast Period | 2024-2032 |
| Historical Data | 2020-2022 |
| Report Scope & Coverage | Market Size, Segments Analysis, Competitive Landscape, Regional Analysis, DROC & SWOT Analysis, Forecast Outlook |
| Key Segments | • By Type (Single Factor Authentication, Multi-Factor Authentication, Multimodal Authentication) • By Technology (Face Recognition, Fingerprint Recognition, Iris Recognition, Vein Recognition, Palm Geometry Recognition, Behavioral Recognition, Others) • By Application (Medical Record Security & Data Protection, Patient Identification & Tracking, Remote Patient Monitoring, Workforce Management, Pharmacy Dispensing, Others) • By End-use (Hospitals & Clinics, Healthcare Institutions, Research & Clinical Laboratories) |
| Regional Analysis/Coverage | North America (US, Canada, Mexico), Europe (Eastern Europe [Poland, Romania, Hungary, Turkey, Rest of Eastern Europe] Western Europe] Germany, France, UK, Italy, Spain, Netherlands, Switzerland, Austria, Rest of Western Europe]), Asia Pacific (China, India, Japan, South Korea, Vietnam, Singapore, Australia, Rest of Asia Pacific), Middle East & Africa (Middle East [UAE, Egypt, Saudi Arabia, Qatar, Rest of Middle East], Africa [Nigeria, South Africa, Rest of Africa], Latin America (Brazil, Argentina, Colombia, Rest of Latin America) |
| Company Profiles | NEC Corporation, Fujitsu Limited, 3M Cogent, Inc., Bio-Key International, Inc., Crossmatch Technologies, M2SYS Technology, Safran Identity & Security, Imprivata, Inc., Integrated Biometrics, LLC, ZKTeco USA |
| Key Drivers | • Implementation of policies supporting biometric adoption in healthcare enhances security and patient identification. • Increasing incidents of data breaches and medical identity theft necessitate advanced biometric solutions for protection. |
| Restraints | • Significant expenses associated with biometric systems, including installation and maintenance, can deter adoption. • Issues like false positives/negatives in recognition technologies may impact accuracy and reliability. |
Ans. The projected market size for the Healthcare Biometrics Market is USD 48.9 Billion by 2032.
Ans. The CAGR of the Healthcare Biometrics Market is 22% During the forecast period of 2024-2032.
Ans: The North American region dominated the Healthcare Biometrics Market in 2023.
Ans: NEC Corporation, Fujitsu Limited, 3M Cogent, Inc., Bio-Key International, Inc., Crossmatch Technologies, M2SYS Technology, Safran Identity & Security, Imprivata, Inc., Integrated Biometrics, LLC, ZKTeco USA
Ans:
Table of Contents
1. Introduction
1.1 Market Definition
1.2 Scope (Inclusion and Exclusions)
1.3 Research Assumptions
2. Executive Summary
2.1 Market Overview
2.2 Regional Synopsis
2.3 Competitive Summary
3. Research Methodology
3.1 Top-Down Approach
3.2 Bottom-up Approach
3.3. Data Validation
3.4 Primary Interviews
4. Market Dynamics Impact Analysis
4.1 Market Driving Factors Analysis
4.1.1 Drivers
4.1.2 Restraints
4.1.3 Opportunities
4.1.4 Challenges
4.2 PESTLE Analysis
4.3 Porter’s Five Forces Model
5. Statistical Insights and Trends Reporting
5.1 Adoption Rates, 2023
5.2 User Demographics, By User Type and Roles, 2023
5.3 Feature Analysis, by Feature Type
5.4 Cost Analysis, by Software
5.5 Integration Capabilities
5.6 Regulatory Compliance, by Region
6. Competitive Landscape
6.1 List of Major Companies, By Region
6.2 Market Share Analysis, By Region
6.3 Product Benchmarking
6.3.1 Product specifications and features
6.3.2 Pricing
6.4 Strategic Initiatives
6.4.1 Marketing and promotional activities
6.4.2 Distribution and Supply Chain Strategies
6.4.3 Expansion plans and new product launches
6.4.4 Strategic partnerships and collaborations
6.5 Technological Advancements
6.6 Market Positioning and Branding
7. Healthcare Biometrics Market Segmentation, By Type
7.1 Chapter Overview
7.2 Single-Factor Authentication
7.2.1 Single Factor Authentication Market Trends Analysis (2020-2032)
7.2.2 Single Factor Authentication Market Size Estimates and Forecasts to 2032 (USD Billion)
7.3 Multi-Factor Authentication
7.3.1 Multi-Factor Authentication Market Trends Analysis (2020-2032)
7.3.2 Multi-Factor Authentication Market Size Estimates and Forecasts to 2032 (USD Billion)
7.4 Multimodal Authentication
7.4.1 Multimodal Authentication Market Trends Analysis (2020-2032)
7.4.2 Multimodal Authentication Market Size Estimates and Forecasts to 2032 (USD Billion)
8. Healthcare Biometrics Market Segmentation, By Technology
8.1 Chapter Overview
8.2 Face Recognition
8.2.1 Face Recognition Market Trends Analysis (2020-2032)
8.2.2 Face Recognition Market Size Estimates and Forecasts to 2032 (USD Billion)
8.3 Fingerprint Recognition
8.3.1 Fingerprint Recognition Market Trends Analysis (2020-2032)
8.3.2 Fingerprint Recognition Market Size Estimates and Forecasts to 2032 (USD Billion)
8.4 Iris Recognition
8.4.1 Iris Recognition Market Trends Analysis (2020-2032)
8.4.2 Iris Recognition Market Size Estimates and Forecasts to 2032 (USD Billion)
8.5 Vein Recognition
8.5.1 Vein Recognition Market Trends Analysis (2020-2032)
8.5.2 Vein Recognition Market Size Estimates and Forecasts to 2032 (USD Billion)
8.6 Palm Geometry Recognition
8.6.1 Palm Geometry Recognition Market Trends Analysis (2020-2032)
8.6.2 Palm Geometry Recognition Market Size Estimates and Forecasts to 2032 (USD Billion)
8.7 Behavioral Recognition
8.7.1 Behavioral Recognition Market Trends Analysis (2020-2032)
8.7.2 Behavioral Recognition Market Size Estimates and Forecasts to 2032 (USD Billion)
8.8 Others
8.8.1 Others Market Trends Analysis (2020-2032)
8.8.2 Others Market Size Estimates and Forecasts to 2032 (USD Billion)
9. Healthcare Biometrics Market Segmentation, By Application
9.1 Chapter Overview
9.2 Medical Record Security & Data Protection
9.2.1 Medical Record Security & Data Protection Market Trends Analysis (2020-2032)
9.2.2 Medical Record Security & Data Protection Market Size Estimates and Forecasts to 2032 (USD Billion)
9.3 Patient Identification & Tracking
9.3.1 Patient Identification & Tracking Market Trends Analysis (2020-2032)
9.3.2 Patient Identification & Tracking Market Size Estimates and Forecasts to 2032 (USD Billion)
9.4 Workforce Management
9.4.1 Workforce Management Market Trends Analysis (2020-2032)
9.4.2 Workforce Management Market Size Estimates and Forecasts to 2032 (USD Billion)
9.5 Pharmacy Dispensing
9.5.1 Pharmacy Dispensing Market Trends Analysis (2020-2032)
9.5.2 Pharmacy Dispensing Market Size Estimates and Forecasts to 2032 (USD Billion)
9.6 Others
9.6.1 Others Market Trends Analysis (2020-2032)
9.6.2 Others Market Size Estimates and Forecasts to 2032 (USD Billion)
10. Healthcare Biometrics Market Segmentation, By End-use
10.1 Chapter Overview
10.2 Hospitals & Clinics
10.2.1 Hospitals & Clinics Market Trends Analysis (2020-2032)
10.2.2 Hospitals & Clinics Market Size Estimates and Forecasts to 2032 (USD Billion)
10.3 Healthcare Institutions
10.3.1 Healthcare Institutions Market Trends Analysis (2020-2032)
10.3.2 Healthcare Institutions Market Size Estimates and Forecasts to 2032 (USD Billion)
10.4 Research & Clinical Laboratories
10.4.1 Research & Clinical Laboratories Market Trends Analysis (2020-2032)
10.4.2 Research & Clinical Laboratories Market Size Estimates and Forecasts to 2032 (USD Billion)
11. Regional Analysis
11.1 Chapter Overview
11.2 North America
11.2.1 Trends Analysis
11.2.2 North America Healthcare Biometrics Market Estimates and Forecasts, by Country (2020-2032) (USD Billion)
11.2.3 North America Healthcare Biometrics Market Estimates and Forecasts, By Type (2020-2032) (USD Billion)
11.2.4 North America Healthcare Biometrics Market Estimates and Forecasts, By Technology (2020-2032) (USD Billion)
11.2.5 North America Healthcare Biometrics Market Estimates and Forecasts, By Application (2020-2032) (USD Billion)
11.2.6 North America Healthcare Biometrics Market Estimates and Forecasts, By End-use (2020-2032) (USD Billion)
11.2.7 USA
11.2.7.1 USA Healthcare Biometrics Market Estimates and Forecasts, By Type (2020-2032) (USD Billion)
11.2.7.2 USA Healthcare Biometrics Market Estimates and Forecasts, By Technology (2020-2032) (USD Billion)
11.2.7.3 USA Healthcare Biometrics Market Estimates and Forecasts, By Application (2020-2032) (USD Billion)
11.2.7.4 USA Healthcare Biometrics Market Estimates and Forecasts, By End-use (2020-2032) (USD Billion)
11.2.7 Canada
11.2.7.1 Canada Healthcare Biometrics Market Estimates and Forecasts, By Type (2020-2032) (USD Billion)
11.2.7.2 Canada Healthcare Biometrics Market Estimates and Forecasts, By Technology (2020-2032) (USD Billion)
11.2.7.3 Canada Healthcare Biometrics Market Estimates and Forecasts, By Application (2020-2032) (USD Billion)
11.2.7.3 Canada Healthcare Biometrics Market Estimates and Forecasts, By End-use (2020-2032) (USD Billion)
11.2.8 Mexico
11.2.8.1 Mexico Healthcare Biometrics Market Estimates and Forecasts, By Type (2020-2032) (USD Billion)
11.2.8.2 Mexico Healthcare Biometrics Market Estimates and Forecasts, By Technology (2020-2032) (USD Billion)
11.2.8.3 Mexico Healthcare Biometrics Market Estimates and Forecasts, By Application (2020-2032) (USD Billion)
11.2.8.3 Mexico Healthcare Biometrics Market Estimates and Forecasts, By End-use (2020-2032) (USD Billion)
11.3 Europe
11.3.1 Eastern Europe
11.3.1.1 Trends Analysis
11.3.1.2 Eastern Europe Healthcare Biometrics Market Estimates and Forecasts, by Country (2020-2032) (USD Billion)
11.3.1.3 Eastern Europe Healthcare Biometrics Market Estimates and Forecasts, By Type (2020-2032) (USD Billion)
11.3.1.4 Eastern Europe Healthcare Biometrics Market Estimates and Forecasts, By Technology (2020-2032) (USD Billion)
11.3.1.5 Eastern Europe Healthcare Biometrics Market Estimates and Forecasts, By Application (2020-2032) (USD Billion)
11.3.1.5 Eastern Europe Healthcare Biometrics Market Estimates and Forecasts, By End-use (2020-2032) (USD Billion)
11.3.1.6 Poland
11.3.1.6.1 Poland Healthcare Biometrics Market Estimates and Forecasts, By Type (2020-2032) (USD Billion)
11.3.1.6.2 Poland Healthcare Biometrics Market Estimates and Forecasts, By Technology (2020-2032) (USD Billion)
11.3.1.6.3 Poland Healthcare Biometrics Market Estimates and Forecasts, By Application (2020-2032) (USD Billion)
11.3.1.6.3 Poland Healthcare Biometrics Market Estimates and Forecasts, By End-use (2020-2032) (USD Billion)
11.3.1.7 Romania
11.3.1.7.1 Romania Healthcare Biometrics Market Estimates and Forecasts, By Type (2020-2032) (USD Billion)
11.3.1.7.2 Romania Healthcare Biometrics Market Estimates and Forecasts, By Technology (2020-2032) (USD Billion)
11.3.1.7.3 Romania Healthcare Biometrics Market Estimates and Forecasts, By Application (2020-2032) (USD Billion)
11.3.1.7.3 Romania Healthcare Biometrics Market Estimates and Forecasts, By End-use (2020-2032) (USD Billion)
11.3.1.8 Hungary
11.3.1.8.1 Hungary Healthcare Biometrics Market Estimates and Forecasts, By Type (2020-2032) (USD Billion)
11.3.1.8.2 Hungary Healthcare Biometrics Market Estimates and Forecasts, By Technology (2020-2032) (USD Billion)
11.3.1.8.3 Hungary Healthcare Biometrics Market Estimates and Forecasts, By Application (2020-2032) (USD Billion)
11.3.1.8.3 Hungary Healthcare Biometrics Market Estimates and Forecasts, By End-use (2020-2032) (USD Billion)
11.3.1.9 Turkey
11.3.1.9.1 Turkey Healthcare Biometrics Market Estimates and Forecasts, By Type (2020-2032) (USD Billion)
11.3.1.9.2 Turkey Healthcare Biometrics Market Estimates and Forecasts, By Technology (2020-2032) (USD Billion)
11.3.1.9.3 Turkey Healthcare Biometrics Market Estimates and Forecasts, By Application (2020-2032) (USD Billion)
11.3.1.9.3 Turkey Healthcare Biometrics Market Estimates and Forecasts, By End-use (2020-2032) (USD Billion)
11.3.1.11 Rest of Eastern Europe
11.3.1.11.1 Rest of Eastern Europe Healthcare Biometrics Market Estimates and Forecasts, By Type (2020-2032) (USD Billion)
11.3.1.11.2 Rest of Eastern Europe Healthcare Biometrics Market Estimates and Forecasts, By Technology (2020-2032) (USD Billion)
11.3.1.11.3 Rest of Eastern Europe Healthcare Biometrics Market Estimates and Forecasts, By Application (2020-2032) (USD Billion)
11.3.1.11.3 Rest of Eastern Europe Healthcare Biometrics Market Estimates and Forecasts, By End-use (2020-2032) (USD Billion)
11.3.2 Western Europe
11.3.2.1 Trends Analysis
11.3.2.2 Western Europe Healthcare Biometrics Market Estimates and Forecasts, by Country (2020-2032) (USD Billion)
11.3.2.3 Western Europe Healthcare Biometrics Market Estimates and Forecasts, By Type (2020-2032) (USD Billion)
11.3.2.4 Western Europe Healthcare Biometrics Market Estimates and Forecasts, By Technology (2020-2032) (USD Billion)
11.3.2.5 Western Europe Healthcare Biometrics Market Estimates and Forecasts, By Application (2020-2032) (USD Billion)
11.3.2.5 Western Europe Healthcare Biometrics Market Estimates and Forecasts, By End-use (2020-2032) (USD Billion)
11.3.2.6 Germany
11.3.2.6.1 Germany Healthcare Biometrics Market Estimates and Forecasts, By Type (2020-2032) (USD Billion)
11.3.2.6.2 Germany Healthcare Biometrics Market Estimates and Forecasts, By Technology (2020-2032) (USD Billion)
11.3.2.6.3 Germany Healthcare Biometrics Market Estimates and Forecasts, By Application (2020-2032) (USD Billion)
11.3.2.6.3 Germany Healthcare Biometrics Market Estimates and Forecasts, By End-use (2020-2032) (USD Billion)
11.3.2.7 France
11.3.2.7.1 France Healthcare Biometrics Market Estimates and Forecasts, By Type (2020-2032) (USD Billion)
11.3.2.7.2 France Healthcare Biometrics Market Estimates and Forecasts, By Technology (2020-2032) (USD Billion)
11.3.2.7.3 France Healthcare Biometrics Market Estimates and Forecasts, By Application (2020-2032) (USD Billion)
11.3.2.7.3 France Healthcare Biometrics Market Estimates and Forecasts, By End-use (2020-2032) (USD Billion)
11.3.2.8 UK
11.3.2.8.1 UK Healthcare Biometrics Market Estimates and Forecasts, By Type (2020-2032) (USD Billion)
11.3.2.8.2 UK Healthcare Biometrics Market Estimates and Forecasts, By Technology (2020-2032) (USD Billion)
11.3.2.8.3 UK Healthcare Biometrics Market Estimates and Forecasts, By Application (2020-2032) (USD Billion)
11.3.2.8.3 UK Healthcare Biometrics Market Estimates and Forecasts, By End-use (2020-2032) (USD Billion)
11.3.2.9 Italy
11.3.2.9.1 Italy Healthcare Biometrics Market Estimates and Forecasts, By Type (2020-2032) (USD Billion)
11.3.2.9.2 Italy Healthcare Biometrics Market Estimates and Forecasts, By Technology (2020-2032) (USD Billion)
11.3.2.9.3 Italy Healthcare Biometrics Market Estimates and Forecasts, By Application (2020-2032) (USD Billion)
11.3.2.9.3 Italy Healthcare Biometrics Market Estimates and Forecasts, By End-use (2020-2032) (USD Billion)
11.3.2.11 Spain
11.3.2.11.1 Spain Healthcare Biometrics Market Estimates and Forecasts, By Type (2020-2032) (USD Billion)
11.3.2.11.2 Spain Healthcare Biometrics Market Estimates and Forecasts, By Technology (2020-2032) (USD Billion)
11.3.2.11.3 Spain Healthcare Biometrics Market Estimates and Forecasts, By Application (2020-2032) (USD Billion)
11.3.2.11.3 Spain Healthcare Biometrics Market Estimates and Forecasts, By End-use (2020-2032) (USD Billion)
11.3.2.11 Netherlands
11.3.2.11.1 Netherlands Healthcare Biometrics Market Estimates and Forecasts, By Type (2020-2032) (USD Billion)
11.3.2.11.2 Netherlands Healthcare Biometrics Market Estimates and Forecasts, By Technology (2020-2032) (USD Billion)
11.3.2.11.3 Netherlands Healthcare Biometrics Market Estimates and Forecasts, By Application (2020-2032) (USD Billion)
11.3.2.11.3 Netherlands Healthcare Biometrics Market Estimates and Forecasts, By End-use (2020-2032) (USD Billion)
11.3.2.12 Switzerland
11.3.2.12.1 Switzerland Healthcare Biometrics Market Estimates and Forecasts, By Type (2020-2032) (USD Billion)
11.3.2.12.2 Switzerland Healthcare Biometrics Market Estimates and Forecasts, By Technology (2020-2032) (USD Billion)
11.3.2.12.3 Switzerland Healthcare Biometrics Market Estimates and Forecasts, By Application (2020-2032) (USD Billion)
11.3.2.12.3 Switzerland Healthcare Biometrics Market Estimates and Forecasts, By End-use (2020-2032) (USD Billion)
11.3.2.13 Austria
11.3.2.13.1 Austria Healthcare Biometrics Market Estimates and Forecasts, By Type (2020-2032) (USD Billion)
11.3.2.13.2 Austria Healthcare Biometrics Market Estimates and Forecasts, By Technology (2020-2032) (USD Billion)
11.3.2.13.3 Austria Healthcare Biometrics Market Estimates and Forecasts, By Application (2020-2032) (USD Billion)
11.3.2.13.3 Austria Healthcare Biometrics Market Estimates and Forecasts, By End-use (2020-2032) (USD Billion)
11.3.2.14 Rest of Western Europe
11.3.2.14.1 Rest of Western Europe Healthcare Biometrics Market Estimates and Forecasts, By Type (2020-2032) (USD Billion)
11.3.2.14.2 Rest of Western Europe Healthcare Biometrics Market Estimates and Forecasts, By Technology (2020-2032) (USD Billion)
11.3.2.14.3 Rest of Western Europe Healthcare Biometrics Market Estimates and Forecasts, By Application (2020-2032) (USD Billion)
11.3.2.14.3 Rest of Western Europe Healthcare Biometrics Market Estimates and Forecasts, By End-use (2020-2032) (USD Billion)
11.4 Asia Pacific
11.4.1 Trends Analysis
11.4.2 Asia Pacific Healthcare Biometrics Market Estimates and Forecasts, by Country (2020-2032) (USD Billion)
11.4.3 Asia Pacific Healthcare Biometrics Market Estimates and Forecasts, By Type (2020-2032) (USD Billion)
11.4.4 Asia Pacific Healthcare Biometrics Market Estimates and Forecasts, By Technology (2020-2032) (USD Billion)
11.4.5 Asia Pacific Healthcare Biometrics Market Estimates and Forecasts, By Application (2020-2032) (USD Billion)
11.4.5 Asia Pacific Healthcare Biometrics Market Estimates and Forecasts, By End-use (2020-2032) (USD Billion)
11.4.6 China
11.4.6.1 China Healthcare Biometrics Market Estimates and Forecasts, By Type (2020-2032) (USD Billion)
11.4.6.2 China Healthcare Biometrics Market Estimates and Forecasts, By Technology (2020-2032) (USD Billion)
11.4.6.3 China Healthcare Biometrics Market Estimates and Forecasts, By Application (2020-2032) (USD Billion)
11.4.6.3 China Healthcare Biometrics Market Estimates and Forecasts, By End-use (2020-2032) (USD Billion)
11.4.7 India
11.4.7.1 India Healthcare Biometrics Market Estimates and Forecasts, By Type (2020-2032) (USD Billion)
11.4.7.2 India Healthcare Biometrics Market Estimates and Forecasts, By Technology (2020-2032) (USD Billion)
11.4.7.3 India Healthcare Biometrics Market Estimates and Forecasts, By Application (2020-2032) (USD Billion)
11.4.7.3 India Healthcare Biometrics Market Estimates and Forecasts, By End-use (2020-2032) (USD Billion)
11.4.8 Japan
11.4.8.1 Japan Healthcare Biometrics Market Estimates and Forecasts, By Type (2020-2032) (USD Billion)
11.4.8.2 Japan Healthcare Biometrics Market Estimates and Forecasts, By Technology (2020-2032) (USD Billion)
11.4.8.3 Japan Healthcare Biometrics Market Estimates and Forecasts, By Application (2020-2032) (USD Billion)
11.4.8.3 Japan Healthcare Biometrics Market Estimates and Forecasts, By End-use (2020-2032) (USD Billion)
11.4.9 South Korea
11.4.9.1 South Korea Healthcare Biometrics Market Estimates and Forecasts, By Type (2020-2032) (USD Billion)
11.4.9.2 South Korea Healthcare Biometrics Market Estimates and Forecasts, By Technology (2020-2032) (USD Billion)
11.4.9.3 South Korea Healthcare Biometrics Market Estimates and Forecasts, By Application (2020-2032) (USD Billion)
11.4.9.3 South Korea Healthcare Biometrics Market Estimates and Forecasts, By End-use (2020-2032) (USD Billion)
11.4.11 Vietnam
11.4.11.1 Vietnam Healthcare Biometrics Market Estimates and Forecasts, By Type (2020-2032) (USD Billion)
11.4.11.2 Vietnam Healthcare Biometrics Market Estimates and Forecasts, By Technology (2020-2032) (USD Billion)
11.4.11.3 Vietnam Healthcare Biometrics Market Estimates and Forecasts, By Application (2020-2032) (USD Billion)
11.4.11.3 Vietnam Healthcare Biometrics Market Estimates and Forecasts, By End-use (2020-2032) (USD Billion)
11.4.11 Singapore
11.4.11.1 Singapore Healthcare Biometrics Market Estimates and Forecasts, By Type (2020-2032) (USD Billion)
11.4.11.2 Singapore Healthcare Biometrics Market Estimates and Forecasts, By Technology (2020-2032) (USD Billion)
11.4.11.3 Singapore Healthcare Biometrics Market Estimates and Forecasts, By Application (2020-2032) (USD Billion)
11.4.11.3 Singapore Healthcare Biometrics Market Estimates and Forecasts, By End-use (2020-2032) (USD Billion)
11.4.12 Australia
11.4.12.1 Australia Healthcare Biometrics Market Estimates and Forecasts, By Type (2020-2032) (USD Billion)
11.4.12.2 Australia Healthcare Biometrics Market Estimates and Forecasts, By Technology (2020-2032) (USD Billion)
11.4.12.3 Australia Healthcare Biometrics Market Estimates and Forecasts, By Application (2020-2032) (USD Billion)
11.4.12.3 Australia Healthcare Biometrics Market Estimates and Forecasts, By End-use (2020-2032) (USD Billion)
11.4.13 Rest of Asia Pacific
11.4.13.1 Rest of Asia Pacific Healthcare Biometrics Market Estimates and Forecasts, By Type (2020-2032) (USD Billion)
11.4.13.2 Rest of Asia Pacific Healthcare Biometrics Market Estimates and Forecasts, By Technology (2020-2032) (USD Billion)
11.4.13.3 Rest of Asia Pacific Healthcare Biometrics Market Estimates and Forecasts, By Application (2020-2032) (USD Billion)
11.4.13.3 Rest of Asia Pacific Healthcare Biometrics Market Estimates and Forecasts, By End-use (2020-2032) (USD Billion)
11.5 Middle East and Africa
11.5.1 Middle East
11.5.1.1 Trends Analysis
11.5.1.2 Middle East Healthcare Biometrics Market Estimates and Forecasts, by Country (2020-2032) (USD Billion)
11.5.1.3 Middle East Healthcare Biometrics Market Estimates and Forecasts, By Type (2020-2032) (USD Billion)
11.5.1.4 Middle East Healthcare Biometrics Market Estimates and Forecasts, By Technology (2020-2032) (USD Billion)
11.5.1.5 Middle East Healthcare Biometrics Market Estimates and Forecasts, By Application (2020-2032) (USD Billion)
11.5.1.5 Middle East Healthcare Biometrics Market Estimates and Forecasts, By End-use (2020-2032) (USD Billion)
11.5.1.6 UAE
11.5.1.6.1 UAE Healthcare Biometrics Market Estimates and Forecasts, By Type (2020-2032) (USD Billion)
11.5.1.6.2 UAE Healthcare Biometrics Market Estimates and Forecasts, By Technology (2020-2032) (USD Billion)
11.5.1.6.3 UAE Healthcare Biometrics Market Estimates and Forecasts, By Application (2020-2032) (USD Billion)
11.5.1.6.3 UAE Healthcare Biometrics Market Estimates and Forecasts, By End-use (2020-2032) (USD Billion)
11.5.1.7 Egypt
11.5.1.7.1 Egypt Healthcare Biometrics Market Estimates and Forecasts, By Type (2020-2032) (USD Billion)
11.5.1.7.2 Egypt Healthcare Biometrics Market Estimates and Forecasts, By Technology (2020-2032) (USD Billion)
11.5.1.7.3 Egypt Healthcare Biometrics Market Estimates and Forecasts, By Application (2020-2032) (USD Billion)
11.5.1.7.3 Egypt Healthcare Biometrics Market Estimates and Forecasts, By End-use (2020-2032) (USD Billion)
11.5.1.8 Saudi Arabia
11.5.1.8.1 Saudi Arabia Healthcare Biometrics Market Estimates and Forecasts, By Type (2020-2032) (USD Billion)
11.5.1.8.2 Saudi Arabia Healthcare Biometrics Market Estimates and Forecasts, By Technology (2020-2032) (USD Billion)
11.5.1.8.3 Saudi Arabia Healthcare Biometrics Market Estimates and Forecasts, By Application (2020-2032) (USD Billion)
11.5.1.8.3 Saudi Arabia Healthcare Biometrics Market Estimates and Forecasts, By End-use (2020-2032) (USD Billion)
11.5.1.9 Qatar
11.5.1.9.1 Qatar Healthcare Biometrics Market Estimates and Forecasts, By Type (2020-2032) (USD Billion)
11.5.1.9.2 Qatar Healthcare Biometrics Market Estimates and Forecasts, By Technology (2020-2032) (USD Billion)
11.5.1.9.3 Qatar Healthcare Biometrics Market Estimates and Forecasts, By Application (2020-2032) (USD Billion)
11.5.1.9.3 Qatar Healthcare Biometrics Market Estimates and Forecasts, By End-use (2020-2032) (USD Billion)
11.5.1.11 Rest of Middle East
11.5.1.11.1 Rest of Middle East Healthcare Biometrics Market Estimates and Forecasts, By Type (2020-2032) (USD Billion)
11.5.1.11.2 Rest of Middle East Healthcare Biometrics Market Estimates and Forecasts, By Technology (2020-2032) (USD Billion)
11.5.1.11.3 Rest of Middle East Healthcare Biometrics Market Estimates and Forecasts, By Application (2020-2032) (USD Billion)
11.5.1.11.3 Rest of Middle East Healthcare Biometrics Market Estimates and Forecasts, By End-use (2020-2032) (USD Billion)
11.5.2 Africa
11.5.2.1 Trends Analysis
11.5.2.2 Africa Healthcare Biometrics Market Estimates and Forecasts, by Country (2020-2032) (USD Billion)
11.5.2.3 Africa Healthcare Biometrics Market Estimates and Forecasts, By Type (2020-2032) (USD Billion)
11.5.2.4 Africa Healthcare Biometrics Market Estimates and Forecasts, By Technology (2020-2032) (USD Billion)
11.5.2.5 Africa Healthcare Biometrics Market Estimates and Forecasts, By Application (2020-2032) (USD Billion)
11.5.2.8.3 Africa Healthcare Biometrics Market Estimates and Forecasts, By End-use (2020-2032) (USD Billion)
11.5.2.6 South Africa
11.5.2.6.1 South Africa Healthcare Biometrics Market Estimates and Forecasts, By Type (2020-2032) (USD Billion)
11.5.2.6.2 South Africa Healthcare Biometrics Market Estimates and Forecasts, By Technology (2020-2032) (USD Billion)
11.5.2.6.3 South Africa Healthcare Biometrics Market Estimates and Forecasts, By Application (2020-2032) (USD Billion)
11.5.2.8.3 South Africa Healthcare Biometrics Market Estimates and Forecasts, By End-use (2020-2032) (USD Billion)
11.5.2.7 Nigeria
11.5.2.7.1 Nigeria Healthcare Biometrics Market Estimates and Forecasts, By Type (2020-2032) (USD Billion)
11.5.2.7.2 Nigeria Healthcare Biometrics Market Estimates and Forecasts, By Technology (2020-2032) (USD Billion)
11.5.2.7.3 Nigeria Healthcare Biometrics Market Estimates and Forecasts, By Application (2020-2032) (USD Billion)
11.5.2.8.3 Nigeria Healthcare Biometrics Market Estimates and Forecasts, By End-use (2020-2032) (USD Billion)
11.5.2.8 Rest of Africa
11.5.2.8.1 Rest of Africa Healthcare Biometrics Market Estimates and Forecasts, By Type (2020-2032) (USD Billion)
11.5.2.8.2 Rest of Africa Healthcare Biometrics Market Estimates and Forecasts, By Technology (2020-2032) (USD Billion)
11.5.2.8.3 Rest of Africa Healthcare Biometrics Market Estimates and Forecasts, By Application (2020-2032) (USD Billion)
11.5.2.8.3 Rest of Africa Healthcare Biometrics Market Estimates and Forecasts, By End-use (2020-2032) (USD Billion)
11.6 Latin America
11.6.1 Trends Analysis
11.6.2 Latin America Healthcare Biometrics Market Estimates and Forecasts, by Country (2020-2032) (USD Billion)
11.6.3 Latin America Healthcare Biometrics Market Estimates and Forecasts, By Type (2020-2032) (USD Billion)
11.6.4 Latin America Healthcare Biometrics Market Estimates and Forecasts, By Technology (2020-2032) (USD Billion)
11.6.5 Latin America Healthcare Biometrics Market Estimates and Forecasts, By Application (2020-2032) (USD Billion)
11.6.5 Latin America Healthcare Biometrics Market Estimates and Forecasts, By End-use (2020-2032) (USD Billion)
11.6.6 Brazil
11.6.6.1 Brazil Healthcare Biometrics Market Estimates and Forecasts, By Type (2020-2032) (USD Billion)
11.6.6.2 Brazil Healthcare Biometrics Market Estimates and Forecasts, By Technology (2020-2032) (USD Billion)
11.6.6.3 Brazil Healthcare Biometrics Market Estimates and Forecasts, By Application (2020-2032) (USD Billion)
11.6.6.3 Brazil Healthcare Biometrics Market Estimates and Forecasts, By End-use (2020-2032) (USD Billion)
11.6.7 Argentina
11.6.7.1 Argentina Healthcare Biometrics Market Estimates and Forecasts, By Type (2020-2032) (USD Billion)
11.6.7.2 Argentina Healthcare Biometrics Market Estimates and Forecasts, By Technology (2020-2032) (USD Billion)
11.6.7.3 Argentina Healthcare Biometrics Market Estimates and Forecasts, By Application (2020-2032) (USD Billion)
11.6.7.3 Argentina Healthcare Biometrics Market Estimates and Forecasts, By End-use (2020-2032) (USD Billion)
11.6.8 Colombia
11.6.8.1 Colombia Healthcare Biometrics Market Estimates and Forecasts, By Type (2020-2032) (USD Billion)
11.6.8.2 Colombia Healthcare Biometrics Market Estimates and Forecasts, By Technology (2020-2032) (USD Billion)
11.6.8.3 Colombia Healthcare Biometrics Market Estimates and Forecasts, By Application (2020-2032) (USD Billion)
11.6.8.3 Colombia Healthcare Biometrics Market Estimates and Forecasts, By End-use (2020-2032) (USD Billion)
11.6.9 Rest of Latin America
11.6.9.1 Rest of Latin America Healthcare Biometrics Market Estimates and Forecasts, By Type (2020-2032) (USD Billion)
11.6.9.2 Rest of Latin America Healthcare Biometrics Market Estimates and Forecasts, By Technology (2020-2032) (USD Billion)
11.6.9.3 Rest of Latin America Healthcare Biometrics Market Estimates and Forecasts, By Application (2020-2032) (USD Billion)
11.6.9.3 Rest of Latin America Healthcare Biometrics Market Estimates and Forecasts, By End-use (2020-2032) (USD Billion)
12. Company Profiles
12.1 NEC Corporation
12.1.1 Company Overview
12.1.2 Financial
12.1.3 Products/ Services Offered
12.1.4 SWOT Analysis
12.2 Fujitsu Limited
12.2.1 Company Overview
12.2.2 Financial
12.2.3 Products/ Services Offered
12.2.4 SWOT Analysis
12.3 3M Cogent, Inc.
12.3.1 Company Overview
12.3.2 Financial
12.3.3 Products/ Services Offered
12.3.4 SWOT Analysis
12.4 Bio-Key International, Inc.
12.4.1 Company Overview
12.4.2 Financial
12.4.3 Products/ Services Offered
12.4.4 SWOT Analysis
12.5 Crossmatch Technologies
12.5.1 Company Overview
12.5.2 Financial
12.5.3 Products/ Services Offered
12.5.4 SWOT Analysis
12.6 M2SYS Technology
12.6.1 Company Overview
12.6.2 Financial
12.6.3 Products/ Services Offered
12.6.4 SWOT Analysis
12.7 Safran Identity & Security
12.7.1 Company Overview
12.7.2 Financial
12.7.3 Products/ Services Offered
12.7.4 SWOT Analysis
12.8 Imprivata, Inc.
12.8.1 Company Overview
12.8.2 Financial
12.8.3 Products/ Services Offered
12.8.4 SWOT Analysis
12.9 Integrated Biometrics, LLC
12.9.1 Company Overview
12.9.2 Financial
12.9.3 Products/ Services Offered
12.9.4 SWOT Analysis
12.10 ZKTeco USA
12.10.1 Company Overview
12.10.2 Financial
12.10.3 Products/ Services Offered
12.10.4 SWOT Analysis
13. Use Cases and Best Practices
14. Conclusion
An accurate research report requires proper strategizing as well as implementation. There are multiple factors involved in the completion of good and accurate research report and selecting the best methodology to compete the research is the toughest part. Since the research reports we provide play a crucial role in any company’s decision-making process, therefore we at SNS Insider always believe that we should choose the best method which gives us results closer to reality. This allows us to reach at a stage wherein we can provide our clients best and accurate investment to output ratio.
Each report that we prepare takes a timeframe of 350-400 business hours for production. Starting from the selection of titles through a couple of in-depth brain storming session to the final QC process before uploading our titles on our website we dedicate around 350 working hours. The titles are selected based on their current market cap and the foreseen CAGR and growth.
The 5 steps process:
Step 1: Secondary Research:
Secondary Research or Desk Research is as the name suggests is a research process wherein, we collect data through the readily available information. In this process we use various paid and unpaid databases which our team has access to and gather data through the same. This includes examining of listed companies’ annual reports, Journals, SEC filling etc. Apart from this our team has access to various associations across the globe across different industries. Lastly, we have exchange relationships with various university as well as individual libraries.

Step 2: Primary Research
When we talk about primary research, it is a type of study in which the researchers collect relevant data samples directly, rather than relying on previously collected data. This type of research is focused on gaining content specific facts that can be sued to solve specific problems. Since the collected data is fresh and first hand therefore it makes the study more accurate and genuine.
We at SNS Insider have divided Primary Research into 2 parts.
Part 1 wherein we interview the KOLs of major players as well as the upcoming ones across various geographic regions. This allows us to have their view over the market scenario and acts as an important tool to come closer to the accurate market numbers. As many as 45 paid and unpaid primary interviews are taken from both the demand and supply side of the industry to make sure we land at an accurate judgement and analysis of the market.
This step involves the triangulation of data wherein our team analyses the interview transcripts, online survey responses and observation of on filed participants. The below mentioned chart should give a better understanding of the part 1 of the primary interview.

Part 2: In this part of primary research the data collected via secondary research and the part 1 of the primary research is validated with the interviews from individual consultants and subject matter experts.
Consultants are those set of people who have at least 12 years of experience and expertise within the industry whereas Subject Matter Experts are those with at least 15 years of experience behind their back within the same space. The data with the help of two main processes i.e., FGDs (Focused Group Discussions) and IDs (Individual Discussions). This gives us a 3rd party nonbiased primary view of the market scenario making it a more dependable one while collation of the data pointers.
Step 3: Data Bank Validation
Once all the information is collected via primary and secondary sources, we run that information for data validation. At our intelligence centre our research heads track a lot of information related to the market which includes the quarterly reports, the daily stock prices, and other relevant information. Our data bank server gets updated every fortnight and that is how the information which we collected using our primary and secondary information is revalidated in real time.

Step 4: QA/QC Process
After all the data collection and validation our team does a final level of quality check and quality assurance to get rid of any unwanted or undesired mistakes. This might include but not limited to getting rid of the any typos, duplication of numbers or missing of any important information. The people involved in this process include technical content writers, research heads and graphics people. Once this process is completed the title gets uploader on our platform for our clients to read it.
Step 5: Final QC/QA Process:
This is the last process and comes when the client has ordered the study. In this process a final QA/QC is done before the study is emailed to the client. Since we believe in giving our clients a good experience of our research studies, therefore, to make sure that we do not lack at our end in any way humanly possible we do a final round of quality check and then dispatch the study to the client.
By Type
Single Factor Authentication
Multi Factor Authentication
Multimodal Authentication
By Technology
Face Recognition
Fingerprint Recognition
Iris Recognition
Vein Recognition
Palm Geometry Recognition
Behavioral Recognition
Others
By Application
Medical Record Security & Data Protection:
Patient Identification & Tracking
Workforce Management
Pharmacy Dispensing
Others
By End-use
Hospitals & Clinics
Healthcare Institutions
Research & Clinical Laboratories
Request for Segment Customization as per your Business Requirement: Segment Customization Request
REGIONAL COVERAGE:
North America
US
Canada
Mexico
Europe
Eastern Europe
Poland
Romania
Hungary
Turkey
Rest of Eastern Europe
Western Europe
Germany
France
UK
Italy
Spain
Netherlands
Switzerland
Austria
Rest of Western Europe
Asia Pacific
China
India
Japan
South Korea
Vietnam
Singapore
Australia
Rest of Asia Pacific
Middle East & Africa
Middle East
UAE
Egypt
Saudi Arabia
Qatar
Rest of the Middle East
Africa
Nigeria
South Africa
Rest of Africa
Latin America
Brazil
Argentina
Colombia
Rest of Latin America
Request for Country Level Research Report: Country Level Customization Request
Available Customization
With the given market data, SNS Insider offers customization as per the company’s specific needs. The following customization options are available for the report:
Product Analysis
Criss-Cross segment analysis (e.g. Product X Application)
Product Matrix which gives a detailed comparison of product portfolio of each company
Geographic Analysis
Additional countries in any of the regions
Company Information
Detailed analysis and profiling of additional market players (Up to five)
The Cardiac Assist Devices Market size is projected to reach USD 2.24 Bn by 2032 & valued at USD 1.25 Bn in 2023, growing at a CAGR of 6.06% during 2024-2032.
The Anticoagulation Market Size was valued at USD 35.25 billion in 2022, and is expected to reach USD 61.49 billion by 2030 and grow at a CAGR of 7.9% over the forecast period 2023-2030.
Medical Waste Containers Market Size was valued at USD 2.0 Billion in 2023 and is expected to reach USD 3.91 Billion by 2032, growing at a CAGR of 7.7% over the forecast period 2024-2032.
The High-Performance Liquid Chromatography Market size was valued at USD 4.8 billion in 2023 and is expected to grow to USD 7.83 billion by 2031 and grow at a CAGR of 6.30% over the forecast period of 2024-2031.
The Healthcare Data Storage Market Size was valued at USD 4.7 Bn in 2023 and will reach to USD 15.54 Bn by 2032 and grow at a CAGR of 14.23% by 2024-2032.
The Laser Hair Removal Market Size was valued at USD 1.23 billion in 2023 and is witnessed to reach USD 5.02 billion by 2032 and grow at a CAGR of 17.81% over the forecast period 2024-2032.

Hi! Click one of our member below to chat on Phone
© 2025 All Rights Reserved by SNS Insider Pvt Ltd


