image

Hazardous Area Equipment Market Report Scope & Overview:

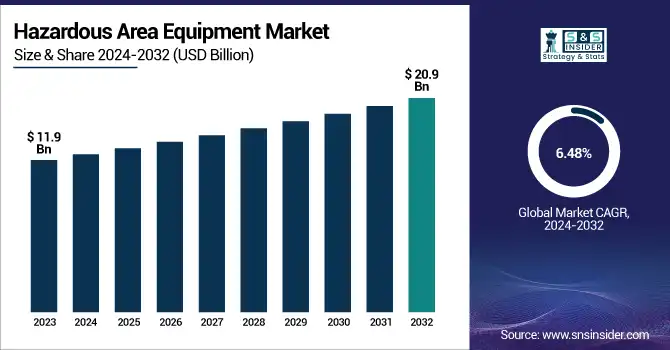
The Hazardous Area Equipment Market was valued at USD 11.9 billion in 2023 and is expected to reach USD 20.9 billion by 2032, growing at a CAGR of 6.48% from 2024-2032.

This report consists of an in-depth analysis of the Hazardous Area Equipment Market, covering industry deployment trends, technological advancements, manufacturing capacity, and supply chain dynamics. Various industries, including oil & gas, chemicals, and mining, are increasingly deploying hazardous area equipment to ensure safety in high-risk environments. Advancements in explosion-proof technologies, such as wireless communication and smart sensors, are enhancing operational efficiency. Manufacturing capacity utilization remains high due to the growing demand for ATEX and IECEx-certified equipment. Additionally, supply chain and distribution trends indicate a shift toward digital platforms and partnerships for streamlined global supply. The report also explores market growth drivers, regulatory impact, and emerging innovations.
The growth of the Hazardous Area Equipment Market was valued at USD 1.6 billion in 2023 and is expected to reach USD 3.0 billion by 2032, growing at a CAGR of  7.32% from 2024-2032. driven by stringent workplace safety regulations, increasing adoption of explosion-proof devices in industries like oil & gas and chemicals, and advancements in IoT-enabled hazardous area equipment. The rise in industrial automation and demand for intrinsically safe equipment is further propelling market expansion. Looking ahead, the U.S. market is expected to witness steady growth, supported by continuous investments in infrastructure safety, technological innovations, and the integration of wireless communication in hazardous environments. The market is forecasted to expand at a significant CAGR, with increasing adoption across manufacturing, mining, and energy sectors ensuring long-term growth.

Market Dynamics

Drivers

  • Stringent safety regulations by OSHA, ATEX, and IECEx are driving the demand for hazardous area equipment across industries.

Due to increasing enforcement of stringent safety regulations in various industries by governments and regulatory bodies like Occupational Safety and Health Administration, ATEX, IECEx, etc, the demand for hazardous area equipment will increase. Industrials like oil & gas, chemicals, mining, and pharmaceuticals need to follow explosion-proof and intrinsically safe equipment types to keep their workplaces stored and protected. An increasing number of incidents of industrial accidents and fire hazards has amplified compliance requirements. At the same time, innovations in hazardous area equipment, such as IoT connectivity and wireless communication, are driving improved safety and operational effectiveness. All of these factors together indicate a rising uptake of hazardous area equipment in various sectors in the global market.

Restraints 

  • The high investment cost and complex installation process limit the adoption of hazardous area equipment, especially for SMEs.

One of the key challenges in the hazardous area equipment market is the high initial investment required for explosion-proof and intrinsically safe equipment. The complex installation process, requiring specialized expertise and adherence to regulatory standards, further adds to the overall costs. Small and medium-sized enterprises (SMEs) often face budget constraints in adopting advanced hazardous area equipment. Additionally, maintenance and periodic testing of these devices add to operational expenses. These cost-related factors can slow market adoption, especially in price-sensitive regions where companies may seek alternative safety solutions instead of investing in high-end hazardous area equipment.

Opportunities 

  • IoT-enabled monitoring and wireless hazardous area equipment are creating new opportunities for enhanced safety and efficiency.

The increasing adoption of IoT and wireless communication in hazardous area equipment is creating new market opportunities. Smart sensors, real-time monitoring solutions, and AI-powered predictive maintenance are transforming workplace safety by providing advanced risk assessment and preventive measures. Wireless hazardous area equipment reduces the need for complex cabling, lowering installation costs and improving flexibility in industrial operations. Industries are increasingly investing in automation and real-time data analytics to enhance efficiency and minimize risks. As companies focus on digital transformation, the demand for intelligent hazardous area equipment is expected to grow, driving innovation and expansion in the market.

Challenges 

  • Global supply chain disruptions and raw material shortages are impacting the availability and production of hazardous area equipment.

The hazardous area equipment market finds itself hampered by supply chain disruptions due to global trade barriers, scarcity of raw materials, and geopolitical tensions. Explosion-proof equipment is produced using certified components that meet strict regulations, and delays in component availability can slow manufacturing timelines. Market uncertainties extend to volatile raw material prices and transportation constraints. Hence, manufacturers are prioritising to de-risk their supply chains and invest in regional production bases. Nonetheless, supply chain volatility remains a key threat to market growth in the short run.

Segmentation Analysis

By Product

Cable glands and accessories dominated the market and accounted for 28% of the revenue share in 2023, as they play an important role in securing electrical connections made in a hazardous environment. These products are used extensively in industries ranging from oil & gas to chemicals to mining to prevent sparks and explosions from electrical failures. The growing standards for industrial safety and the increasing manufacturing and energy sectors will continue to uphold demand.

Control panel products are projected to be the fastest-growing, with the increasing adoption of automation and smart control systems in hazardous areas. Therefore, industries are using more explosion-proof control panels for better efficiency of the production process. Market growth is driven by the integration of IoT and real-time monitoring solutions into these panels.

By Industry

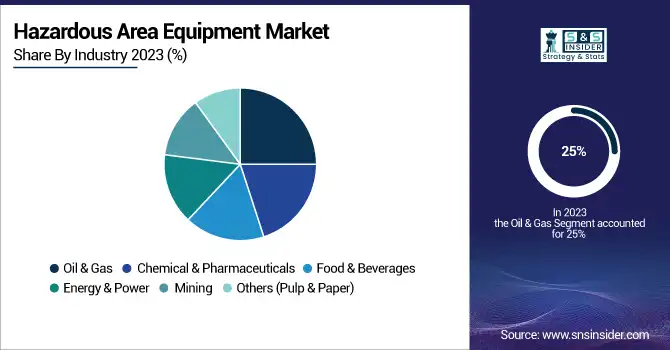
Oil & gas dominated the market and accounted for 25% of revenue share in 2023, As the most hazardous and critical sector in terms of risk of explosion and fire. The demand for well-protected electrical and monitoring devices is due to stringent safety regulations such as ATEX and IECEx certifications. The continued growth of the industry, with new drilling projects and upgrades to refineries, increasingly drives the demand for hazardous area equipment.

The food & beverage industry is expected to register the fastest CAGR during the forecast period, with rising regulatory emphasis on explosion-proof equipment for processing facilities where vapors, dust, and combustible materials pose hazards. Demand for electrical components is rising due to the increase in automation in food production and beverage bottling plants. Moreover, the growth of dairy, grain processing, and brewing industries across the globe is also supporting the market growth.
Regional Analysis

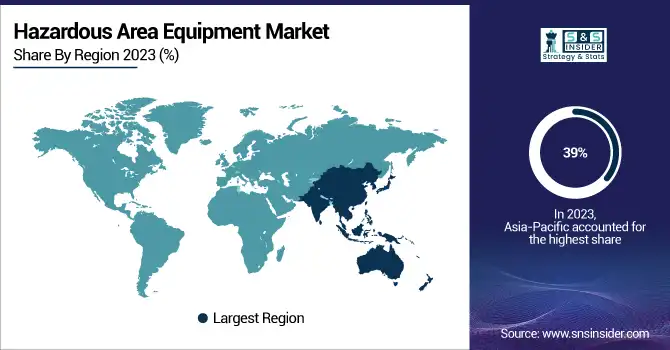
Asia-Pacific dominated the market and accounted for 39% of revenue share, where the industrial sector, especially oil & gas, chemicals, and mining, is expanding at a high rate. In countries such as China and India, substantial investments are also being allocated to refining, petrochemical, and power generation industries, creating a need for explosion-proof equipment. The market is also driven by government regulations to promote workplace safety and the increasing adoption of industrial automation.

North America is projected to witness the fastest CAGR on account of increasing spending in the development of current industrial infrastructure and stringent safety guidelines by OSHA & NFPA. Another significant growth driver is the rising adoption of IoT-enabled hazardous area equipment for real-time monitoring and predictive maintenance. Moreover, the growing offshore drilling activities, in addition to the expanding refineries in the U.S. and Canada, will demand it further.
Key players

The major key players along with their products are

  • Eaton – Crouse-Hinds Series Explosion-Proof Lighting

  • ABB – Flameproof Motors

  • Siemens – SIMATIC HMI Panels for Hazardous Areas

  • Rockwell Automation – Allen-Bradley Explosion-Protected Switches

  • Schneider Electric – Telemecanique Sensors for Hazardous Areas

  • Honeywell – Sensepoint XCD Gas Detector

  • Emerson Electric – Rosemount 628 Universal Gas Sensor

  • General Electric – EX-Proof LED Lighting Fixtures

  • R. Stahl – Explosion-Proof Control Stations

  • BARTEC – PIXA Explosion-Protected Smartphones

  • Pepperl+Fuchs – Purge and Pressurization Systems

  • Hubbell – Killark Explosion-Proof Enclosures

  • WEG – W22X Explosion-Proof Motors

  • Thuba – Flameproof Junction Boxes

  • Intertek – ATEX and IECEx Certification Services

Recent Developments

  • ​In November 2024, Honeywell International announced plans to sell its personal protective equipment (PPE) business to Protective Industrial Products for $1.33 billion in cash. This divestiture aligns with Honeywell's strategy to focus on core areas such as automation, aviation, and energy transition. ​

  • In December 2024, ABB Ltd unveiled a new range of low-voltage flameproof motors designed for industrial plants. These motors offer increased reliability and reduced maintenance requirements, catering to industries like oil & gas and food & beverages.

  • In January 2025, Siemens AG introduced an advanced communication system for hazardous areas, integrating real-time data analytics to enhance operational safety and efficiency. 

  • In January 2025, Avon Technologies secured an $18 million contract from the U.S. military to supply combat helmets through its subsidiary, Team Wendy. This order is part of the U.S. Army’s next-generation head protection program. ​

Hazardous Area Equipment Market Report Scope:

Report Attributes

Details

Market Size in 2023

US$ 11.9 Billion

Market Size by 2032

US$ 20.9 Billion

CAGR

CAGR of 6.48 % From 2024 to 2032

Base Year

2023

Forecast Period

2024-2032

Historical Data

2020-2022

Report Scope & Coverage

Market Size, Segments Analysis, Competitive  Landscape, Regional Analysis, DROC & SWOT Analysis, Forecast Outlook

Key Segments

• By Product (Cable Glands and Accessories, Measurement Devices, Control Panel Products, Alarm Systems, Gas Detector, Fire Detector, Motors, Lighting Products)
• By Industry (Oil & Gas, Chemical & Pharmaceuticals, Food & Beverages, Energy & Power, Mining, Others (Pulp & Paper))

Regional Analysis/Coverage

North America (US, Canada, Mexico), Europe (Eastern Europe [Poland, Romania, Hungary, Turkey, Rest of Eastern Europe] Western Europe] Germany, France, UK, Italy, Spain, Netherlands, Switzerland, Austria, Rest of Western Europe]), Asia Pacific (China, India, Japan, South Korea, Vietnam, Singapore, Australia, Rest of Asia Pacific), Middle East & Africa (Middle East [UAE, Egypt, Saudi Arabia, Qatar, Rest of Middle East], Africa [Nigeria, South Africa, Rest of Africa], Latin America (Brazil, Argentina, Colombia, Rest of Latin America)

Company Profiles

Eaton, ABB, Siemens, Rockwell Automation, Schneider Electric, Honeywell, Emerson Electric, General Electric, R. Stahl, BARTEC, Pepperl+Fuchs, Hubbell, WEG, Thuba, Intertek

Frequently Asked Questions

Ans - The Hazardous Area Equipment Market was valued at USD 11.9 billion in 2023 and is expected to reach USD 20.9 billion by 2032

Ans- The CAGR of the Hazardous Area Equipment Market during the forecast period is 6.48% from 2024-2032.

Ans- North- America is expected to register the fastest CAGR during the forecast period.

Ans- Stringent safety regulations by OSHA, ATEX, and IECEx are driving the demand for hazardous area equipment across industries.

Ans- Global supply chain disruptions and raw material shortages are impacting the availability and production of hazardous area equipment.

Table of Content

1. Introduction

1.1 Market Definition

1.2 Scope (Inclusion and Exclusions)

1.3 Research Assumptions

2. Executive Summary

2.1 Market Overview

2.2 Regional Synopsis

2.3 Competitive Summary

3. Research Methodology

3.1 Top-Down Approach

3.2 Bottom-up Approach

3.3. Data Validation

3.4 Primary Interviews

4. Market Dynamics Impact Analysis

4.1 Market Driving Factors Analysis

4.1.2 Drivers

4.1.2 Restraints

4.1.3 Opportunities

4.1.4 Challenges

4.2 PESTLE Analysis

4.3 Porter’s Five Forces Product

5. Statistical Insights and Trends Reporting

5.1 Deployment of Hazardous Area Equipment, by Industry (2023)

5.2 Technological Advancements in Explosion-Proof Devices (Historic and Future)

5.3 Manufacturing Capacity Utilization of Hazardous Area Equipment (2023)

5.4 Supply Chain and Distribution Trends in Hazardous Area Equipment Market

6. Competitive Landscape

6.1 List of Major Companies, By Region

6.2 Market Share Analysis, By Region

6.3 Product Benchmarking

6.3.1 Product specifications and features

6.3.2 Pricing

6.4 Strategic Initiatives

6.4.1 Marketing and promotional activities

6.4.2 Distribution and supply chain strategies

6.4.3 Expansion plans and new product launches

6.4.4 Strategic partnerships and collaborations

6.5 Technological Advancements

6.6 Market Positioning and Branding

7. Hazardous Area Equipment Market Segmentation, by Product

7.1 Chapter Overview

7.2 Cable Glands and Accessories

7.2.1 Cable Glands and Accessories Market Trends Analysis (2020-2032)

7.2.2 Cable Glands and Accessories Market Size Estimates and Forecasts to 2032 (USD Billion)

7.3 Measurement Devices

7.3.1 Measurement Devices Market Trends Analysis (2020-2032)

7.3.2 Measurement Devices Market Size Estimates and Forecasts to 2032 (USD Billion)

7.4 Control Panel Products

7.4.1 Control Panel Products Market Trends Analysis (2020-2032)

7.4.2 Control Panel Products Market Size Estimates and Forecasts to 2032 (USD Billion)

7.5 Alarm Systems

7.5.1 Alarm Systems Market Trends Analysis (2020-2032)

7.5.2 Alarm Systems Market Size Estimates and Forecasts to 2032 (USD Billion)

7.6 Gas Detector

7.6.1 Gas Detector Market Trends Analysis (2020-2032)

7.6.2 Gas Detector Market Size Estimates and Forecasts to 2032 (USD Billion)

7.7 Fire Detector

7.7.1 Fire Detector Market Trends Analysis (2020-2032)

7.7.2 Fire Detector Market Size Estimates and Forecasts to 2032 (USD Billion)

7.8 Motors

7.8.1 Motors Market Trends Analysis (2020-2032)

7.8.2 Motors Market Size Estimates and Forecasts to 2032 (USD Billion)

7.9 Lighting Products

7.9.1 Lighting Products Market Trends Analysis (2020-2032)

7.9.2 Lighting Products Market Size Estimates and Forecasts to 2032 (USD Billion)

8. Hazardous Area Equipment Market Segmentation, by Industry

8.1 Chapter Overview

8.2 Oil & Gas

8.2.1 Oil & Gas Market Trends Analysis (2020-2032)

8.2.2 Oil & Gas Market Size Estimates and Forecasts to 2032 (USD Billion)

8.3 Chemical & Pharmaceuticals

8.3.1 Chemical & Pharmaceuticals Market Trends Analysis (2020-2032)

8.3.2 Chemical & Pharmaceuticals Market Size Estimates and Forecasts to 2032 (USD Billion)

8.4 Food & Beverages

8.4.1 Food & Beverages Market Trends Analysis (2020-2032)

8.4.2 Food & Beverages Market Size Estimates and Forecasts to 2032 (USD Billion)

8.5 Energy & Power

8.5.1Energy & Power Market Trends Analysis (2020-2032)

8.5.2 Energy & Power Market Size Estimates and Forecasts to 2032 (USD Billion)

8.6 Mining

8.6.1Mining Market Trends Analysis (2020-2032)

8.6.2 Mining Market Size Estimates and Forecasts to 2032 (USD Billion)

8.7 Others (Pulp & Paper)

8.7.1Others (Pulp & Paper) Market Trends Analysis (2020-2032)

8.7.2 Others (Pulp & Paper) Market Size Estimates and Forecasts to 2032 (USD Billion)

9. Regional Analysis

9.1 Chapter Overview

9.2 North America

9.2.1 Trends Analysis

9.2.2 North America Hazardous Area Equipment Market Estimates and Forecasts, by Country (2020-2032) (USD Billion)

9.2.3 North America Hazardous Area Equipment Market Estimates and Forecasts, by Product (2020-2032) (USD Billion) 

9.2.4 North America Hazardous Area Equipment Market Estimates and Forecasts, by Industry (2020-2032) (USD Billion)

9.2.5 USA

9.2.5.1 USA Hazardous Area Equipment Market Estimates and Forecasts, by Product (2020-2032) (USD Billion)

9.2.5.2 USA Hazardous Area Equipment Market Estimates and Forecasts, by Industry (2020-2032) (USD Billion)

9.2.6 Canada

9.2.6.1 Canada Hazardous Area Equipment Market Estimates and Forecasts, by Product (2020-2032) (USD Billion)

9.2.6.2 Canada Hazardous Area Equipment Market Estimates and Forecasts, by Industry (2020-2032) (USD Billion)

9.2.7 Mexico

9.2.7.1 Mexico Hazardous Area Equipment Market Estimates and Forecasts, by Product (2020-2032) (USD Billion)

9.2.7.2 Mexico Hazardous Area Equipment Market Estimates and Forecasts, by Industry (2020-2032) (USD Billion)

9.3 Europe

9.3.1 Eastern Europe

9.3.1.1 Trends Analysis

9.3.1.2 Eastern Europe Hazardous Area Equipment Market Estimates and Forecasts, by Country (2020-2032) (USD Billion)

9.3.1.3 Eastern Europe Hazardous Area Equipment Market Estimates and Forecasts, by Product (2020-2032) (USD Billion) 

9.3.1.4 Eastern Europe Hazardous Area Equipment Market Estimates and Forecasts, by Industry (2020-2032) (USD Billion)

9.3.1.5 Poland

9.3.1.5.1 Poland Hazardous Area Equipment Market Estimates and Forecasts, by Product (2020-2032) (USD Billion)

9.3.1.5.2 Poland Hazardous Area Equipment Market Estimates and Forecasts, by Industry (2020-2032) (USD Billion)

9.3.1.6 Romania

9.3.1.6.1 Romania Hazardous Area Equipment Market Estimates and Forecasts, by Product (2020-2032) (USD Billion)

9.3.1.6.2 Romania Hazardous Area Equipment Market Estimates and Forecasts, by Industry (2020-2032) (USD Billion)

9.3.1.7 Hungary

9.3.1.7.1 Hungary Hazardous Area Equipment Market Estimates and Forecasts, by Product (2020-2032) (USD Billion)

9.3.1.7.2 Hungary Hazardous Area Equipment Market Estimates and Forecasts, by Industry (2020-2032) (USD Billion)

9.3.1.8 Turkey

9.3.1.8.1 Turkey Hazardous Area Equipment Market Estimates and Forecasts, by Product (2020-2032) (USD Billion)

9.3.1.8.2 Turkey Hazardous Area Equipment Market Estimates and Forecasts, by Industry (2020-2032) (USD Billion)

9.3.1.9 Rest of Eastern Europe

9.3.1.9.1 Rest of Eastern Europe Hazardous Area Equipment Market Estimates and Forecasts, by Product (2020-2032) (USD Billion)

9.3.1.9.2 Rest of Eastern Europe Hazardous Area Equipment Market Estimates and Forecasts, by Industry (2020-2032) (USD Billion)

9.3.2 Western Europe

9.3.2.1 Trends Analysis

9.3.2.2 Western Europe Hazardous Area Equipment Market Estimates and Forecasts, by Country (2020-2032) (USD Billion)

9.3.2.3 Western Europe Hazardous Area Equipment Market Estimates and Forecasts, by Product (2020-2032) (USD Billion) 

9.3.2.4 Western Europe Hazardous Area Equipment Market Estimates and Forecasts, by Industry (2020-2032) (USD Billion)

9.3.2.5 Germany

9.3.2.5.1 Germany Hazardous Area Equipment Market Estimates and Forecasts, by Product (2020-2032) (USD Billion)

9.3.2.5.2 Germany Hazardous Area Equipment Market Estimates and Forecasts, by Industry (2020-2032) (USD Billion)

9.3.2.6 France

9.3.2.6.1 France Hazardous Area Equipment Market Estimates and Forecasts, by Product (2020-2032) (USD Billion)

9.3.2.6.2 France Hazardous Area Equipment Market Estimates and Forecasts, by Industry (2020-2032) (USD Billion)

9.3.2.7 UK

9.3.2.7.1 UK Hazardous Area Equipment Market Estimates and Forecasts, by Product (2020-2032) (USD Billion)

9.3.2.7.2 UK Hazardous Area Equipment Market Estimates and Forecasts, by Industry (2020-2032) (USD Billion)

9.3.2.8 Italy

9.3.2.8.1 Italy Hazardous Area Equipment Market Estimates and Forecasts, by Product (2020-2032) (USD Billion)

9.3.2.8.2 Italy Hazardous Area Equipment Market Estimates and Forecasts, by Industry (2020-2032) (USD Billion)

9.3.2.9 Spain

9.3.2.9.1 Spain Hazardous Area Equipment Market Estimates and Forecasts, by Product (2020-2032) (USD Billion)

9.3.2.9.2 Spain Hazardous Area Equipment Market Estimates and Forecasts, by Industry (2020-2032) (USD Billion)

9.3.2.10 Netherlands

9.3.2.10.1 Netherlands Hazardous Area Equipment Market Estimates and Forecasts, by Product (2020-2032) (USD Billion)

9.3.2.10.2 Netherlands Hazardous Area Equipment Market Estimates and Forecasts, by Industry (2020-2032) (USD Billion)

9.3.2.11 Switzerland

9.3.2.11.1 Switzerland Hazardous Area Equipment Market Estimates and Forecasts, by Product (2020-2032) (USD Billion)

9.3.2.11.2 Switzerland Hazardous Area Equipment Market Estimates and Forecasts, by Industry (2020-2032) (USD Billion)

9.3.2.12 Austria

9.3.2.12.1 Austria Hazardous Area Equipment Market Estimates and Forecasts, by System (2020-2032) (USD Billion)

9.3.2.12.2 Austria Hazardous Area Equipment Market Estimates and Forecasts, by Industry (2020-2032) (USD Billion)

9.3.2.13 Rest of Western Europe

9.3.2.13.1 Rest of Western Europe Hazardous Area Equipment Market Estimates and Forecasts, by Product (2020-2032) (USD Billion)

9.3.2.13.2 Rest of Western Europe Hazardous Area Equipment Market Estimates and Forecasts, by Industry (2020-2032) (USD Billion)

9.4 Asia Pacific

9.4.1 Trends Analysis

9.4.2 Asia Pacific Hazardous Area Equipment Market Estimates and Forecasts, by Country (2020-2032) (USD Billion)

9.4.3 Asia Pacific Hazardous Area Equipment Market Estimates and Forecasts, by Product (2020-2032) (USD Billion) 

9.4.4 Asia Pacific Hazardous Area Equipment Market Estimates and Forecasts, by Industry (2020-2032) (USD Billion)

9.4.5 China

9.4.5.1 China Hazardous Area Equipment Market Estimates and Forecasts, by Product (2020-2032) (USD Billion)

9.4.5.2 China Hazardous Area Equipment Market Estimates and Forecasts, by Industry (2020-2032) (USD Billion)

9.4.6 India

9.4.5.1 India Hazardous Area Equipment Market Estimates and Forecasts, by Product (2020-2032) (USD Billion)

9.4.5.2 India Hazardous Area Equipment Market Estimates and Forecasts, by Industry (2020-2032) (USD Billion)

9.4.5 Japan

9.4.5.1 Japan Hazardous Area Equipment Market Estimates and Forecasts, by Product (2020-2032) (USD Billion)

9.4.5.2 Japan Hazardous Area Equipment Market Estimates and Forecasts, by Industry (2020-2032) (USD Billion)

9.4.6 South Korea

9.4.6.1 South Korea Hazardous Area Equipment Market Estimates and Forecasts, by Product (2020-2032) (USD Billion)

9.4.6.2 South Korea Hazardous Area Equipment Market Estimates and Forecasts, by Industry (2020-2032) (USD Billion)

9.4.7 Vietnam

9.4.7.1 Vietnam Hazardous Area Equipment Market Estimates and Forecasts, by Product (2020-2032) (USD Billion)

9.2.7.2 Vietnam Hazardous Area Equipment Market Estimates and Forecasts, by Industry (2020-2032) (USD Billion)

9.4.8 Singapore

9.4.8.1 Singapore Hazardous Area Equipment Market Estimates and Forecasts, by Product (2020-2032) (USD Billion)

9.4.8.2 Singapore Hazardous Area Equipment Market Estimates and Forecasts, by Industry (2020-2032) (USD Billion)

9.4.9 Australia

9.4.9.1 Australia Hazardous Area Equipment Market Estimates and Forecasts, by Product (2020-2032) (USD Billion)

9.4.9.2 Australia Hazardous Area Equipment Market Estimates and Forecasts, by Industry (2020-2032) (USD Billion)

9.4.10 Rest of Asia Pacific

9.4.10.1 Rest of Asia Pacific Hazardous Area Equipment Market Estimates and Forecasts, by Product (2020-2032) (USD Billion)

9.4.10.2 Rest of Asia Pacific Hazardous Area Equipment Market Estimates and Forecasts, by Industry (2020-2032) (USD Billion)

9.5 Middle East and Africa

9.5.1 Middle East

9.5.1.1 Trends Analysis

9.5.1.2 Middle East Hazardous Area Equipment Market Estimates and Forecasts, by Country (2020-2032) (USD Billion)

9.5.1.3 Middle East Hazardous Area Equipment Market Estimates and Forecasts, by Product (2020-2032) (USD Billion) 

9.5.1.4 Middle East Hazardous Area Equipment Market Estimates and Forecasts, by Industry (2020-2032) (USD Billion)

9.5.1.5 UAE

9.5.1.5.1 UAE Hazardous Area Equipment Market Estimates and Forecasts, by Product (2020-2032) (USD Billion)

9.5.1.5.2 UAE Hazardous Area Equipment Market Estimates and Forecasts, by Industry (2020-2032) (USD Billion)

9.5.1.6 Egypt

9.5.1.6.1 Egypt Hazardous Area Equipment Market Estimates and Forecasts, by Product (2020-2032) (USD Billion)

9.5.1.6.2 Egypt Hazardous Area Equipment Market Estimates and Forecasts, by Industry (2020-2032) (USD Billion)

9.5.1.7 Saudi Arabia

9.5.1.7.1 Saudi Arabia Hazardous Area Equipment Market Estimates and Forecasts, by Product (2020-2032) (USD Billion)

9.5.1.7.2 Saudi Arabia Hazardous Area Equipment Market Estimates and Forecasts, by Industry (2020-2032) (USD Billion)

9.5.1.8 Qatar

9.5.1.8.1 Qatar Hazardous Area Equipment Market Estimates and Forecasts, by Product (2020-2032) (USD Billion)

9.5.1.8.2 Qatar Hazardous Area Equipment Market Estimates and Forecasts, by Industry (2020-2032) (USD Billion)

9.5.1.9 Rest of Middle East

9.5.1.9.1 Rest of Middle East Hazardous Area Equipment Market Estimates and Forecasts, by Product (2020-2032) (USD Billion)

9.5.1.9.2 Rest of Middle East Hazardous Area Equipment Market Estimates and Forecasts, by Industry (2020-2032) (USD Billion)

9.5.2 Africa

9.5.2.1 Trends Analysis

9.5.2.2 Africa Hazardous Area Equipment Market Estimates and Forecasts, by Country (2020-2032) (USD Billion)

9.5.2.3 Africa Hazardous Area Equipment Market Estimates and Forecasts, by Product (2020-2032) (USD Billion) 

9.5.2.4 Africa Hazardous Area Equipment Market Estimates and Forecasts, by Industry (2020-2032) (USD Billion)

9.5.2.5 South Africa

9.5.2.5.1 South Africa Hazardous Area Equipment Market Estimates and Forecasts, by Product (2020-2032) (USD Billion)

9.5.2.5.2 South Africa Hazardous Area Equipment Market Estimates and Forecasts, by Industry (2020-2032) (USD Billion)

9.5.2.6 Nigeria

9.5.2.6.1 Nigeria Hazardous Area Equipment Market Estimates and Forecasts, by Product (2020-2032) (USD Billion)

9.5.2.6.2 Nigeria Hazardous Area Equipment Market Estimates and Forecasts, by Industry (2020-2032) (USD Billion)

9.5.2.7 Rest of Africa

9.5.2.7.1 Rest of Africa Hazardous Area Equipment Market Estimates and Forecasts, by Product (2020-2032) (USD Billion)

9.5.2.7.2 Rest of Africa Hazardous Area Equipment Market Estimates and Forecasts, by Industry (2020-2032) (USD Billion)

9.6 Latin America

9.6.1 Trends Analysis

9.6.2 Latin America Hazardous Area Equipment Market Estimates and Forecasts, by Country (2020-2032) (USD Billion)

9.6.3 Latin America Hazardous Area Equipment Market Estimates and Forecasts, by Product (2020-2032) (USD Billion) 

9.6.4 Latin America Hazardous Area Equipment Market Estimates and Forecasts, by Industry (2020-2032) (USD Billion)

9.6.5 Brazil

9.6.5.1 Brazil Hazardous Area Equipment Market Estimates and Forecasts, by Product (2020-2032) (USD Billion)

9.6.5.2 Brazil Hazardous Area Equipment Market Estimates and Forecasts, by Industry (2020-2032) (USD Billion)

9.6.6 Argentina

9.6.6.1 Argentina Hazardous Area Equipment Market Estimates and Forecasts, by Product (2020-2032) (USD Billion)

9.6.6.2 Argentina Hazardous Area Equipment Market Estimates and Forecasts, by Industry (2020-2032) (USD Billion)

9.6.7 Colombia

9.6.7.1 Colombia Hazardous Area Equipment Market Estimates and Forecasts, by Product (2020-2032) (USD Billion)

9.6.7.2 Colombia Hazardous Area Equipment Market Estimates and Forecasts, by Industry (2020-2032) (USD Billion)

9.6.8 Rest of Latin America

9.6.8.1 Rest of Latin America Hazardous Area Equipment Market Estimates and Forecasts, by Product (2020-2032) (USD Billion)

9.6.8.2 Rest of Latin America Hazardous Area Equipment Market Estimates and Forecasts, by Industry (2020-2032) (USD Billion)

10. Company Profiles

10.1 Eaton

              10.1.1 Company Overview

10.1.2 Financial

10.1.3 Products/ Services Offered

110.1.4 SWOT Analysis

10.2 ABB

              10.2.1 Company Overview

10.2.2 Financial

10.2.3 Products/ Services Offered

10.2.4 SWOT Analysis

10.3 Siemens

              10.3.1 Company Overview

10.3.2 Financial

10.3.3 Products/ Services Offered

10.3.4 SWOT Analysis

10.4 Rockwell Automation

              10.4.1 Company Overview

10.4.2 Financial

10.4.3 Products/ Services Offered

10.4.4 SWOT Analysis

10.5 Schneider Electric

               10.5.1 Company Overview

10.5.2 Financial

10.5.3 Products/ Services Offered

10.5.4 SWOT Analysis

10.6 Honeywell

              10.6.1 Company Overview

10.6.2 Financial

10.6.3 Products/ Services Offered

10.6.4 SWOT Analysis

10.7 Emerson Electric

             10.7.1 Company Overview

10.7.2 Financial

10.7.3 Products/ Services Offered

10.7.4 SWOT Analysis

10.8 General Electric

              10.8.1 Company Overview

10.8.2 Financial

10.8.3 Products/ Services Offered

10.8.4 SWOT Analysis

10.9 R. Stahl

              10.9.1 Company Overview

10.9.2 Financial

10.9.3 Products/ Services Offered

10.9.4 SWOT Analysis

10.10 BARTEC

             10.9.1 Company Overview

10.9.2 Financial

10.9.3 Products/ Services Offered

10.9.4 SWOT Analysis

11. Use Cases and Best Practices

12. Conclusion

An accurate research report requires proper strategizing as well as implementation. There are multiple factors involved in the completion of good and accurate research report and selecting the best methodology to compete the research is the toughest part. Since the research reports we provide play a crucial role in any company’s decision-making process, therefore we at SNS Insider always believe that we should choose the best method which gives us results closer to reality. This allows us to reach at a stage wherein we can provide our clients best and accurate investment to output ratio.

Each report that we prepare takes a timeframe of 350-400 business hours for production. Starting from the selection of titles through a couple of in-depth brain storming session to the final QC process before uploading our titles on our website we dedicate around 350 working hours. The titles are selected based on their current market cap and the foreseen CAGR and growth.


The 5 steps process:

Step 1: Secondary Research:

Secondary Research or Desk Research is as the name suggests is a research process wherein, we collect data through the readily available information. In this process we use various paid and unpaid databases which our team has access to and gather data through the same. This includes examining of listed companies’ annual reports, Journals, SEC filling etc. Apart from this our team has access to various associations across the globe across different industries. Lastly, we have exchange relationships with various university as well as individual libraries.

Secondary Research

Step 2: Primary Research

When we talk about primary research, it is a type of study in which the researchers collect relevant data samples directly, rather than relying on previously collected data.  This type of research is focused on gaining content specific facts that can be sued to solve specific problems. Since the collected data is fresh and first hand therefore it makes the study more accurate and genuine.

We at SNS Insider have divided Primary Research into 2 parts.

Part 1 wherein we interview the KOLs of major players as well as the upcoming ones across various geographic regions. This allows us to have their view over the market scenario and acts as an important tool to come closer to the accurate market numbers. As many as 45 paid and unpaid primary interviews are taken from both the demand and supply side of the industry to make sure we land at an accurate judgement and analysis of the market.

This step involves the triangulation of data wherein our team analyses the interview transcripts, online survey responses and observation of on filed participants. The below mentioned chart should give a better understanding of the part 1 of the primary interview.

Primary Research

Part 2: In this part of primary research the data collected via secondary research and the part 1 of the primary research is validated with the interviews from individual consultants and subject matter experts.

Consultants are those set of people who have at least 12 years of experience and expertise within the industry whereas Subject Matter Experts are those with at least 15 years of experience behind their back within the same space. The data with the help of two main processes i.e., FGDs (Focused Group Discussions) and IDs (Individual Discussions). This gives us a 3rd party nonbiased primary view of the market scenario making it a more dependable one while collation of the data pointers.

Step 3: Data Bank Validation

Once all the information is collected via primary and secondary sources, we run that information for data validation. At our intelligence centre our research heads track a lot of information related to the market which includes the quarterly reports, the daily stock prices, and other relevant information. Our data bank server gets updated every fortnight and that is how the information which we collected using our primary and secondary information is revalidated in real time.

Data Bank Validation

Step 4: QA/QC Process

After all the data collection and validation our team does a final level of quality check and quality assurance to get rid of any unwanted or undesired mistakes. This might include but not limited to getting rid of the any typos, duplication of numbers or missing of any important information. The people involved in this process include technical content writers, research heads and graphics people. Once this process is completed the title gets uploader on our platform for our clients to read it.

Step 5: Final QC/QA Process:

This is the last process and comes when the client has ordered the study. In this process a final QA/QC is done before the study is emailed to the client. Since we believe in giving our clients a good experience of our research studies, therefore, to make sure that we do not lack at our end in any way humanly possible we do a final round of quality check and then dispatch the study to the client.

Key Segmentation:

By Product

  • Cable Glands and Accessories

  • Measurement Devices

  • Control Panel Products

  • Alarm Systems

  • Gas Detector

  • Fire Detector

  • Motors

  • Lighting Products

By Industry

  • Oil & Gas

  • Chemical & Pharmaceuticals

  • Food & Beverages

  • Energy & Power

  • Mining

  • Others (Pulp & Paper)

Request for Segment Customization as per your Business Requirement: Segment Customization Request

Regional Coverage:

North America

  • US

  • Canada

  • Mexico

Europe

  • Eastern Europe

    • Poland

    • Romania

    • Hungary

    • Turkey

    • Rest of Eastern Europe

  • Western Europe

    • Germany

    • France

    • UK

    • Italy

    • Spain

    • Netherlands

    • Switzerland

    • Austria

    • Rest of Western Europe

Asia Pacific

  • China

  • India

  • Japan

  • South Korea

  • Vietnam

  • Singapore

  • Australia

  • Rest of Asia Pacific

Middle East & Africa

  • Middle East

    • UAE

    • Egypt

    • Saudi Arabia

    • Qatar

    • Rest of Middle East

  • Africa

    • Nigeria

    • South Africa

    • Rest of Africa

Latin America

  • Brazil

  • Argentina

  • Colombia

  • Rest of Latin America

Request for Country Level Research Report: Country Level Customization Request

Available Customization

With the given market data, SNS Insider offers customization as per the company’s specific needs. The following customization options are available for the report:

  • Detailed Volume Analysis

  • Criss-Cross segment analysis (e.g. Product X Application)

  • Competitive Product Benchmarking

  • Geographic Analysis

  • Additional countries in any of the regions

  • Customized Data Representation

  • Detailed analysis and profiling of additional market players


  •            5000 (33% Discount)


  •            8950 (40% Discount)


  •            3050 (23% Discount)

Start a Conversation

Hi! Click one of our member below to chat on Phone