Haptic Devices Market Report Scope & Overview:
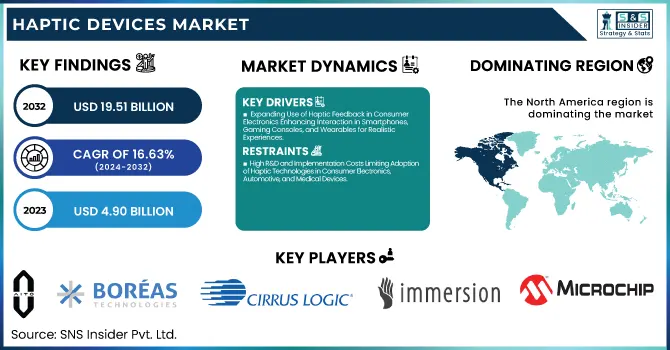
The Haptic Devices Market was valued at USD 4.90 billion in 2023 and is expected to reach USD 19.51 billion by 2032, growing at a CAGR of 16.63% from 2024-2032.
To Get more information on Haptic Devices Market - Request Free Sample Report
This report includes insights into latency performance metrics, production & shipment data, failure rate & durability stats, battery efficiency trends, and investment trends. The market is witnessing rapid growth due to increasing adoption in consumer electronics, automotive, healthcare, and industrial applications. Advancements in haptic feedback technology enhance user experience in gaming, AR/VR, and wearable devices, driving demand. Improved battery efficiency and durability contribute to sustained market expansion, while ongoing investments in R&D fuel innovation. The sector also benefits from rising production volumes and optimized supply chains, ensuring scalability. With continuous technological evolution, haptic devices are set to play a crucial role in next-generation human-machine interaction.
U.S. Haptic Devices Market was valued at USD 1.28 billion in 2023 and is expected to reach USD 5.08 billion by 2032, growing at a CAGR of 16.59% from 2024-2032. The U.S. Haptic Devices Market is experiencing strong growth due to increasing demand in consumer electronics, automotive, healthcare, and gaming industries. The widespread adoption of AR/VR, wearable devices, and advanced touchscreens is driving innovation in haptic technology. The automotive sector is integrating haptic feedback for enhanced driver assistance and infotainment systems, while medical simulations and robotic surgeries are benefiting from precise haptic interfaces. Additionally, rising investments in R&D, improved battery efficiency, and lower latency performance are enhancing product reliability. The expanding gaming industry and increasing consumer preference for immersive experiences further contribute to the market's rapid expansion.
Haptic Devices Market Dynamics
Drivers
-
Expanding Use of Haptic Feedback in Consumer Electronics Enhancing Interaction in Smartphones, Gaming Consoles, and Wearables for Realistic Experiences
The increasing demand for immersive and tactile interactions in smartphones, gaming consoles, and wearables is fueling the growth of haptic technology. Advanced haptic engines are now integrated into modern smartphones to enhance the real-touch feel, making typing, gaming, and notifications smoother. Gaming consoles and controllers use haptic feedback to enhance the real-like response, thereby engaging players better. Wearables, such as smartwatches and fitness bands, utilize haptic vibration for alerts and health notifications, enhancing usability without visual dependency. With increasing consumer demand for natural and interactive digital experiences, producers are investing in next-generation haptic technology with greater accuracy, reduced latency, and multi-sensory feedback. This ongoing innovation in consumer electronics is driving haptic device development, enabling increased adoption in a range of applications, from entertainment to productivity-enhancing interfaces.
Restraints
-
High R&D and Implementation Costs Limiting Adoption of Haptic Technologies in Consumer Electronics, Automotive, and Medical Devices
Designing sophisticated haptic devices requires significant research, innovation, and engineering skills, resulting in higher production expenses. Businesses are required to spend a lot on material science, actuator design, and software algorithms to improve accuracy, realism, and efficiency in haptic feedback. In addition, the integration of haptic technology in consumer devices, automotive, and medical devices uses special hardware and software, adding to the costs. Small and medium-sized manufacturers are unable to implement these technologies because of high initial costs and complicated manufacturing processes. Consequently, price-sensitive markets might constrain the use of haptics, hindering mass adoption. In addition, cost-effective scalability is still a challenge since high-end haptic solutions are generally limited to high-end devices, limiting mass access and mass commercialization.
Opportunities
-
Increasing Adoption of VR and AR Boosting Demand for Advanced Haptic Feedback in Gaming, Training, Simulations, and Skill Development
Growing use of virtual and augmented reality in gaming, training, and simulations is driving the demand for advanced haptic technologies. Consumers demand more immersive and interactive experiences, driving developers to embed accurate touch feelings, vibrations, and force feedback into VR gloves, controllers, and wearable technology. Healthcare, military, and education sectors are using haptic-enabled simulations for training skills, medical operations, and combat preparedness, which improves learning results. The entertainment industry is also investing in haptic-enhanced gaming to build more immersive engagement. As VR/AR technology improves, the need for high-fidelity haptic solutions keeps increasing, leading manufacturers to design more responsive, energy-efficient, and affordable haptic feedback systems to allow more realistic real-world interaction in digital space.
Challenges
-
High Power Consumption in Haptic Systems Reducing Battery Efficiency in Wearables, Smartphones, and Gaming Devices, Limiting Extended Usage and Performance
Haptic feedback technology improves experience but its power consumption is a major challenge, particularly in battery-powered devices. Wearable devices, including smartwatches and fitness trackers, depend on small batteries, and powering haptic actuators consumes power fast, detracting from overall efficiency. The same issue affects smartphones and game controllers that use sophisticated haptics, detracting from battery life and restricting long-term use. Companies need to strike a balance of performance and energy efficiency with robust haptic feedback. The problem increases as customers ask for extended battery life without limiting interactive experiences. There is ongoing research on ultra-low-power actuators and energy-efficient driver circuits, but widespread adoption is hindered by cost and design issues. As mobile and wearables continue to gain adoption, power limitations in haptic devices will be imperative to overcome to integrate them further
Haptic Devices Market Segment Analysis
By Component
The hardware segment led the Haptic Devices Market with the largest revenue share of around 71% in 2023 because of the extensive use of haptic actuators, sensors, and controllers in consumer electronics, automotive, and industrial applications. The growing need for high-precision tactile feedback in smartphones, gaming consoles, and VR devices has spurred hardware development. Moreover, companies are constantly innovating with small, energy-efficient, and affordable components, promoting large-scale integration. The use of physical elements for the provision of real-world touch experiences also reinforces hardware's supremacy.
The software segment will experience the fastest CAGR of approximately 18.21% during 2024-2032, fueled by the increasing demand for complex algorithms, AI feedback systems, and adaptive haptic experiences. As immersive interactions in gaming, AR/VR, and automotive touch interfaces gain popularity, software is vital for enhancing the accuracy of feedback. With the growth in cloud-based haptic solutions and adaptive responses based on AI, user experiences are being boosted, propelling explosive growth in this segment.
By Type
Active Haptic Devices segment led the Haptic Devices Market with a maximum revenue share of approximately 79% in 2023 because it finds extensive application across consumer electronics, automotive interfaces, and industry applications. The devices, which produce real-time force feedback through actuators and sophisticated control systems, improve user experience in gaming, AR/VR, and touchscreens. Increased demand for interactive feedback in smartphones, wearables, and automotive touchscreens has spurred adoption. On-going developments in actuator technology and compatibility with AI-based controls further consolidate its market supremacy.
The Passive Haptic Devices segment is expected to grow at the fastest CAGR of approximately 19.04% during 2024-2032, catalyzed by heightened demand in cost-sensitive applications and low-power environments. As opposed to active systems, passive haptic devices depend on mechanical structures and material properties to render tactile feedback without power requirements. Their increasing popularity in wearables, prosthetic devices, and training simulations renders them a popular choice for energy-saving applications. Increased research in new materials and ergonomic design is driving adoption in a variety of sectors.
By Feedback
The Force Feedback segment led the Haptic Devices Market with the largest revenue share of nearly 38% in 2023 owing to its widespread application in gaming, virtual simulations, and automotive uses. The technology delivers real-world physical feelings by exerting force through actuators, increasing user interaction in VR controllers, medical training simulators, and automotive touchscreens. Healthcare and robotics are some of the industries that make use of force feedback to achieve precision control and realistic training simulations. Its market leadership is further supported by the increasing use of high-fidelity simulation and interactive interfaces.
The Electrotactile Feedback segment will grow at the fastest CAGR of nearly 19.60% during 2024-2032, thanks to its expanding use in next-generation wearable devices, prosthetics, and human-machine interaction. This technology applies electrical stimulation to generate highly accurate tactile sensations, providing a more subtle and programmable feedback experience. Its medical applications, such as sensory restoration for amputees and rehabilitation therapy, are driving innovation. The convergence of AI and neural interfaces is also driving its adoption across industries.
By Usage
The Touchable segment held the largest revenue share of around 51% in 2023 in the Haptic Devices Market because it is extensively integrated in consumer electronics, automotive interfaces, and industrial use. Haptic feedback touchscreens provide richer user experience in smartphones, tablets, and car infotainment systems and thus are extremely popular. The requirement for interactive and high-precision touch responses in consumer and commercial applications has prompted advancements in touch-based haptic solutions. In addition, innovation in multi-touch and surface haptics technologies further reinforces this segment's dominance.
The Wearable segment is anticipated to grow at the fastest CAGR of approximately 19.53% during 2024-2032, fueled by the growing need for haptic-enabled smartwatches, fitness trackers, and AR/VR gloves. Wearable haptics improve user experience in healthcare monitoring, gaming, and virtual training. The growth of remote healthcare options, gesture control, and immersive experiences is fueling acceleration. Ongoing advancements in lightweight, energy-efficient actuators and AI-based adaptive feedback systems are also propelling the fast growth of this segment.
Regional Analysis
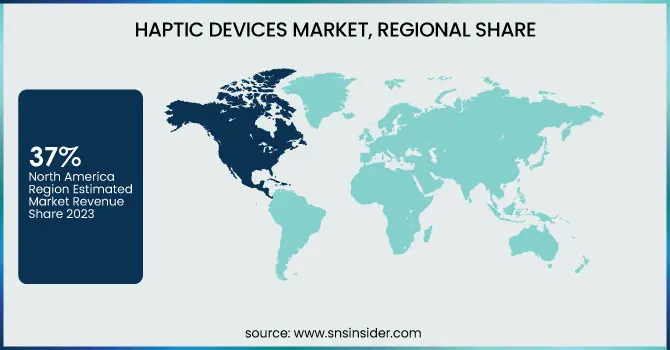
North America dominated the Haptic Devices Market with the highest revenue share of about 37% in 2023 due to strong technological advancements and high adoption of haptic-enabled consumer electronics, gaming, and automotive systems. The presence of key industry players, significant investments in R&D, and increasing demand for immersive experiences in VR/AR applications further drive market growth. Additionally, North America’s well-established healthcare and automotive industries leverage haptic technology for medical simulations, surgical training, and advanced driver-assistance systems, solidifying its leadership in the market.
Asia Pacific is expected to grow at the fastest CAGR of about 18.37% from 2024-2032, driven by rapid industrialization, rising demand for smartphones and gaming devices, and increasing adoption of haptic technology in automotive and consumer electronics. The region's expanding manufacturing sector, particularly in China, Japan, and South Korea, supports large-scale production and innovation in haptic components. Additionally, growing investments in AR/VR applications, wearables, and automation technologies are accelerating market expansion across multiple industries.
Get Customized Report as per Your Business Requirement - Enquiry Now
Key Players
-
AITO: Haptic Touchpad, Haptic Keyboard
-
Boréas Technologies: BOS1211 Piezo Haptic Driver IC, Smart Card Haptics
-
Cirrus Logic Inc.: CS40L25 Haptic Driver, CS40L25B Haptic Driver
-
hap2U: Haptic Smartphone Technology, Haptic Touchscreens
-
Immersion: Active Sensing Technology, Haptic Design Tools
-
Johnson Electric Holdings Limited: Haptic Actuators, Electronic Drives
-
KEMET Corporation: Piezoelectric Haptic Actuators, Haptic Skins
-
Microchip Technology Inc.: Thin-Film Piezoelectric Actuators, MEMS-Based Haptic Solutions
-
Mouser Electronics, Inc.: Vishay IHPT Haptic Feedback Actuators, Haptic Drivers
-
Synaptics Incorporated: Resonate Audio and Haptics Solution, Touch Controllers
-
TDK Corporation: PiezoHapt Actuators, PowerHap Piezo Actuators
-
Texas Instruments Incorporated: DRV2604 Haptic Driver, DRV2667 Piezo Haptic Driver
-
AAC Technologies: Haptic Feedback Actuators, Vibration Motors
-
Ultraleap: STRATOS Inspire Haptic Module, Leap Motion Controller
-
3D Systems, Inc.: Touch Haptic Devices, Phantom Premium Haptic Devices
-
Force Dimension: Omega Haptic Device, Sigma Haptic Device
-
D-BOX Technologies: D-BOX Motion System, Haptic Actuators
-
SMK Corporation: Haptic Touch Panels, Haptic Feedback Modules
-
Awinic Technology: AW8697 Haptic Driver, AW86224 Haptic Driver
-
Infineon Technologies AG: TLE4997 Linear Hall Sensors, TLV493D-A1B6 3D Magnetic Sensor
-
Novasentis Inc.: EMF Haptic Actuators, Flexible Haptic Actuators
-
Renesas Electronics Corporation: RAA458100 Haptic Driver, RAA462113 Haptic Feedback Controller
Recent Developments:
-
In May 2024, Boréas Technologies announced that its BOS1211 Piezo Haptic Driver IC achieved AEC-Q100 Grade 2 automotive qualification. This enables automotive OEMs to integrate highly responsive, localized tactile feedback into vehicle controls, improving driver safety.
-
In 2024, Johnson Electric introduced new actuators designed to enhance haptic feedback in touch screens. These actuators improve user experience by delivering precise and responsive tactile sensations in consumer and automotive applications.
| Report Attributes | Details |
|---|---|
| Market Size in 2023 | USD 4.90 Billion |
| Market Size by 2032 | USD 19.51 Billion |
| CAGR | CAGR of 16.63% From 2024 to 2032 |
| Base Year | 2023 |
| Forecast Period | 2024-2032 |
| Historical Data | 2020-2022 |
| Report Scope & Coverage | Market Size, Segments Analysis, Competitive Landscape, Regional Analysis, DROC & SWOT Analysis, Forecast Outlook |
| Key Segments | • By Component (Hardware, Software) • By Usage (Graspable, Touchable, Wearable) • By Type (Active Haptic Devices, Passive Haptic Devices) • By Feedback (Force Feedback, Vibrotactile Feedback, Electrotactile Feedback, Thermal Feedback, Others) |
| Regional Analysis/Coverage | North America (US, Canada, Mexico), Europe (Eastern Europe [Poland, Romania, Hungary, Turkey, Rest of Eastern Europe] Western Europe] Germany, France, UK, Italy, Spain, Netherlands, Switzerland, Austria, Rest of Western Europe]), Asia Pacific (China, India, Japan, South Korea, Vietnam, Singapore, Australia, Rest of Asia Pacific), Middle East & Africa (Middle East [UAE, Egypt, Saudi Arabia, Qatar, Rest of Middle East], Africa [Nigeria, South Africa, Rest of Africa], Latin America (Brazil, Argentina, Colombia, Rest of Latin America) |
| Company Profiles | AITO, Boréas Technologies, Cirrus Logic Inc., hap2U, Immersion, Johnson Electric Holdings Limited, KEMET Corporation, Microchip Technology Inc., Mouser Electronics, Inc., Synaptics Incorporated, TDK Corporation, Texas Instruments Incorporated, AAC Technologies, Ultraleap, 3D Systems, Inc., Force Dimension, D-BOX Technologies, SMK Corporation, Awinic Technology, Infineon Technologies AG, Novasentis Inc., Renesas Electronics Corporation |
