image

Grow Lights Market Size & Overview
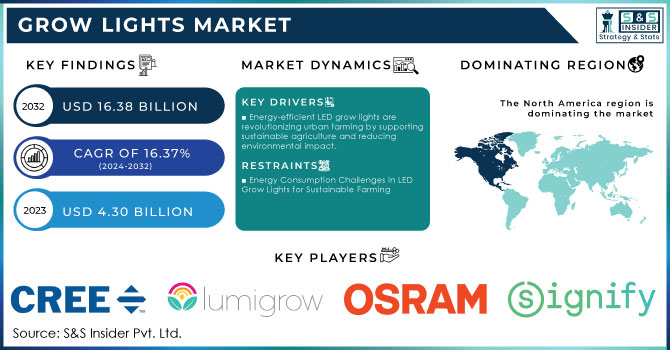
Grow Lights Market,Revenue Analysis

Get More Information on Grow Lights Market - Request Sample Report

The Grow Lights Market Size was valued at USD 4.30 billion in 2023 and is expected to grow to USD 16.38 billion by 2032 and grow at a CAGR of 16.37% over the forecast period of 2024-2032.

The grow lights market is thriving, propelled by the expansion of indoor and vertical farming, particularly in urban areas where space for traditional agriculture is limited. Vertical farming methods, such as those employed by companies like plenty, are revolutionizing the way food is produced. These systems use AI-driven technology to optimize growing conditions for crops like strawberries, enabling year-round production. This innovation not only reduces land use—up to 97% less than conventional farming—but also dramatically cuts water consumption by up to 90%. These advancements align with growing environmental concerns and the need for more sustainable farming practices, as vertical farms can be set up in urban centers, cutting down on food transportation and greenhouse gas emissions. A major challenge with indoor vertical farming is its energy consumption, particularly from artificial lighting, which accounts for more than 50% of energy costs in some setups. Research has identified that energy usage in domestic vertical gardens while providing local, fresh produce year-round can be inefficient, particularly with artificial lighting and ventilation systems.

For instance, domestic vertical farming appliances can consume up to five times more energy than professional setups. Studies suggest that energy management and the adoption of more efficient technologies, such as LED lighting, are key to improving the sustainability of these systems. Moreover, transitioning to renewable energy sources could further reduce the carbon footprint of these farming methods. The future looks promising for the grow lights market, especially with the increasing demand for energy-efficient solutions. Innovations like electro-agriculture, which uses renewable energy and carbon dioxide to grow crops indoors, could play a pivotal role in further reducing land and water use in agriculture. This technique could potentially reduce U.S. agricultural land requirements by 94%, freeing up vast areas for ecosystem restoration. As the technology behind LED grow lights improves, and vertical farming systems become more energy-efficient, they are expected to contribute significantly to feeding the growing global population while minimizing environmental impact. While energy consumption remains a concern, the grow lights market is poised for continued growth, driven by innovations in sustainable farming technologies, improved energy management, and increased adoption of LED and smart lighting systems. These trends align with the broader push for sustainable urban agriculture and could redefine the future of food production.

Grow Lights Market Dynamics

Drivers

  • Energy-efficient LED grow lights are revolutionizing urban farming by supporting sustainable agriculture and reducing environmental impact.

As cities grow and available land diminishes, the need for space-efficient farming methods like vertical farming becomes critical. LED grow lights are at the forefront of this movement, offering energy-efficient, low-carbon solutions that significantly reduce land and water usage. Studies show that LED lighting can reduce energy consumption by up to 80%, making them a key component in sustainable farming practices. Additionally, businesses in agriculture and urban farming are investing heavily in smart lighting solutions, aligning with global sustainability goals. In sectors like cannabis production, LED grow lights have been shown to enhance yields while minimizing environmental impacts. As demand for locally grown, pesticide-free crops increases, the market for energy-efficient grow lights is expected to continue expanding, playing a vital role in urban agriculture’s future. With the global push for carbon neutrality and resource-efficient farming methods, grow lights powered by renewable energy are poised to shape the future of food production.

Restraints

  • Energy Consumption Challenges in LED Grow Lights for Sustainable Farming

A significant restraint in the grow lights market is the energy consumption of these systems, despite their energy-efficient nature. While LED grow lights are designed to be energy saving compared to traditional lighting, their application in large-scale indoor farming can still lead to high electricity usage, especially in regions where energy prices are rising. For instance, the energy consumption of LED lights in grow operations is still considerable, with some systems using up to 0.6 kW per square meter per day, depending on the type of crops grown and lighting intensity. This ongoing energy demand may discourage adoption among smaller, cost-sensitive operations, particularly in areas struggling with energy shortages or high utility costs. Furthermore, despite advancements in solar energy and other renewables, solar solutions may not always be viable for all types of indoor farms, exacerbating concerns about long-term operational costs. As such, managing energy consumption remains a key challenge for the market, and addressing this issue is crucial for improving the sustainability and affordability of LED grow lights in large-scale farming systems.

Grow Lights Market Segmentation Overview

By Component

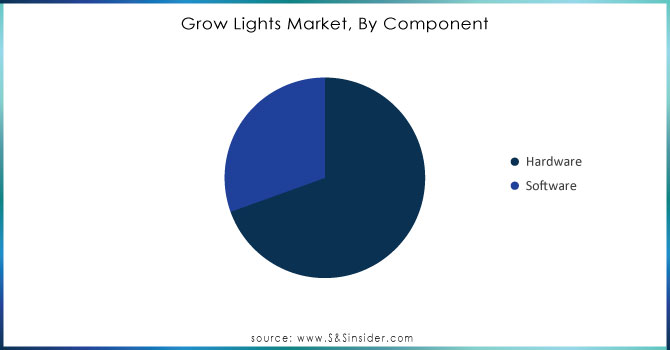
In 2023, the hardware segment of the grow lights market, which includes lighting solutions such as LEDs, high-intensity discharge (HID) lights, and plasma lights, accounted for about 70% of the total market share. This growth is primarily driven by the demand for energy-efficient and durable lighting solutions for both small and large-scale agricultural applications. Companies like Signify Holding have made strides in this area, collaborating with Infinite Acres B.V. to enhance vertical farming with advanced LED technology that prioritizes sustainability. Additionally, product innovation is accelerating, with companies such as OSLON offering a diverse range of light options suited for vertical farming and horticultural needs. As energy-efficient solutions become increasingly important, hardware continues to play a central role in the evolution of grow lights​ market.

Grow-Lights-Market-By-Component

Need Any Customization Research On Grow Lights Market - Inquiry Now

By Application

In 2023, the indoor farming application segment dominated the grow lights market, capturing around 35% of the total revenue share. This dominance is attributed to the increasing adoption of controlled environment agriculture (CEA) methods, where indoor farming plays a vital role in meeting the growing demand for fresh produce in urban settings. The segment benefits from technological advancements, including energy-efficient lighting solutions such as LED grow lights, which help optimize plant growth while minimizing energy costs. Moreover, urbanization and the shift toward sustainable farming practices have further bolstered the growth of indoor farming. Companies like Signify Holding and Philips Lighting have been actively expanding their product offerings, introducing specialized LED systems designed for indoor farming. These innovations are critical as they help farmers maintain optimal growing conditions year-round. Additionally, the rise of vertical farming and hydroponics in urban areas further supports the increasing demand for indoor grow lights

Grow Lights Market Regional Analysis

In 2023, North America led the grow lights market, capturing around 35% of the global revenue, largely driven by rising adoption in commercial and residential farming applications. The demand for energy-efficient grow lights is significant due to increased indoor farming and controlled environment agriculture (CEA) practices in urban areas. Key players, such as Signify Holding and OSRAM, have contributed to this growth with advanced LED technologies. For instance, Signify launched horticultural lighting solutions focused on optimizing energy efficiency and crop productivity for North American farmers. The United States and Canada are key countries in this market, leveraging vertical farming technologies to address urban food production challenges. In the U.S., government support and funding initiatives in sustainable agriculture have further encouraged the adoption of grow lights, while smart farming technologies, including IoT-enabled systems, are increasingly popular to enhance automation and efficiency. Companies have also responded to demand with specific product innovations. Fluence Bioengineering, for example, launched high-performance LED solutions designed to support large-scale commercial farming, further strengthening the market's dominance.

In 2023, the Asia Pacific region became the fastest-growing market for grow lights, driven by rapid urbanization, increasing food demand, and the widespread adoption of advanced farming methods such as vertical farming and controlled environment agriculture (CEA). Countries like China, India, and Japan are seeing heightened demand for energy-efficient and compact grow lights to cater to the needs of urban agriculture. Significant product developments have been made, with companies like OSRAM and Fluence Bioengineering introducing advanced LED lighting solutions designed for indoor and vertical farming. OSRAM launched a new range of horticultural LEDs in 2023, optimizing light distribution for diverse crops. Additionally, China remains a major producer of LED grow lights, while India is adopting these technologies to boost urban food production. The rise of IoT-enabled grow lights is also enhancing automation in farming practices, supporting the growing trend. With strong government backing and environmental concerns, Asia Pacific is set to maintain its leadership in the global grow lights market.
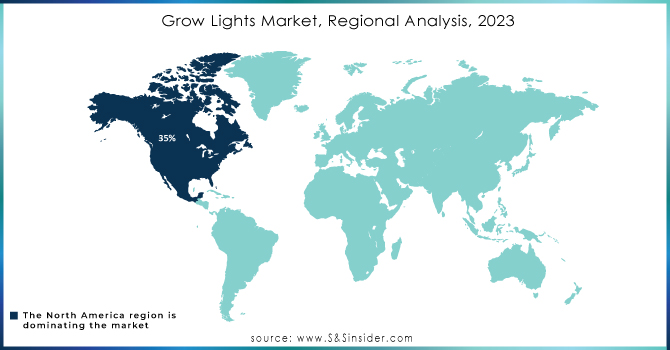
Grow-Lights-Market-Regional-Analysis-2023

Key Players in Grow Lights Market

Some of the major players in Grow Lights market with product:

  • Signify (Philips Lighting) – (Philips GreenPower LED)

  • Osram Licht AG – (OSRAM Oslon Square)

  • General Electric (GE) – (GE HyGrow LED)

  • Lumigrow Inc. – (Lumigrow Pro 650)

  • Cree Inc. – (Cree XLamp)

  • Everlight Electronics Co. Ltd. – (Everlight LED Grow Lights)

  • Hydrofarm Inc. – (Active Grow LED Fixtures)

  • Kessil (Daiwa) Inc. – (Kessil A360X)

  • Gaia LED – (Gaia LED Grow Lights)

  • Heliospectra AB – (Heliospectra LED Grow Lights)

  • Growbright – (Growbright LED Full Spectrum Lights)

  • HortiLED – (HortiLED Full Spectrum Lighting)

  • Illumitex Inc. – (Illumitex LED Grow Lights)

  • Samsung Electronics – (Samsung LM301H LED Grow Lights)

  • Advanced Nutrients – (Advanced Nutrients LED Grow Lights)

  • Valoya – (Valoya L Series)

  • Black Dog LED – (Black Dog PhytoMAX-2)

  • California LightWorks – (SolarSystem LED Grow Lights)

  • Greengo Technologies – (Greengo LED Grow Light)

  • Urban Gro – (Urban Gro LED Grow Lights)

List of potential customer companies for the grow lights market, across various industries that rely on grow lights for agricultural, commercial, and industrial applications:

Indoor Farming and Vertical Farming Companies

  • AeroFarms

  • Plenty

  • Farm.One

  • Gotham Greens

  • Infarm

Commercial Greenhouse Operators

  • SunOpta

  • Greenhouse Megastore

  • American Hydroponics

  • The Greenhouse People

Agricultural Research Institutes

  • International Food Policy Research Institute (IFPRI)

  • National Institute of Agricultural Botany (NIAB)

  • USDA Agricultural Research Service (ARS)

Agricultural Equipment Suppliers

  • John Deere

  • Trimble

  • Kubota Corporation

Hydroponic and Aquaponic Systems Providers

  • Hydrofarm

  • Hydroponics.net

  • Gotham Greens

Cannabis Producers

  • Aurora Cannabis

  • Canopy Growth

  • Tilray

  • Curaleaf

Retailers and E-commerce Platforms

  • Walmart

  • Amazon

  • Home Depot

  • Lowe’s

Agricultural Technology Companies

  • Ripe Robotics

  • Agri-Tech East

  • BrightFarms

Recent News

  • On October 23, 2024, Gooing Top’s best-selling grow light is highlighted as a solution for houseplant care during the shorter daylight hours of winter. On sale for USD26.99, it features adjustable settings, a timer, and energy-efficient LED lights that mimic full-spectrum sunlight, making it perfect for plant care and even doubling as a reading lamp.

Recent Development

  • In February 2024, Aero Garden unveiled the Harvest 2.0, an upgraded version of its popular Harvest unit. With a sleek design, detachable 15W full-spectrum LED grow light, and automatic timer, it promotes faster plant growth and offers gentle, efficient lighting in black and white, with more color options coming soon.

  • In October 2023, Québec-based Proplant Propagation adopted Sollum’s dynamic smart LED fixtures in its greenhouses. This strategic move leverages precision lighting with customized light recipes to improve product quality.

Grow Lights Market Report Scope

Report Attributes Details
Market Size in 2023 USD 3.24 Billion
Market Size by 2032 USD 17.18 Billion
CAGR CAGR of 20.36% From 2024 to 2032
Base Year 2023
Forecast Period 2024-2032
Historical Data 2020-2022
Report Scope & Coverage Market Size, Segments Analysis, Competitive  Landscape, Regional Analysis, DROC & SWOT Analysis, Forecast Outlook
Key Segments • By Component (Hardware, Software)
• By Technology (High Intensity Discharge (HID),LED, Fluorescent, Plasma)
• By Spectrum (Partial Spectrum, Full Spectrum)
• By Application (Indoor Farming, Vertical Farming, Commercial Greenhouse, Others)
Regional Analysis/Coverage North America (US, Canada, Mexico), Europe (Eastern Europe [Poland, Romania, Hungary, Turkey, Rest of Eastern Europe] Western Europe [Germany, France, UK, Italy, Spain, Netherlands, Switzerland, Austria, Rest of Western Europe]), Asia Pacific (China, India, Japan, South Korea, Vietnam, Singapore, Australia, Rest of Asia Pacific), Middle East & Africa (Middle East [UAE, Egypt, Saudi Arabia, Qatar, Rest of Middle East], Africa [Nigeria, South Africa, Rest of Africa], Latin America (Brazil, Argentina, Colombia, Rest of Latin America)
Company Profiles  Signify (Philips Lighting), Osram Licht AG, General Electric (GE), Lumigrow Inc., Cree Inc., Everlight Electronics Co. Ltd., Hydrofarm Inc., Kessil (Daiwa) Inc., Gaia LED, Heliospectra AB, Growbright, HortiLED, Illumitex Inc., Samsung Electronics, Advanced Nutrients, Valoya, Black Dog LED, California LightWorks, Greengo Technologies, and Urban Gro.
Key Drivers • Energy-efficient LED grow lights are revolutionizing urban farming by supporting sustainable agriculture and reducing environmental impact.
Restraints • Energy Consumption Challenges in LED Grow Lights for Sustainable Farming 

Frequently Asked Questions

Ans: The market for Grow Lights Market is anticipated to expand by 16.37 % from 2024 to 2032.

Ans: Increasing advancement in automotive systems and Enhanced safety and security in vehicles

Ans:  The Grow Lights Market size was valued at USD 16.83 Billion in 2032.

Ans: The Grow Lights Market size was valued at USD 4.30 Billion in 2023

Ans: North America is dominating the Grow Lights market in 2023

Table of Content

1. Introduction

1.1 Market Definition

1.2 Scope (Inclusion and Exclusions)

1.3 Research Assumptions

2. Executive Summary

2.1 Market Overview

2.2 Regional Synopsis

2.3 Competitive Summary

3. Research Methodology

3.1 Top-Down Approach

3.2 Bottom-up Approach

3.3. Data Validation

3.4 Primary Interviews

4. Market Dynamics Impact Analysis

4.1 Market Driving Factors Analysis

4.1.1 Drivers

4.1.2 Restraints

4.1.3 Opportunities

4.1.4 Challenges

4.2 PESTLE Analysis

4.3 Porter’s Five Forces Model

5. Statistical Insights and Trends Reporting

5.1 Grow Lights Production Volumes, by Region (2023)

5.2 Grow Light Technology Trends (Historic and Future)

5.3 Grow Light Capacity Utilization (2023)

5.4 Supply Chain Metrics

6. Competitive Landscape

6.1 List of Major Companies, By Region

6.2 Market Share Analysis, By Region

6.3 Product Benchmarking

6.3.1 Product specifications and features

6.3.2 Pricing

6.4 Strategic Initiatives

6.4.1 Marketing and promotional activities

6.4.2 Distribution and supply chain strategies

6.4.3 Expansion plans and new product launches

6.4.4 Strategic partnerships and collaborations

6.5 Technological Advancements

6.6 Market Positioning and Branding

7. Grow Lights Market Segmentation, by Component

7.1 Chapter Overview

7.2 Hardware

7.2.1 Hardware Market Trends Analysis (2020-2032)

7.2.2 Hardware Market Size Estimates and Forecasts to 2032 (USD Billion)

7.3 Software

7.3.1 Software Market Trends Analysis (2020-2032)

7.3.2 Software Market Size Estimates and Forecasts to 2032 (USD Billion)

8. Grow Lights Market Segmentation, by Technology

8.1 Chapter Overview

8.2 High Intensity Discharge (HID)

8.2.1 High Intensity Discharge (HID) Market Trends Analysis (2020-2032)

8.2.2 High Intensity Discharge (HID) Market Size Estimates and Forecasts to 2032 (USD Billion)

8.3 LED

8.3.1 LED Market Trends Analysis (2020-2032)

8.3.2 LED Market Size Estimates and Forecasts to 2032 (USD Billion)

8.4 Fluorescent

8.4.1 Fluorescent Market Trends Analysis (2020-2032)

8.4.2 Fluorescent Market Size Estimates and Forecasts to 2032 (USD Billion)

8.5 Plasma

8.5.1 Plasma Market Trends Analysis (2020-2032)

8.5.2 Plasma Market Size Estimates and Forecasts to 2032 (USD Billion)

9. Grow Lights Market Segmentation, by Spectrum

9.1 Chapter Overview

9.2 Partial Spectrum

9.2.1 Partial Spectrum Market Trends Analysis (2020-2032)

9.2.2 Partial Spectrum Market Size Estimates and Forecasts to 2032 (USD Billion)

9.3 Full Spectrum

9.3.1 Full Spectrum Market Trends Analysis (2020-2032)

9.3.2 Full Spectrum Market Size Estimates and Forecasts to 2032 (USD Billion)

10. Grow Lights Market Segmentation, by Application

10.1 Chapter Overview

10.2 Indoor Farming

10.2.1 Indoor Farming Market Trends Analysis (2020-2032)

10.2.2 Indoor Farming Market Size Estimates and Forecasts to 2032 (USD Billion)

10.3 Vertical Farming

10.3.1 Vertical Farming Market Trends Analysis (2020-2032)

10.3.2 Vertical Farming Market Size Estimates and Forecasts to 2032 (USD Billion)

10.4 Commercial Greenhouse

               10.4.1 Commercial Greenhouse Market Trends Analysis (2020-2032)

10.4.2 Commercial Greenhouse Market Size Estimates and Forecasts to 2032 (USD Billion)

10.5 Others

10.5.1 Others Market Trends Analysis (2020-2032)

10.5.2 Others Market Size Estimates and Forecasts to 2032 (USD Billion)

11. Regional Analysis

11.1 Chapter Overview

11.2 North America

11.2.1 Trends Analysis

11.2.2 North America Grow Lights Market Estimates and Forecasts, by Country (2020-2032) (USD Billion)

11.2.3 North America Grow Lights Market Estimates and Forecasts, by Component (2020-2032) (USD Billion)  

11.2.4 North America Grow Lights Market Estimates and Forecasts, by Technology (2020-2032) (USD Billion)

11.2.5 North America Grow Lights Market Estimates and Forecasts, by Spectrum (2020-2032) (USD Billion)

11.2.6 North America Grow Lights Market Estimates and Forecasts, by Application (2020-2032) (USD Billion)

11.2.7 USA

11.2.7.1 USA Grow Lights Market Estimates and Forecasts, by Component (2020-2032) (USD Billion)

11.2.7.2 USA Grow Lights Market Estimates and Forecasts, by Technology (2020-2032) (USD Billion)

11.2.7.3 USA Grow Lights Market Estimates and Forecasts, by Spectrum (2020-2032) (USD Billion)

11.2.7.4 USA Grow Lights Market Estimates and Forecasts, by Application (2020-2032) (USD Billion)

11.2.8 Canada

11.2.8.1 Canada Grow Lights Market Estimates and Forecasts, by Component (2020-2032) (USD Billion)

11.2.8.2 Canada Grow Lights Market Estimates and Forecasts, by Technology (2020-2032) (USD Billion)

11.2.8.3 Canada Grow Lights Market Estimates and Forecasts, by Spectrum (2020-2032) (USD Billion)

11.2.8.4 Canada Grow Lights Market Estimates and Forecasts, by Application (2020-2032) (USD Billion)

11.2.9 Mexico

11.2.9.1 Mexico Grow Lights Market Estimates and Forecasts, by Component (2020-2032) (USD Billion)

11.2.9.2 Mexico Grow Lights Market Estimates and Forecasts, by Technology (2020-2032) (USD Billion)

11.2.9.3 Mexico Grow Lights Market Estimates and Forecasts, by Spectrum (2020-2032) (USD Billion)

11.2.9.4 Mexico Grow Lights Market Estimates and Forecasts, by Application (2020-2032) (USD Billion)

11.3 Europe

11.3.1 Eastern Europe

11.3.1.1 Trends Analysis

11.3.1.2 Eastern Europe Grow Lights Market Estimates and Forecasts, by Country (2020-2032) (USD Billion)

11.3.1.3 Eastern Europe Grow Lights Market Estimates and Forecasts, by Component (2020-2032) (USD Billion)  

11.3.1.4 Eastern Europe Grow Lights Market Estimates and Forecasts, by Technology (2020-2032) (USD Billion)

11.3.1.5 Eastern Europe Grow Lights Market Estimates and Forecasts, by Spectrum (2020-2032) (USD Billion)

11.3.1.6 Eastern Europe Grow Lights Market Estimates and Forecasts, by Application (2020-2032) (USD Billion)

11.3.1.7 Poland

11.3.1.7.1 Poland Grow Lights Market Estimates and Forecasts, by Component (2020-2032) (USD Billion)

11.3.1.7.2 Poland Grow Lights Market Estimates and Forecasts, by Technology (2020-2032) (USD Billion)

11.3.1.7.3 Poland Grow Lights Market Estimates and Forecasts, by Spectrum (2020-2032) (USD Billion)

11.3.1.7.4 Poland Grow Lights Market Estimates and Forecasts, by Application (2020-2032) (USD Billion)

11.3.1.8 Romania

11.3.1.8.1 Romania Grow Lights Market Estimates and Forecasts, by Component (2020-2032) (USD Billion)

11.3.1.8.2 Romania Grow Lights Market Estimates and Forecasts, by Technology (2020-2032) (USD Billion)

11.3.1.8.3 Romania Grow Lights Market Estimates and Forecasts, by Spectrum (2020-2032) (USD Billion)

11.3.1.8.4 Romania Grow Lights Market Estimates and Forecasts, by Application (2020-2032) (USD Billion)

11.3.1.9 Hungary

11.3.1.9.1 Hungary Grow Lights Market Estimates and Forecasts, by Component (2020-2032) (USD Billion)

11.3.1.9.2 Hungary Grow Lights Market Estimates and Forecasts, by Technology (2020-2032) (USD Billion)

11.3.1.9.3 Hungary Grow Lights Market Estimates and Forecasts, by Spectrum (2020-2032) (USD Billion)

11.3.1.9.4 Hungary Grow Lights Market Estimates and Forecasts, by Application (2020-2032) (USD Billion)

11.3.1.10 Turkey

11.3.1.10.1 Turkey Grow Lights Market Estimates and Forecasts, by Component (2020-2032) (USD Billion)

11.3.1.10.2 Turkey Grow Lights Market Estimates and Forecasts, by Technology (2020-2032) (USD Billion)

11.3.1.10.3 Turkey Grow Lights Market Estimates and Forecasts, by Spectrum (2020-2032) (USD Billion)

11.3.1.10.4 Turkey Grow Lights Market Estimates and Forecasts, by Application (2020-2032) (USD Billion)

11.3.1.11 Rest of Eastern Europe

11.3.1.11.1 Rest of Eastern Europe Grow Lights Market Estimates and Forecasts, by Component (2020-2032) (USD Billion)

11.3.1.11.2 Rest of Eastern Europe Grow Lights Market Estimates and Forecasts, by Technology (2020-2032) (USD Billion)

11.3.1.11.3 Rest of Eastern Europe Grow Lights Market Estimates and Forecasts, by Spectrum (2020-2032) (USD Billion)

11.3.1.11.4 Rest of Eastern Europe Grow Lights Market Estimates and Forecasts, by Application (2020-2032) (USD Billion)

11.3.2 Western Europe

11.3.2.1 Trends Analysis

11.3.2.2 Western Europe Grow Lights Market Estimates and Forecasts, by Country (2020-2032) (USD Billion)

11.3.2.3 Western Europe Grow Lights Market Estimates and Forecasts, by Component (2020-2032) (USD Billion)  

11.3.2.4 Western Europe Grow Lights Market Estimates and Forecasts, by Technology (2020-2032) (USD Billion)

11.3.2.5 Western Europe Grow Lights Market Estimates and Forecasts, by Spectrum (2020-2032) (USD Billion)

11.3.2.6 Western Europe Grow Lights Market Estimates and Forecasts, by Application (2020-2032) (USD Billion)

11.3.2.7 Germany

11.3.2.7.1 Germany Grow Lights Market Estimates and Forecasts, by Component (2020-2032) (USD Billion)

11.3.2.7.2 Germany Grow Lights Market Estimates and Forecasts, by Technology (2020-2032) (USD Billion)

11.3.2.7.3 Germany Grow Lights Market Estimates and Forecasts, by Spectrum (2020-2032) (USD Billion)

11.3.2.7.4 Germany Grow Lights Market Estimates and Forecasts, by Application (2020-2032) (USD Billion)

11.3.2.8 France

11.3.2.8.1 France Grow Lights Market Estimates and Forecasts, by Component (2020-2032) (USD Billion)

11.3.2.8.2 France Grow Lights Market Estimates and Forecasts, by Technology (2020-2032) (USD Billion)

11.3.2.8.3 France Grow Lights Market Estimates and Forecasts, by Spectrum (2020-2032) (USD Billion)

11.3.2.8.4 France Grow Lights Market Estimates and Forecasts, by Application (2020-2032) (USD Billion)

11.3.2.9 UK

11.3.2.9.1 UK Grow Lights Market Estimates and Forecasts, by Component (2020-2032) (USD Billion)

11.3.2.9.2 UK Grow Lights Market Estimates and Forecasts, by Technology (2020-2032) (USD Billion)

11.3.2.9.3 UK Grow Lights Market Estimates and Forecasts, by Spectrum (2020-2032) (USD Billion)

11.3.2.9.4 UK Grow Lights Market Estimates and Forecasts, by Application (2020-2032) (USD Billion)

11.3.2.10 Italy

11.3.2.10.1 Italy Grow Lights Market Estimates and Forecasts, by Component (2020-2032) (USD Billion)

11.3.2.10.2 Italy Grow Lights Market Estimates and Forecasts, by Technology (2020-2032) (USD Billion)

11.3.2.10.3 Italy Grow Lights Market Estimates and Forecasts, by Spectrum (2020-2032) (USD Billion)

11.3.2.10.4 Italy Grow Lights Market Estimates and Forecasts, by Application (2020-2032) (USD Billion)

11.3.2.11 Spain

11.3.2.11.1 Spain Grow Lights Market Estimates and Forecasts, by Component (2020-2032) (USD Billion)

11.3.2.11.2 Spain Grow Lights Market Estimates and Forecasts, by Technology (2020-2032) (USD Billion)

11.3.2.11.3 Spain Grow Lights Market Estimates and Forecasts, by Spectrum (2020-2032) (USD Billion)

11.3.2.11.4 Spain Grow Lights Market Estimates and Forecasts, by Application (2020-2032) (USD Billion)

11.3.2.12 Netherlands

11.3.2.12.1 Netherlands Grow Lights Market Estimates and Forecasts, by Component (2020-2032) (USD Billion)

11.3.2.12.2 Netherlands Grow Lights Market Estimates and Forecasts, by Technology (2020-2032) (USD Billion)

11.3.2.12.3 Netherlands Grow Lights Market Estimates and Forecasts, by Spectrum (2020-2032) (USD Billion)

11.3.2.12.4 Netherlands Grow Lights Market Estimates and Forecasts, by Application (2020-2032) (USD Billion)

11.3.2.13 Switzerland

11.3.2.13.1 Switzerland Grow Lights Market Estimates and Forecasts, by Component (2020-2032) (USD Billion)

11.3.2.13.2 Switzerland Grow Lights Market Estimates and Forecasts, by Technology (2020-2032) (USD Billion)

11.3.2.13.3 Switzerland Grow Lights Market Estimates and Forecasts, by Spectrum (2020-2032) (USD Billion)

11.3.2.13.4 Switzerland Grow Lights Market Estimates and Forecasts, by Application (2020-2032) (USD Billion)

11.3.2.14 Austria

11.3.2.14.1 Austria Grow Lights Market Estimates and Forecasts, by Component (2020-2032) (USD Billion)

11.3.2.14.2 Austria Grow Lights Market Estimates and Forecasts, by Technology (2020-2032) (USD Billion)

11.3.2.14.3 Austria Grow Lights Market Estimates and Forecasts, by Spectrum (2020-2032) (USD Billion)

11.3.2.14.4 Austria Grow Lights Market Estimates and Forecasts, by Application (2020-2032) (USD Billion)

11.3.2.15 Rest of Western Europe

11.3.2.15.1 Rest of Western Europe Grow Lights Market Estimates and Forecasts, by Component (2020-2032) (USD Billion)

11.3.2.15.2 Rest of Western Europe Grow Lights Market Estimates and Forecasts, by Technology (2020-2032) (USD Billion)

11.3.2.15.3 Rest of Western Europe Grow Lights Market Estimates and Forecasts, by Spectrum (2020-2032) (USD Billion)

11.3.2.15.4 Rest of Western Europe Grow Lights Market Estimates and Forecasts, by Application (2020-2032) (USD Billion)

11.4 Asia-Pacific

11.4.1 Trends Analysis

11.4.2 Asia-Pacific Grow Lights Market Estimates and Forecasts, by Country (2020-2032) (USD Billion)

11.4.3 Asia-Pacific Grow Lights Market Estimates and Forecasts, by Component (2020-2032) (USD Billion)  

11.4.4 Asia-Pacific Grow Lights Market Estimates and Forecasts, by Technology (2020-2032) (USD Billion)

11.4.5 Asia-Pacific Grow Lights Market Estimates and Forecasts, by Spectrum (2020-2032) (USD Billion)

11.4.6 Asia-Pacific Grow Lights Market Estimates and Forecasts, by Application (2020-2032) (USD Billion)

11.4.7 China

11.4.7.1 China Grow Lights Market Estimates and Forecasts, by Component (2020-2032) (USD Billion)

11.4.7.2 China Grow Lights Market Estimates and Forecasts, by Technology (2020-2032) (USD Billion)

11.4.7.3 China Grow Lights Market Estimates and Forecasts, by Spectrum (2020-2032) (USD Billion)

11.4.7.4 China Grow Lights Market Estimates and Forecasts, by Application (2020-2032) (USD Billion)

11.4.8 India

11.4.8.1 India Grow Lights Market Estimates and Forecasts, by Component (2020-2032) (USD Billion)

11.4.8.2 India Grow Lights Market Estimates and Forecasts, by Technology (2020-2032) (USD Billion)

11.4.8.3 India Grow Lights Market Estimates and Forecasts, by Spectrum (2020-2032) (USD Billion)

11.4.8.4 India Grow Lights Market Estimates and Forecasts, by Application (2020-2032) (USD Billion)

11.4.9 Japan

11.4.9.1 Japan Grow Lights Market Estimates and Forecasts, by Component (2020-2032) (USD Billion)

11.4.9.2 Japan Grow Lights Market Estimates and Forecasts, by Technology (2020-2032) (USD Billion)

11.4.9.3 Japan Grow Lights Market Estimates and Forecasts, by Spectrum (2020-2032) (USD Billion)

11.4.9.4 Japan Grow Lights Market Estimates and Forecasts, by Application (2020-2032) (USD Billion)

11.4.10 South Korea

11.4.10.1 South Korea Grow Lights Market Estimates and Forecasts, by Component (2020-2032) (USD Billion)

11.4.10.2 South Korea Grow Lights Market Estimates and Forecasts, by Technology (2020-2032) (USD Billion)

11.4.10.3 South Korea Grow Lights Market Estimates and Forecasts, by Spectrum (2020-2032) (USD Billion)

11.4.10.4 South Korea Grow Lights Market Estimates and Forecasts, by Application (2020-2032) (USD Billion)

11.4.11 Vietnam

11.4.11.1 Vietnam Grow Lights Market Estimates and Forecasts, by Component (2020-2032) (USD Billion)

11.4.11.2 Vietnam Grow Lights Market Estimates and Forecasts, by Technology (2020-2032) (USD Billion)

11.4.11.3 Vietnam Grow Lights Market Estimates and Forecasts, by Spectrum (2020-2032) (USD Billion)

11.4.11.4 Vietnam Grow Lights Market Estimates and Forecasts, by Application (2020-2032) (USD Billion)

11.4.12 Singapore

11.4.12.1 Singapore Grow Lights Market Estimates and Forecasts, by Component (2020-2032) (USD Billion)

11.4.12.2 Singapore Grow Lights Market Estimates and Forecasts, by Technology (2020-2032) (USD Billion)

11.4.12.3 Singapore Grow Lights Market Estimates and Forecasts, by Spectrum (2020-2032) (USD Billion)

11.4.12.4 Singapore Grow Lights Market Estimates and Forecasts, by Application (2020-2032) (USD Billion)

11.4.13 Australia

11.4.13.1 Australia Grow Lights Market Estimates and Forecasts, by Component (2020-2032) (USD Billion)

11.4.13.2 Australia Grow Lights Market Estimates and Forecasts, by Technology (2020-2032) (USD Billion)

11.4.13.3 Australia Grow Lights Market Estimates and Forecasts, by Spectrum (2020-2032) (USD Billion)

11.4.13.4 Australia Grow Lights Market Estimates and Forecasts, by Application (2020-2032) (USD Billion)

11.4.14 Rest of Asia-Pacific

11.4.14.1 Rest of Asia-Pacific Grow Lights Market Estimates and Forecasts, by Component (2020-2032) (USD Billion)

11.4.14.2 Rest of Asia-Pacific Grow Lights Market Estimates and Forecasts, by Technology (2020-2032) (USD Billion)

11.4.14.3 Rest of Asia-Pacific Grow Lights Market Estimates and Forecasts, by Spectrum (2020-2032) (USD Billion)

11.4.14.4 Rest of Asia-Pacific Grow Lights Market Estimates and Forecasts, by Application (2020-2032) (USD Billion)

11.5 Middle East and Africa

11.5.1 Middle East

11.5.1.1 Trends Analysis

11.5.1.2 Middle East Grow Lights Market Estimates and Forecasts, by Country (2020-2032) (USD Billion)

11.5.1.3 Middle East Grow Lights Market Estimates and Forecasts, by Component (2020-2032) (USD Billion)  

11.5.1.4 Middle East Grow Lights Market Estimates and Forecasts, by Technology (2020-2032) (USD Billion)

11.5.1.5 Middle East Grow Lights Market Estimates and Forecasts, by Spectrum (2020-2032) (USD Billion)

11.5.1.6 Middle East Grow Lights Market Estimates and Forecasts, by Application (2020-2032) (USD Billion)

11.5.1.7 UAE

11.5.1.7.1 UAE Grow Lights Market Estimates and Forecasts, by Component (2020-2032) (USD Billion)

11.5.1.7.2 UAE Grow Lights Market Estimates and Forecasts, by Technology (2020-2032) (USD Billion)

11.5.1.7.3 UAE Grow Lights Market Estimates and Forecasts, by Spectrum (2020-2032) (USD Billion)

11.5.1.7.4 UAE Grow Lights Market Estimates and Forecasts, by Application  (2020-2032) (USD Billion)

11.5.1.8 Egypt

11.5.1.8.1 Egypt Grow Lights Market Estimates and Forecasts, by Component (2020-2032) (USD Billion)

11.5.1.8.2 Egypt Grow Lights Market Estimates and Forecasts, by Technology (2020-2032) (USD Billion)

11.5.1.8.3 Egypt Grow Lights Market Estimates and Forecasts, by Spectrum (2020-2032) (USD Billion)

11.5.1.8.4 Egypt Grow Lights Market Estimates and Forecasts, by Application (2020-2032) (USD Billion)

11.5.1.9 Saudi Arabia

11.5.1.9.1 Saudi Arabia Grow Lights Market Estimates and Forecasts, by Component (2020-2032) (USD Billion)

11.5.1.9.2 Saudi Arabia Grow Lights Market Estimates and Forecasts, by Technology (2020-2032) (USD Billion)

11.5.1.9.3 Saudi Arabia Grow Lights Market Estimates and Forecasts, by Spectrum (2020-2032) (USD Billion)

11.5.1.9.4 Saudi Arabia Grow Lights Market Estimates and Forecasts, by Application (2020-2032) (USD Billion)

11.5.1.10 Qatar

11.5.1.10.1 Qatar Grow Lights Market Estimates and Forecasts, by Component (2020-2032) (USD Billion)

11.5.1.10.2 Qatar Grow Lights Market Estimates and Forecasts, by Technology (2020-2032) (USD Billion)

11.5.1.10.3 Qatar Grow Lights Market Estimates and Forecasts, by Spectrum (2020-2032) (USD Billion)

11.5.1.10.4 Qatar Grow Lights Market Estimates and Forecasts, by Application (2020-2032) (USD Billion)

11.5.1.11 Rest of Middle East

11.5.1.11.1 Rest of Middle East Grow Lights Market Estimates and Forecasts, by Component (2020-2032) (USD Billion)

11.5.1.11.2 Rest of Middle East Grow Lights Market Estimates and Forecasts, by Technology (2020-2032) (USD Billion)

11.5.1.11.3 Rest of Middle East Grow Lights Market Estimates and Forecasts, by Spectrum (2020-2032) (USD Billion)

11.5.1.11.4 Rest of Middle East Grow Lights Market Estimates and Forecasts, by Application (2020-2032) (USD Billion)

11.5.2 Africa

11.5.2.1 Trends Analysis

11.5.2.2 Africa Grow Lights Market Estimates and Forecasts, by Country (2020-2032) (USD Billion)

11.5.2.3 Africa Grow Lights Market Estimates and Forecasts, by Component (2020-2032) (USD Billion)  

11.5.2.4 Africa Grow Lights Market Estimates and Forecasts, by Technology (2020-2032) (USD Billion)

11.5.2.5 Africa Grow Lights Market Estimates and Forecasts, by Spectrum (2020-2032) (USD Billion)

11.5.2.6 Africa Grow Lights Market Estimates and Forecasts, by Application (2020-2032) (USD Billion)

11.5.2.7 South Africa

11.5.2.7.1 South Africa Grow Lights Market Estimates and Forecasts, by Component (2020-2032) (USD Billion)

11.5.2.7.2 South Africa Grow Lights Market Estimates and Forecasts, by Technology (2020-2032) (USD Billion)

11.5.2.7.3 South Africa Grow Lights Market Estimates and Forecasts, by Spectrum (2020-2032) (USD Billion)

11.5.2.7.4 South Africa Grow Lights Market Estimates and Forecasts, by Application (2020-2032) (USD Billion)

11.5.2.8 Nigeria

11.5.2.8.1 Nigeria Grow Lights Market Estimates and Forecasts, by Component (2020-2032) (USD Billion)

11.5.2.8.2 Nigeria Grow Lights Market Estimates and Forecasts, by Technology (2020-2032) (USD Billion)

11.5.2.8.3 Nigeria Grow Lights Market Estimates and Forecasts, by Spectrum (2020-2032) (USD Billion)

11.5.2.8.4 Nigeria Grow Lights Market Estimates and Forecasts, by Application (2020-2032) (USD Billion)

11.5.2.9 Rest of Africa

11.5.2.9.1 Rest of Africa Grow Lights Market Estimates and Forecasts, by Component (2020-2032) (USD Billion)

11.5.2.9.2 Rest of Africa Grow Lights Market Estimates and Forecasts, by Technology (2020-2032) (USD Billion)

11.5.2.9.3 Rest of Africa Grow Lights Market Estimates and Forecasts, by Spectrum (2020-2032) (USD Billion)

11.5.2.9.4 Rest of Africa Grow Lights Market Estimates and Forecasts, by Application (2020-2032) (USD Billion)

11.6 Latin America

11.6.1 Trends Analysis

11.6.2 Latin America Grow Lights Market Estimates and Forecasts, by Country (2020-2032) (USD Billion)

11.6.3 Latin America Grow Lights Market Estimates and Forecasts, by Component (2020-2032) (USD Billion)  

11.6.4 Latin America Grow Lights Market Estimates and Forecasts, by Technology (2020-2032) (USD Billion)

11.6.5 Latin America Grow Lights Market Estimates and Forecasts, by Spectrum (2020-2032) (USD Billion)

11.6.6 Latin America Grow Lights Market Estimates and Forecasts, by Application (2020-2032) (USD Billion)

11.6.7 Brazil

11.6.7.1 Brazil Grow Lights Market Estimates and Forecasts, by Component (2020-2032) (USD Billion)

11.6.7.2 Brazil Grow Lights Market Estimates and Forecasts, by Technology (2020-2032) (USD Billion)

11.6.7.3 Brazil Grow Lights Market Estimates and Forecasts, by Spectrum (2020-2032) (USD Billion)

11.6.7.4 Brazil Grow Lights Market Estimates and Forecasts, by Application (2020-2032) (USD Billion)

11.6.8 Argentina

11.6.8.1 Argentina Grow Lights Market Estimates and Forecasts, by Component (2020-2032) (USD Billion)

11.6.8.2 Argentina Grow Lights Market Estimates and Forecasts, by Technology (2020-2032) (USD Billion)

11.6.8.3 Argentina Grow Lights Market Estimates and Forecasts, by Spectrum (2020-2032) (USD Billion)

11.6.8.4 Argentina Grow Lights Market Estimates and Forecasts, by Application (2020-2032) (USD Billion)

11.6.9 Colombia

11.6.9.1 Colombia Grow Lights Market Estimates and Forecasts, by Component (2020-2032) (USD Billion)

11.6.9.2 Colombia Grow Lights Market Estimates and Forecasts, by Technology (2020-2032) (USD Billion)

11.6.9.3 Colombia Grow Lights Market Estimates and Forecasts, by Spectrum (2020-2032) (USD Billion)

11.6.9.4 Colombia Grow Lights Market Estimates and Forecasts, by Application (2020-2032) (USD Billion)

11.6.10 Rest of Latin America

11.6.10.1 Rest of Latin America Grow Lights Market Estimates and Forecasts, by Component (2020-2032) (USD Billion)

11.6.10.2 Rest of Latin America Grow Lights Market Estimates and Forecasts, by Technology (2020-2032) (USD Billion)

11.6.10.3 Rest of Latin America Grow Lights Market Estimates and Forecasts, by Spectrum (2020-2032) (USD Billion)

11.6.10.4 Rest of Latin America Grow Lights Market Estimates and Forecasts, by Application (2020-2032) (USD Billion)

12. Company Profiles

12.1 Signify (Philips Lighting)

12.1.1 Company Overview

12.1.2 Financial

12.1.3 Products/ Services Offered

12.1.4 SWOT Analysis

12.2 Osram Licht AG

12.2.1 Company Overview

12.2.2 Financial

12.2.3 Products/ Services Offered

12.2.4 SWOT Analysis

12.3 General Electric (GE)

12.3.1 Company Overview

12.3.2 Financial

12.3.3 Products/ Services Offered

12.3.4 SWOT Analysis

12.4 Lumigrow Inc.

12.4.1 Company Overview

12.4.2 Financial

12.4.3 Products/ Services Offered

12.4.4 SWOT Analysis

12.5 Cree Inc.

12.5.1 Company Overview

12.5.2 Financial

12.5.3 Products/ Services Offered

12.5.4 SWOT Analysis

12.6 Everlight Electronics Co. Ltd.

12.6.1 Company Overview

12.6.2 Financial

12.6.3 Products/ Services Offered

12.6.4 SWOT Analysis

12.7 Hydrofarm Inc.

12.7.1 Company Overview

12.7.2 Financial

12.7.3 Products/ Services Offered

12.7.4 SWOT Analysis

12.8 Kessil (Daiwa) Inc.

12.8.1 Company Overview

12.8.2 Financial

12.8.3 Products/ Services Offered

12.8.4 SWOT Analysis

12.9 Gaia LED

12.9.1 Company Overview

12.9.2 Financial

12.9.3 Products/ Services Offered

12.9.4 SWOT Analysis

12.10 Heliospectra AB

12.10.1 Company Overview

12.10.2 Financial

12.10.3 Products/ Services Offered

12.10.4 SWOT Analysis

13. Use Cases and Best Practices

14. Conclusion

An accurate research report requires proper strategizing as well as implementation. There are multiple factors involved in the completion of good and accurate research report and selecting the best methodology to compete the research is the toughest part. Since the research reports we provide play a crucial role in any company’s decision-making process, therefore we at SNS Insider always believe that we should choose the best method which gives us results closer to reality. This allows us to reach at a stage wherein we can provide our clients best and accurate investment to output ratio.

Each report that we prepare takes a timeframe of 350-400 business hours for production. Starting from the selection of titles through a couple of in-depth brain storming session to the final QC process before uploading our titles on our website we dedicate around 350 working hours. The titles are selected based on their current market cap and the foreseen CAGR and growth.


The 5 steps process:

Step 1: Secondary Research:

Secondary Research or Desk Research is as the name suggests is a research process wherein, we collect data through the readily available information. In this process we use various paid and unpaid databases which our team has access to and gather data through the same. This includes examining of listed companies’ annual reports, Journals, SEC filling etc. Apart from this our team has access to various associations across the globe across different industries. Lastly, we have exchange relationships with various university as well as individual libraries.

Secondary Research

Step 2: Primary Research

When we talk about primary research, it is a type of study in which the researchers collect relevant data samples directly, rather than relying on previously collected data.  This type of research is focused on gaining content specific facts that can be sued to solve specific problems. Since the collected data is fresh and first hand therefore it makes the study more accurate and genuine.

We at SNS Insider have divided Primary Research into 2 parts.

Part 1 wherein we interview the KOLs of major players as well as the upcoming ones across various geographic regions. This allows us to have their view over the market scenario and acts as an important tool to come closer to the accurate market numbers. As many as 45 paid and unpaid primary interviews are taken from both the demand and supply side of the industry to make sure we land at an accurate judgement and analysis of the market.

This step involves the triangulation of data wherein our team analyses the interview transcripts, online survey responses and observation of on filed participants. The below mentioned chart should give a better understanding of the part 1 of the primary interview.

Primary Research

Part 2: In this part of primary research the data collected via secondary research and the part 1 of the primary research is validated with the interviews from individual consultants and subject matter experts.

Consultants are those set of people who have at least 12 years of experience and expertise within the industry whereas Subject Matter Experts are those with at least 15 years of experience behind their back within the same space. The data with the help of two main processes i.e., FGDs (Focused Group Discussions) and IDs (Individual Discussions). This gives us a 3rd party nonbiased primary view of the market scenario making it a more dependable one while collation of the data pointers.

Step 3: Data Bank Validation

Once all the information is collected via primary and secondary sources, we run that information for data validation. At our intelligence centre our research heads track a lot of information related to the market which includes the quarterly reports, the daily stock prices, and other relevant information. Our data bank server gets updated every fortnight and that is how the information which we collected using our primary and secondary information is revalidated in real time.

Data Bank Validation

Step 4: QA/QC Process

After all the data collection and validation our team does a final level of quality check and quality assurance to get rid of any unwanted or undesired mistakes. This might include but not limited to getting rid of the any typos, duplication of numbers or missing of any important information. The people involved in this process include technical content writers, research heads and graphics people. Once this process is completed the title gets uploader on our platform for our clients to read it.

Step 5: Final QC/QA Process:

This is the last process and comes when the client has ordered the study. In this process a final QA/QC is done before the study is emailed to the client. Since we believe in giving our clients a good experience of our research studies, therefore, to make sure that we do not lack at our end in any way humanly possible we do a final round of quality check and then dispatch the study to the client.

Key Segments:

By Component

  • Hardware

  • Software

By Technology

  • High Intensity Discharge (HID)

  • LED

  • Fluorescent

  • Plasma

By Spectrum

  • Partial Spectrum

  • Full Spectrum

By Application

  • Indoor Farming

  • Vertical Farming

  • Commercial Greenhouse

  • Others

Request for Segment Customization as per your Business Requirement: Segment Customization Request

REGIONAL COVERAGE:

North America

  • US

  • Canada

  • Mexico

Europe

  • Eastern Europe

    • Poland

    • Romania

    • Hungary

    • Turkey

    • Rest of Eastern Europe

  • Western Europe

    • Germany

    • France

    • UK

    • Italy

    • Spain

    • Netherlands

    • Switzerland

    • Austria

    • Rest of Western Europe

Asia-Pacific

  • China

  • India

  • Japan

  • South Korea

  • Vietnam

  • Singapore

  • Australia

  • Rest of Asia Pacific

Middle East & Africa

  • Middle East

    • UAE

    • Egypt

    • Saudi Arabia

    • Qatar

    • Rest of the Middle East

  • Africa

    • Nigeria

    • South Africa

    • Rest of Africa

Latin America

  • Brazil

  • Argentina

  • Colombia

  • Rest of Latin America

Request for Country Level Research Report: Country Level Customization Request

Available Customization

With the given market data, SNS Insider offers customization as per the company’s specific needs. The following customization options are available for the report:

  • Product Analysis

  • Criss-Cross segment analysis (e.g. Product X Application)

  • Product Matrix which gives a detailed comparison of the product portfolio of each company

  • Geographic Analysis

  • Additional countries in any of the regions

  • Company Information

  • Detailed analysis and profiling of additional market players (Up to five)


  •            5000 (33% Discount)


  •            8950 (40% Discount)


  •            3050 (23% Discount)

Start a Conversation

Hi! Click one of our member below to chat on Phone