Get more information on gRNA Market - Request Free Sample Report
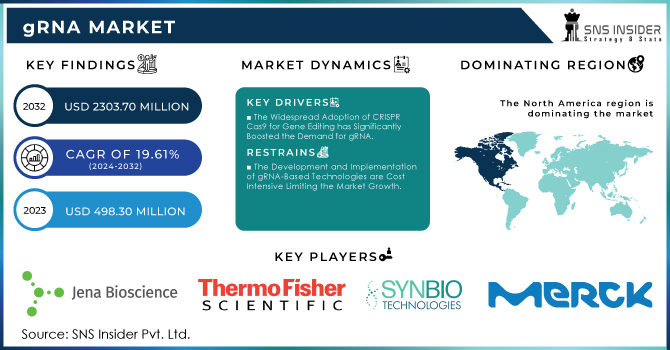
The gRNA Market Size was valued at USD 498.30 Million in 2023, and is expected to reach USD 2,303.70 Million by 2032, and grow at a CAGR of 19.61% Over the Forecast Period of 2024-2032.
A rise in genomic investment and increasing adoption of gene-editing technologies are the key factors promoting the development of the gRNA market. According to the most recent statistics provided by the NIH, federal investment in genomic research has increased significantly. In 2023, the NIH is planning to invest USD 2.3 billion in genomic studies which makes up a 15% increase from the data of the previous year. The growing number of research activities and development of new gene editing tools, including gRNA vital for the CRISPR-related processes, stimulates further market promotion.
Additionally, the increased risk of genetic diseases and the need for personalized medication and other interventions also increase the interest in the field. As for the overall number of research, the number of active research projects increased by as much as 20% over the last year, which means about 250 new projects adopted the technology over this time. Finally, technological development is also accelerating the growth of the market by increasing the number of CRISPR applications with a particular focus on therapeutics.
Key Drivers:
The Widespread Adoption of CRISPR-Cas9 for Gene Editing has Significantly Boosted the Demand for gRNA
Governments and Private Entities are Heavily Investing in Genomic Research and Biotechnology, Driving the Growth of the gRNA Market
Restraints:
Ethical Concerns and Stringent Regulatory Frameworks Surrounding Gene Editing Technologies Pose Significant Challenges to The Expansion of the gRNA Market
The Development and Implementation of gRNA-Based Technologies are Cost-Intensive Limiting the Market Growth
Opportunity:
The Application of gRNA in Agricultural Biotechnology for Crop Improvement and Pest Resistance Presents Substantial Growth Opportunities.
The growing Focus on Biotechnology and Life Sciences Research in Emerging Markets Like Asia-Pacific and Latin America Provides New Avenues For gRNA Market Expansion
By Type
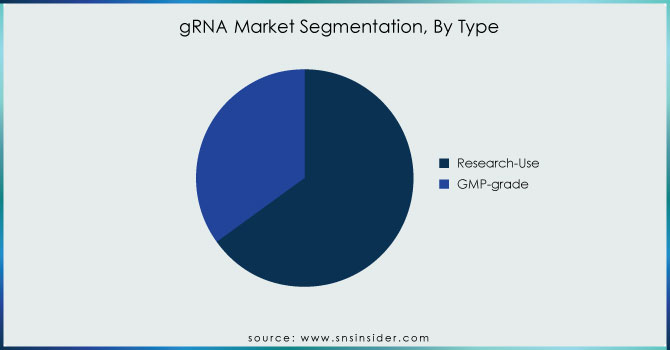
In 2023, the research-use segment dominated the market share, accounting for 65%. A large number of research programs are being conducted across various research institutes, and as a result, a highly filed the use of research-grade gRNA. Moreover, there is an increasing application of gRNA in the clinical research sector, which is further driving the demand for the same. Thus, the segment is expected to continue its dominance over the forecast period. The highest CAGR is estimated for the GMP-grade segment. The segment is required for the production of smooth and quality gRNA under quality control and regulatory guidelines for performing clinical trials and usage of samples in the patients. GMP focuses on enforcing procedures that assure high levels of quality assurance. The emphasis is put on appropriate design, monitoring, and control of manufacturing processes and facilities. The availability of such products and the importance of such products in the medical sector is expected to drive the market. The gene editing market is expected to be driven by the availability of GMP-grade gRNA, making it popular for use in personalized medicine. In addition to this, due to the use of GMP in the process of production, there is no chance of contamination or adulteration, leading to increased shelf life of the product. Subsequently, making it more affordable for the end-user.
Get Customized Report as per your Business Requirement - Request For Customized Report
By Application
The genome engineering segment dominated the global market share in 2023 with 45% and has been anticipated to grow at the fastest CAGR during the forecast period Genome engineering is highly lucrative for the application of gRNA, as the field of genome engineering is creating massive changes in disparate multitude of industry. The precision and the versatile nature of gRNA within the CRISPR-based editing methods have revolutionized the prospects of genetic modifications. The highest positive impact is seen in the fields of medicine, agriculture, and biotechnology. Synthetic biology depends on genome engineering with gRNA for the design and construction of new synthetic biological parts, organisms, devices, and systems for useful purposes. Industrial biotechnology will use this information to engineer microbial strains for the optimization of the production of biofuels, and drugs, and further increase the demand for genome engineering and hence, drive the market growth.
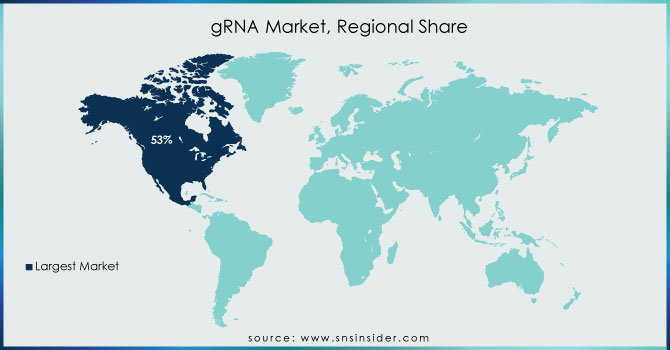
North America, with a revenue of 53% contributed to the largest share of the overall global market in 2023. The increasing gRNA industry growth is due to the presence of a substantial number of key players in the local markets, for instance, Thermo Fisher Scientific, Inc.; and Merck KGaA.; among others. Besides, the gRNA market is growing due to a spike in the research and development spending of the key market players to develop their products to be innovative and advanced. For instance, in May 2023, Thermo Fisher Scientific, Inc. and Pfizer, Inc. entered a collaboration to expand access to NGS-based testing for cancer patients. Both companies will focus on lung and breast cancer, two of the most common and deadly cancers worldwide. Following the partnership, there is expected to be an increasing demand for gRNAs that target the genes related to cancer. During the forecast timeframe, the CAGR of the Asia Pacific region is predicted to be the highest. The probability of growth is due to the presence of a substantial population who can be the target patients. In addition, this is guaranteed by the fact that in Asia Pacific, the adoption of a broad range of technologies is quicker, and there are a great number of startups as well. Growing healthcare infrastructure and the local high-unmet clinical needs will be of help to key manufacturers.
The key market players are Jena Bioscience GmbH, Thermo Fisher Scientific Inc., Synbio Technologies, Merck KGaA, Takara Bio Inc., Horizon Discovery Ltd., Agilent Technologies Inc., System Biosciences, LLC., Synthego, GENEWIZ (Azenta Life Sciences) & other players.
In May 2023, Revvity Inc. acquired Horizon Discovery Ltd., a life sciences and diagnostic business of PerkinElmer, Inc.
In May 2023, a rebranding of the PerkinElmer life sciences and diagnostics arm was announced, calling it Revvity.
In July 2022, Synthego opened the 20,000-square-foot manufacturing facility aimed at delivering GMP single guide RNA at scale. In October 2021, Merck KGaA agreed to license its CRISPR-Cas9 technology to Cellecta, Inc., a functional genomics products and services provider based in the U.S.
Report Attributes | Details |
---|---|
Market Size in 2023 |
US$ 498.30 Million |
Market Size by 2032 |
US$ 2,303.70 Million |
CAGR |
CAGR of 19.61% From 2024 to 2032 |
Base Year |
2023 |
Forecast Period |
2024-2032 |
Historical Data |
2020-2022 |
Report Scope & Coverage |
Market Size, Segments Analysis, Competitive Landscape, Regional Analysis, DROC & SWOT Analysis, Forecast Outlook |
Key Segments |
• By Type (Research-Use & GMP-grade) |
Regional Analysis/Coverage |
North America (US, Canada, Mexico), Europe (Eastern Europe [Poland, Romania, Hungary, Turkey, Rest of Eastern Europe] Western Europe] Germany, France, UK, Italy, Spain, Netherlands, Switzerland, Austria, Rest of Western Europe]), Asia Pacific (China, India, Japan, South Korea, Vietnam, Singapore, Australia, Rest of Asia Pacific), Middle East & Africa (Middle East [UAE, Egypt, Saudi Arabia, Qatar, Rest of Middle East], Africa [Nigeria, South Africa, Rest of Africa], Latin America (Brazil, Argentina, Colombia, Rest of Latin America) |
Company Profiles |
Jena Bioscience GmbH, Thermo Fisher Scientific Inc., Synbio Technologies, Merck KGaA, Takara Bio Inc., Horizon Discovery Ltd., Agilent Technologies Inc., System Biosciences, LLC., Synthego, GENEWIZ (Azenta Life Sciences) & other players |
Key Drivers |
• The Widespread Adoption of CRISPR-Cas9 for Gene Editing has Significantly Boosted the Demand for gRNA |
RESTRAINTS |
• Ethical Concerns and Stringent Regulatory Frameworks Surrounding Gene Editing Technologies Pose Significant Challenges to The Expansion of the gRNA Market |
Ans: The North America led gRNA Market.
Ans: The gRNA Market will be valued at USD 2,303.70 Million in 2032.
Ans: Pharmaceutical & Biotechnology Companies held the largest share in the GRNA Market in 2023.
Ans: The expected CAGR of the Global gRNA Market during the forecast period is 19.61%
Ans: The gRNA Market was valued at USD 498.30 Million in 2023.
Table of Contents
1. Introduction
1.1 Market Definition
1.2 Scope (Inclusion and Exclusions)
1.3 Research Assumptions
2. Executive Summary
2.1 Market Overview
2.2 Regional Synopsis
2.3 Competitive Summary
3. Research Methodology
3.1 Top-Down Approach
3.2 Bottom-up Approach
3.3. Data Validation
3.4 Primary Interviews
4. Market Dynamics Impact Analysis
4.1 Market Driving Factors Analysis
4.1.1 Drivers
4.1.2 Restraints
4.1.3 Opportunities
4.1.4 Challenges
4.2 PESTLE Analysis
4.3 Porter’s Five Forces Model
5. Statistical Insights and Trends Reporting
5.1 Incidence and Prevalence (2023)
5.2 Prescription Trends, (2023), by Region
5.3 Drug Volume: Type and usage volumes of pharmaceuticals.
5.4 Healthcare Spending: Expenditure data by government, insurers, and out-of-pocket by patients
6. Competitive Landscape
6.1 List of Major Companies, By Region
6.2 Market Share Analysis, By Region
6.3 Type Benchmarking
6.3.1 Type specifications and features
6.3.2 Pricing
6.4 Strategic Initiatives
6.4.1 Marketing and promotional activities
6.4.2 Distribution and Supply Chain Strategies
6.4.3 Expansion plans and new Type launches
6.4.4 Strategic partnerships and collaborations
6.5 Technological Advancements
6.6 Market Positioning and Branding
7. gRNA Market Segmentation, by Type
7.1 Chapter Overview
7.2 Research-Use
7.2.1 Research-Use Market Trends Analysis (2020-2032)
7.2.2 Research-Use Market Size Estimates and Forecasts to 2032 (USD Million)
7.3 GMP-grade
7.3.1 GMP-grade Market Trends Analysis (2020-2032)
7.3.2 GMP-grade Market Size Estimates and Forecasts to 2032 (USD Million)
8. gRNA Market Segmentation, by Application
8.1 Chapter Overview
8.2 Genome Engineering
8.2.1 Genome Engineering Market Trends Analysis (2020-2032)
8.2.2 Genome Engineering Size Estimates and Forecasts to 2032 (USD Million)
8.3 Disease Model Studies
8.3.1 Disease Model Studies Market Trends Analysis (2020-2032)
8.3.2 Disease Model Studies Market Size Estimates and Forecasts to 2032 (USD Million)
8.4 Functional Genomics
8.4.1 Functional Genomics Market Trends Analysis (2020-2032)
8.4.2 Functional Genomics Size Estimates and Forecasts to 2032 (USD Million)
8.5 Epigenetics
8.5.1 Epigenetics Market Trends Analysis (2020-2032)
8.5.2 Epigenetics Market Size Estimates and Forecasts to 2032 (USD Million)
8.6 Others
8.6.1 Others Market Trends Analysis (2020-2032)
8.6.2 Others Size Estimates and Forecasts to 2032 (USD Million)
9. gRNA Market Segmentation, by End Use
9.1 Chapter Overview
9.2 Pharmaceutical & Biotechnology Companies
9.2. Pharmaceutical & Biotechnology Companies Market Trends Analysis (2020-2032)
9.2.2 Pharmaceutical & Biotechnology Companies Market Size Estimates and Forecasts to 2032 (USD Million)
9.3 Academic Research Institutes
9.3.1 Academic Research Institutes Market Trends Analysis (2020-2032)
9.3. Academic Research Institutes Market Size Estimates and Forecasts to 2032 (USD Million)
9.4 CMOs & CROs
9.4.1 CMOs & CROs Market Trends Analysis (2020-2032)
9.4.2 CMOs & CROs Market Size Estimates and Forecasts to 2032 (USD Million)
10. Regional Analysis
10.1 Chapter Overview
10.2 North America
10.2.1 Trends Analysis
10.2.2 North America gRNA Market Estimates and Forecasts, by Country (2020-2032) (USD Million)
10.2.3 North America gRNA Market Estimates and Forecasts, by Type (2020-2032) (USD Million)
10.2.4 North America gRNA Market Estimates and Forecasts, by Application (2020-2032) (USD Million)
10.2.5 North America gRNA Market Estimates and Forecasts, by End Use (2020-2032) (USD Million)
10.2.6 USA
10.2.6.1 USA gRNA Market Estimates and Forecasts, by Type (2020-2032) (USD Million)
10.2.6.2 USA gRNA Market Estimates and Forecasts, by Application (2020-2032) (USD Million)
10.2.6.3 USA gRNA Market Estimates and Forecasts, by End Use (2020-2032) (USD Million)
10.2.7 Canada
10.2.7.1 Canada gRNA Market Estimates and Forecasts, by Type (2020-2032) (USD Million)
10.2.7.2 Canada gRNA Market Estimates and Forecasts, by Application (2020-2032) (USD Million)
10.2.7.3 Canada gRNA Market Estimates and Forecasts, by End Use (2020-2032) (USD Million)
10.2.8 Mexico
10.2.8.1 Mexico gRNA Market Estimates and Forecasts, by Type (2020-2032) (USD Million)
10.2.8.2 Mexico gRNA Market Estimates and Forecasts, by Application (2020-2032) (USD Million)
10.2.8.3 Mexico gRNA Market Estimates and Forecasts, by End Use (2020-2032) (USD Million)
10.3 Europe
10.3.1 Eastern Europe
10.3.1.1 Trends Analysis
10.3.1.2 Eastern Europe gRNA Market Estimates and Forecasts, by Country (2020-2032) (USD Million)
10.3.1.3 Eastern Europe gRNA Market Estimates and Forecasts, by Type (2020-2032) (USD Million)
10.3.1.4 Eastern Europe gRNA Market Estimates and Forecasts, by Application (2020-2032) (USD Million)
10.3.1.5 Eastern Europe gRNA Market Estimates and Forecasts, by End Use (2020-2032) (USD Million)
10.3.1.6 Poland
10.3.1.6.1 Poland gRNA Market Estimates and Forecasts, by Type (2020-2032) (USD Million)
10.3.1.6.2 Poland gRNA Market Estimates and Forecasts, by Application (2020-2032) (USD Million)
10.3.1.6.3 Poland gRNA Market Estimates and Forecasts, by End Use (2020-2032) (USD Million)
10.3.1.7 Romania
10.3.1.7.1 Romania gRNA Market Estimates and Forecasts, by Type (2020-2032) (USD Million)
10.3.1.7.2 Romania gRNA Market Estimates and Forecasts, by Application (2020-2032) (USD Million)
10.3.1.7.3 Romania gRNA Market Estimates and Forecasts, by End Use (2020-2032) (USD Million)
10.3.1.8 Hungary
10.3.1.8.1 Hungary gRNA Market Estimates and Forecasts, by Type (2020-2032) (USD Million)
10.3.1.8.2 Hungary gRNA Market Estimates and Forecasts, by Application (2020-2032) (USD Million)
10.3.1.8.3 Hungary gRNA Market Estimates and Forecasts, by End Use (2020-2032) (USD Million)
10.3.1.9 Turkey
10.3.1.9.1 Turkey gRNA Market Estimates and Forecasts, by Type (2020-2032) (USD Million)
10.3.1.9.2 Turkey gRNA Market Estimates and Forecasts, by Application (2020-2032) (USD Million)
10.3.1.9.3 Turkey gRNA Market Estimates and Forecasts, by End Use (2020-2032) (USD Million)
10.3.1.10 Rest of Eastern Europe
10.3.1.10.1 Rest of Eastern Europe gRNA Market Estimates and Forecasts, by Type (2020-2032) (USD Million)
10.3.1.10.2 Rest of Eastern Europe gRNA Market Estimates and Forecasts, by Application (2020-2032) (USD Million)
10.3.1.10.3 Rest of Eastern Europe gRNA Market Estimates and Forecasts, by End Use (2020-2032) (USD Million)
10.3.2 Western Europe
10.3.2.1 Trends Analysis
10.3.2.2 Western Europe gRNA Market Estimates and Forecasts, by Country (2020-2032) (USD Million)
10.3.2.3 Western Europe gRNA Market Estimates and Forecasts, by Type (2020-2032) (USD Million)
10.3.2.4 Western Europe gRNA Market Estimates and Forecasts, by Application (2020-2032) (USD Million)
10.3.2.5 Western Europe gRNA Market Estimates and Forecasts, by End Use (2020-2032) (USD Million)
10.3.2.6 Germany
10.3.2.6.1 Germany gRNA Market Estimates and Forecasts, by Type (2020-2032) (USD Million)
10.3.2.6.2 Germany gRNA Market Estimates and Forecasts, by Application (2020-2032) (USD Million)
10.3.2.6.3 Germany gRNA Market Estimates and Forecasts, by End Use (2020-2032) (USD Million)
10.3.2.7 France
10.3.2.7.1 France gRNA Market Estimates and Forecasts, by Type (2020-2032) (USD Million)
10.3.2.7.2 France gRNA Market Estimates and Forecasts, by Application (2020-2032) (USD Million)
10.3.2.7.3 France gRNA Market Estimates and Forecasts, by End Use (2020-2032) (USD Million)
10.3.2.8 UK
10.3.2.8.1 UK gRNA Market Estimates and Forecasts, by Type (2020-2032) (USD Million)
10.3.2.8.2 UK gRNA Market Estimates and Forecasts, by Application (2020-2032) (USD Million)
10.3.2.8.3 UK gRNA Market Estimates and Forecasts, by End Use (2020-2032) (USD Million)
10.3.2.9 Italy
10.3.2.9.1 Italy gRNA Market Estimates and Forecasts, by Type (2020-2032) (USD Million)
10.3.2.9.2 Italy gRNA Market Estimates and Forecasts, by Application (2020-2032) (USD Million)
10.3.2.9.3 Italy gRNA Market Estimates and Forecasts, by End Use (2020-2032) (USD Million)
10.3.2.10 Spain
10.3.2.10.1 Spain gRNA Market Estimates and Forecasts, by Type (2020-2032) (USD Million)
10.3.2.10.2 Spain gRNA Market Estimates and Forecasts, by Application (2020-2032) (USD Million)
10.3.2.10.3 Spain gRNA Market Estimates and Forecasts, by End Use (2020-2032) (USD Million)
10.3.2.11 Netherlands
10.3.2.11.1 Netherlands gRNA Market Estimates and Forecasts, by Type (2020-2032) (USD Million)
10.3.2.11.2 Netherlands gRNA Market Estimates and Forecasts, by Application (2020-2032) (USD Million)
10.3.2.11.3 Netherlands gRNA Market Estimates and Forecasts, by End Use (2020-2032) (USD Million)
10.3.2.12 Switzerland
10.3.2.12.1 Switzerland gRNA Market Estimates and Forecasts, by Type (2020-2032) (USD Million)
10.3.2.12.2 Switzerland gRNA Market Estimates and Forecasts, by Application (2020-2032) (USD Million)
10.3.2.12.3 Switzerland gRNA Market Estimates and Forecasts, by End Use (2020-2032) (USD Million)
10.3.2.13 Austria
10.3.2.13.1 Austria gRNA Market Estimates and Forecasts, by Type (2020-2032) (USD Million)
10.3.2.13.2 Austria gRNA Market Estimates and Forecasts, by Application (2020-2032) (USD Million)
10.3.2.13.3 Austria gRNA Market Estimates and Forecasts, by End Use (2020-2032) (USD Million)
10.3.2.14 Rest of Western Europe
10.3.2.14.1 Rest of Western Europe gRNA Market Estimates and Forecasts, by Type (2020-2032) (USD Million)
10.3.2.14.2 Rest of Western Europe gRNA Market Estimates and Forecasts, by Application (2020-2032) (USD Million)
10.3.2.14.3 Rest of Western Europe gRNA Market Estimates and Forecasts, by End Use (2020-2032) (USD Million)
10.4 Asia-Pacific
10.4.1 Trends Analysis
10.4.2 Asia-Pacific gRNA Market Estimates and Forecasts, by Country (2020-2032) (USD Million)
10.4.3 Asia-Pacific gRNA Market Estimates and Forecasts, by Type (2020-2032) (USD Million)
10.4.4 Asia-Pacific gRNA Market Estimates and Forecasts, by Application (2020-2032) (USD Million)
10.4.5 Asia-Pacific gRNA Market Estimates and Forecasts, by End Use (2020-2032) (USD Million)
10.4.6 China
10.4.6.1 China gRNA Market Estimates and Forecasts, by Type (2020-2032) (USD Million)
10.4.6.2 China gRNA Market Estimates and Forecasts, by Application (2020-2032) (USD Million)
10.4.6.3 China gRNA Market Estimates and Forecasts, by End Use (2020-2032) (USD Million)
10.4.7 India
10.4.7.1 India gRNA Market Estimates and Forecasts, by Type (2020-2032) (USD Million)
10.4.7.2 India gRNA Market Estimates and Forecasts, by Application (2020-2032) (USD Million)
10.4.7.3 India gRNA Market Estimates and Forecasts, by End Use (2020-2032) (USD Million)
10.4.8 Japan
10.4.8.1 Japan gRNA Market Estimates and Forecasts, by Type (2020-2032) (USD Million)
10.4.8.2 Japan gRNA Market Estimates and Forecasts, by Application (2020-2032) (USD Million)
10.4.8.3 Japan gRNA Market Estimates and Forecasts, by End Use (2020-2032) (USD Million)
10.4.9 South Korea
10.4.9.1 South Korea gRNA Market Estimates and Forecasts, by Type (2020-2032) (USD Million)
10.4.9.2 South Korea gRNA Market Estimates and Forecasts, by Application (2020-2032) (USD Million)
10.4.9.3 South Korea gRNA Market Estimates and Forecasts, by End Use (2020-2032) (USD Million)
10.4.10 Vietnam
10.4.10.1 Vietnam gRNA Market Estimates and Forecasts, by Type (2020-2032) (USD Million)
10.4.10.2 Vietnam gRNA Market Estimates and Forecasts, by Application (2020-2032) (USD Million)
10.4.10.3 Vietnam gRNA Market Estimates and Forecasts, by End Use (2020-2032) (USD Million)
10.4.11 Singapore
10.4.11.1 Singapore gRNA Market Estimates and Forecasts, by Type (2020-2032) (USD Million)
10.4.11.2 Singapore gRNA Market Estimates and Forecasts, by Application (2020-2032) (USD Million)
10.4.11.3 Singapore gRNA Market Estimates and Forecasts, by End Use (2020-2032) (USD Million)
10.4.12 Australia
10.4.12.1 Australia gRNA Market Estimates and Forecasts, by Type (2020-2032) (USD Million)
10.4.12.2 Australia gRNA Market Estimates and Forecasts, by Application (2020-2032) (USD Million)
10.4.12.3 Australia gRNA Market Estimates and Forecasts, by End Use (2020-2032) (USD Million)
10.4.13 Rest of Asia-Pacific
10.4.13.1 Rest of Asia-Pacific gRNA Market Estimates and Forecasts, by Type (2020-2032) (USD Million)
10.4.13.2 Rest of Asia-Pacific gRNA Market Estimates and Forecasts, by Application (2020-2032) (USD Million)
10.4.13.3 Rest of Asia-Pacific gRNA Market Estimates and Forecasts, by End Use (2020-2032) (USD Million)
10.5 Middle East and Africa
10.5.1 Middle East
10.5.1.1 Trends Analysis
10.5.1.2 Middle East gRNA Market Estimates and Forecasts, by Country (2020-2032) (USD Million)
10.5.1.3 Middle East gRNA Market Estimates and Forecasts, by Type (2020-2032) (USD Million)
10.5.1.4 Middle East gRNA Market Estimates and Forecasts, by Application (2020-2032) (USD Million)
10.5.1.5 Middle East gRNA Market Estimates and Forecasts, by End Use (2020-2032) (USD Million)
10.5.1.6 UAE
10.5.1.6.1 UAE gRNA Market Estimates and Forecasts, by Type (2020-2032) (USD Million)
10.5.1.6.2 UAE gRNA Market Estimates and Forecasts, by Application (2020-2032) (USD Million)
10.5.1.6.3 UAE gRNA Market Estimates and Forecasts, by End Use (2020-2032) (USD Million)
10.5.1.7 Egypt
10.5.1.7.1 Egypt gRNA Market Estimates and Forecasts, by Type (2020-2032) (USD Million)
10.5.1.7.2 Egypt gRNA Market Estimates and Forecasts, by Application (2020-2032) (USD Million)
10.5.1.7.3 Egypt gRNA Market Estimates and Forecasts, by End Use (2020-2032) (USD Million)
10.5.1.8 Saudi Arabia
10.5.1.8.1 Saudi Arabia gRNA Market Estimates and Forecasts, by Type (2020-2032) (USD Million)
10.5.1.8.2 Saudi Arabia gRNA Market Estimates and Forecasts, by Application (2020-2032) (USD Million)
10.5.1.8.3 Saudi Arabia gRNA Market Estimates and Forecasts, by End Use (2020-2032) (USD Million)
10.5.1.9 Qatar
10.5.1.9.1 Qatar gRNA Market Estimates and Forecasts, by Type (2020-2032) (USD Million)
10.5.1.9.2 Qatar gRNA Market Estimates and Forecasts, by Application (2020-2032) (USD Million)
10.5.1.9.3 Qatar gRNA Market Estimates and Forecasts, by End Use (2020-2032) (USD Million)
10.5.1.10 Rest of Middle East
10.5.1.10.1 Rest of Middle East gRNA Market Estimates and Forecasts, by Type (2020-2032) (USD Million)
10.5.1.10.2 Rest of Middle East gRNA Market Estimates and Forecasts, by Application (2020-2032) (USD Million)
10.5.1.10.3 Rest of Middle East gRNA Market Estimates and Forecasts, by End Use (2020-2032) (USD Million)
10.5.2 Africa
10.5.2.1 Trends Analysis
10.5.2.2 Africa gRNA Market Estimates and Forecasts, by Country (2020-2032) (USD Million)
10.5.2.3 Africa gRNA Market Estimates and Forecasts, by Type (2020-2032) (USD Million)
10.5.2.4 Africa gRNA Market Estimates and Forecasts, by Application (2020-2032) (USD Million)
10.5.2.5 Africa gRNA Market Estimates and Forecasts, by End Use (2020-2032) (USD Million)
10.5.2.6 South Africa
10.5.2.6.1 South Africa gRNA Market Estimates and Forecasts, by Type (2020-2032) (USD Million)
10.5.2.6.2 South Africa gRNA Market Estimates and Forecasts, by Application (2020-2032) (USD Million)
10.5.2.6.3 South Africa gRNA Market Estimates and Forecasts, by End Use (2020-2032) (USD Million)
10.5.2.7 Nigeria
10.5.2.7.1 Nigeria gRNA Market Estimates and Forecasts, by Type (2020-2032) (USD Million)
10.5.2.7.2 Nigeria gRNA Market Estimates and Forecasts, by Application (2020-2032) (USD Million)
10.5.2.7.3 Nigeria gRNA Market Estimates and Forecasts, by End Use (2020-2032) (USD Million)
10.5.2.8 Rest of Africa
10.5.2.8.1 Rest of Africa gRNA Market Estimates and Forecasts, by Type (2020-2032) (USD Million)
10.5.2.8.2 Rest of Africa gRNA Market Estimates and Forecasts, by Application (2020-2032) (USD Million)
10.5.2.8.3 Rest of Africa gRNA Market Estimates and Forecasts, by End Use (2020-2032) (USD Million)
10.6 Latin America
10.6.1 Trends Analysis
10.6.2 Latin America gRNA Market Estimates and Forecasts, by Country (2020-2032) (USD Million)
10.6.3 Latin America gRNA Market Estimates and Forecasts, by Type (2020-2032) (USD Million)
10.6.4 Latin America gRNA Market Estimates and Forecasts, by Application (2020-2032) (USD Million)
10.6.5 Latin America gRNA Market Estimates and Forecasts, by End Use (2020-2032) (USD Million)
10.6.6 Brazil
10.6.6.1 Brazil gRNA Market Estimates and Forecasts, by Type (2020-2032) (USD Million)
10.6.6.2 Brazil gRNA Market Estimates and Forecasts, by Application (2020-2032) (USD Million)
10.6.6.3 Brazil gRNA Market Estimates and Forecasts, by End Use (2020-2032) (USD Million)
10.6.7 Argentina
10.6.7.1 Argentina gRNA Market Estimates and Forecasts, by Type (2020-2032) (USD Million)
10.6.7.2 Argentina gRNA Market Estimates and Forecasts, by Application (2020-2032) (USD Million)
10.6.7.3 Argentina gRNA Market Estimates and Forecasts, by End Use (2020-2032) (USD Million)
10.6.8 Colombia
10.6.8.1 Colombia gRNA Market Estimates and Forecasts, by Type (2020-2032) (USD Million)
10.6.8.2 Colombia gRNA Market Estimates and Forecasts, by Application (2020-2032) (USD Million)
10.6.8.3 Colombia gRNA Market Estimates and Forecasts, by End Use (2020-2032) (USD Million)
10.6.9 Rest of Latin America
10.6.9.1 Rest of Latin America gRNA Market Estimates and Forecasts, by Type (2020-2032) (USD Million)
10.6.9.2 Rest of Latin America gRNA Market Estimates and Forecasts, by Application (2020-2032) (USD Million)
10.6.9.3 Rest of Latin America gRNA Market Estimates and Forecasts, by End Use (2020-2032) (USD Million)
11. Company Profiles
11.1 Jena Bioscience GmbH
11.1.1 Company Overview
11.1.2 Financial
11.1.3 Types/ Services Offered
11.1.4 SWOT Analysis
11.2 Thermo Fisher Scientific Inc.
11.2.1 Company Overview
11.2.2 Financial
11.2.3 Types/ Services Offered
11.2.4 SWOT Analysis
11.3 Synbio Technologies
11.3.1 Company Overview
11.3.2 Financial
11.3.3 Types/ Services Offered
11.3.4 SWOT Analysis
11.4 Merck KGaA
11.4.1 Company Overview
11.4.2 Financial
11.4.3 Types/ Services Offered
11.4.4 SWOT Analysis
11.5 Takara Bio Inc.
11.5.1 Company Overview
11.5.2 Financial
11.5.3 Types/ Services Offered
11.5.4 SWOT Analysis
11.6 Horizon Discovery Ltd.
11.6.1 Company Overview
11.6.2 Financial
11.6.3 Types/ Services Offered
11.6.4 SWOT Analysis
11.7 Agilent Technologies Inc.
11.7.1 Company Overview
11.7.2 Financial
11.7.3 Types/ Services Offered
11.7.4 SWOT Analysis
11.8 System Biosciences, LLC.
11.8.1 Company Overview
11.8.2 Financial
11.8.3 Types/ Services Offered
11.8.4 SWOT Analysis
11.9 Synthego
11.9.1 Company Overview
11.9.2 Financial
11.9.3 Types/ Services Offered
11.9.4 SWOT Analysis
11.10 GENEWIZ (Azenta Life Sciences)
11.10.1 Company Overview
11.10.2 Financial
11.10.3 Types/ Services Offered
11.10.4 SWOT Analysis
12. Use Cases and Best Practices
13. Conclusion
An accurate research report requires proper strategizing as well as implementation. There are multiple factors involved in the completion of good and accurate research report and selecting the best methodology to compete the research is the toughest part. Since the research reports we provide play a crucial role in any company’s decision-making process, therefore we at SNS Insider always believe that we should choose the best method which gives us results closer to reality. This allows us to reach at a stage wherein we can provide our clients best and accurate investment to output ratio.
Each report that we prepare takes a timeframe of 350-400 business hours for production. Starting from the selection of titles through a couple of in-depth brain storming session to the final QC process before uploading our titles on our website we dedicate around 350 working hours. The titles are selected based on their current market cap and the foreseen CAGR and growth.
The 5 steps process:
Step 1: Secondary Research:
Secondary Research or Desk Research is as the name suggests is a research process wherein, we collect data through the readily available information. In this process we use various paid and unpaid databases which our team has access to and gather data through the same. This includes examining of listed companies’ annual reports, Journals, SEC filling etc. Apart from this our team has access to various associations across the globe across different industries. Lastly, we have exchange relationships with various university as well as individual libraries.
Step 2: Primary Research
When we talk about primary research, it is a type of study in which the researchers collect relevant data samples directly, rather than relying on previously collected data. This type of research is focused on gaining content specific facts that can be sued to solve specific problems. Since the collected data is fresh and first hand therefore it makes the study more accurate and genuine.
We at SNS Insider have divided Primary Research into 2 parts.
Part 1 wherein we interview the KOLs of major players as well as the upcoming ones across various geographic regions. This allows us to have their view over the market scenario and acts as an important tool to come closer to the accurate market numbers. As many as 45 paid and unpaid primary interviews are taken from both the demand and supply side of the industry to make sure we land at an accurate judgement and analysis of the market.
This step involves the triangulation of data wherein our team analyses the interview transcripts, online survey responses and observation of on filed participants. The below mentioned chart should give a better understanding of the part 1 of the primary interview.
Part 2: In this part of primary research the data collected via secondary research and the part 1 of the primary research is validated with the interviews from individual consultants and subject matter experts.
Consultants are those set of people who have at least 12 years of experience and expertise within the industry whereas Subject Matter Experts are those with at least 15 years of experience behind their back within the same space. The data with the help of two main processes i.e., FGDs (Focused Group Discussions) and IDs (Individual Discussions). This gives us a 3rd party nonbiased primary view of the market scenario making it a more dependable one while collation of the data pointers.
Step 3: Data Bank Validation
Once all the information is collected via primary and secondary sources, we run that information for data validation. At our intelligence centre our research heads track a lot of information related to the market which includes the quarterly reports, the daily stock prices, and other relevant information. Our data bank server gets updated every fortnight and that is how the information which we collected using our primary and secondary information is revalidated in real time.
Step 4: QA/QC Process
After all the data collection and validation our team does a final level of quality check and quality assurance to get rid of any unwanted or undesired mistakes. This might include but not limited to getting rid of the any typos, duplication of numbers or missing of any important information. The people involved in this process include technical content writers, research heads and graphics people. Once this process is completed the title gets uploader on our platform for our clients to read it.
Step 5: Final QC/QA Process:
This is the last process and comes when the client has ordered the study. In this process a final QA/QC is done before the study is emailed to the client. Since we believe in giving our clients a good experience of our research studies, therefore, to make sure that we do not lack at our end in any way humanly possible we do a final round of quality check and then dispatch the study to the client.
Key Segments
By Type
Research-Use
GMP-grade
By Application
Genome Engineering
Disease Model Studies
Functional Genomics
Epigenetics
Others
By End Use
Pharmaceutical & Biotechnology Companies
Academic Research Institutes
CMOs & CROs
Request for Segment Customization as per your Business Requirement: Segment Customization Request
Regional Coverage:
North America
US
Canada
Mexico
Europe
Eastern Europe
Poland
Romania
Hungary
Turkey
Rest of Eastern Europe
Western Europe
Germany
France
UK
Italy
Spain
Netherlands
Switzerland
Austria
Rest of Western Europe
Asia-Pacific
China
India
Japan
South Korea
Vietnam
Singapore
Australia
Rest of Asia-Pacific
Middle East & Africa
Middle East
UAE
Egypt
Saudi Arabia
Qatar
Rest of the Middle East
Africa
Nigeria
South Africa
Rest of Africa
Latin America
Brazil
Argentina
Colombia
Rest of Latin America
Request for Country Level Research Report: Country Level Customization Request
Available Customization
With the given market data, SNS Insider offers customization as per the company’s specific needs. The following customization options are available for the report:
Product Analysis
Criss-Cross segment analysis (e.g. Product X Application)
Product Matrix which gives a detailed comparison of the product portfolio of each company
Geographic Analysis
Additional countries in any of the regions
Company Information
Detailed analysis and profiling of additional market players (Up to five)
The Mammography Workstations Market Size was valued at USD 152.75 million in 2023, and is expected to reach USD 264.42 million by 2031, and grow at a CAGR of 7.1% over the forecast period 2024-2031.
Circulating Tumor Cells Market was estimated at $ 11.35 billion in 2023 and is expected to reach $ 36.33 billion by 2032 with a CAGR of 13.8% from 2024-2032.
The Ventricular Assist Device Market Size was USD 1.6 Billion in 2023 and is projected to grow to USD 3.3 Billion by 2032, with a CAGR of 8.8%.
The Patient Monitoring Devices Market was valued at USD 48.03 billion in 2023 and is expected to grow to USD 93.53 billion by 2032 and grow at a CAGR of 7.71% over the forecast period of 2024-2032.
The Tissue Engineering Market was valued at USD 16.8 Billion in 2023 and will reach USD 56.2 Billion by 2032, with a CAGR of 14.3% from 2024-2032.
The Antidepressants Market Size was valued at USD 19.92 Billion in 2023, and is expected to reach USD 37.44 Billion by 2032, and grow at a CAGR of 7.66%.
Hi! Click one of our member below to chat on Phone