Green Solvents Market Report Scope & Overview:
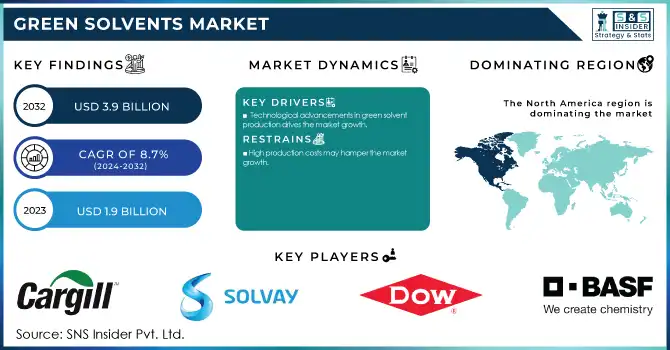
The Green Solvents Market size was valued at USD 1.9 Billion in 2023. It is expected to grow to USD 3.9 Billion by 2032 and grow at a CAGR of 8.7% over the forecast period of 2024-2032.
To get more information on Green Solvents Market - Request Free Sample Report
Rapid growth in the demand of paintings and coatings containing green solvents is a key factor in the growth of the green solvents market. Historically, solvent based paints and coatings have contained volatile organic compounds (VOCs), which are dangerous for people and the planet. As we become increasingly aware of the need for air quality improvements, action on climate change, and regulatory challenges, a transition to cleaner alternatives has occurred. Green solvents are gaining greater acceptance as they possess similar or better performance than traditional solvents, but are obtained from renewable resources and have lower toxicity.
Moreover, water reducible; low VOC coatings from green solvents are increasingly accepted for residential and commercial end-use as they are eco-friendly and are in line with higher regulatory requirements such as REACH (Registration, Evaluation, Authorization, and Restriction of Chemicals) in the EU and EPA's VOC regulations in U.S., and others. Furthermore, the demand for green solvents is accelerating due to an increasing preference for eco-friendly paints and coatings, supported by mushrooming demand for sustainability from consumers and businesses. As the paints and coatings industry continues to seek more sustainable, non-toxic solutions, novel and more efficient high-performance green solvents stand among the most promising candidates for greener, advanced processes in the near future.
The escalating consumption for green products among the consumers plays an imperative role in propelling the market growth of green solvents. Consumers are increasingly high aware about the environment they live in; therefore, they want the products that are effective but at the same time are safe for the environment and human health. Consumers are making this transition in many sectors personal care, cleaning products, paints where consumer demand is for products derived from renewable, non-toxic ingredients. Due to the increasement sustainability needs, the utilization of green solvents is becoming increasingly popular. Chemical solvents, such as VOCs, are especially harmful to the environment because they are one of the reasons that contribute to air pollution due to the dangerous toxins emitted through them all over the world, contributing to worsening climate change the world is experiencing, and consumers are now more aware this. In turn, this has spurred manufacturers to reformulate products to be more sustainable by adopting green solvents to replace harmful petrochemical-derived solvents.
In 2024, BASF has continued to expand its green solvents portfolio by introducing Care Palko, a series of bio-based solvents for use in personal care products. These new bio-solvents meet the growing consumer demand for eco-friendly, sustainable alternatives in cosmetics and skincare products.
Drivers
-
Technological advancements in green solvent production drives the market growth.
Technological development of the green solvent production is expected to fuel the growth of the green solvents market. Development of more efficient and sustainable production methods for green solvents has seen considerable progress over the last decade, propelled by advances in biotechnology and green chemistry. Such advances resulted in the production of bio-sourced solvents that are safe for the environment and are competitive in economic terms with traditional petroleum-derived solvents. For example, fermentation technology and enzymatic processes have made it feasible to produce high-purity, bio-based solvents from renewable raw materials like plant oil, sugars, or agricultural waste streams. In addition, recent developments of bio-catalysts and green synthesis routes increase the efficiency and scalability of green solvent production while minimizing energy input and waste. These developments are facilitating the adoption of green solvents across several end-user industries, including paints and coatings, cleaning and personal care, among others, where sustainable alternatives are gaining traction. The growing versatility and efficiency of green solvents backed by increasing economic viability as an alternative to traditional solvents with superior properties are bolstering the adoption of green solvents across various sectors, which will propel the market growth.
Restraint
-
High production costs may hamper the market growth.
The high cost of production is an obstacle to the expansion of the green solvents market. Green solvents provide a range of environmental and health benefits, but can also be more expensive to produce than traditional petroleum-based solvents. It is generally owing to renewable feedstock, high-end biotechnological processes, and facilities needed for the solvent production. For example, bio-based solvents tend to come from agricultural crops or biomass and may have higher farming, harvesting, and processing costs than petroleum extraction costs in some cases. Also, the energy-intensive nature of the processes for fermenting and/or synthesizing such solvents results in a greater OPEX. As a result, the production cost of green solvents is sometimes higher, and unless this cost is able to be offset by savings from reduced energy use and waste disposal, green solvents may not be able to compete on price when compared to much cheaper and widely available petrochemical solvents
Green Solvents Market Segmentation Analysis
By Product
Lactate Esters held the highest share of 36% in 2023. This is owing to their non-toxicity and versatile applications along with their good environmental profile. Biodegradable and non-toxic lactate esters made from renewable sources, such as lactic acid, are very appealing for industries to replace conventional, more harmful solvents due to the lower overall environmental footprint (in terms of embedded energy). Their ability to dissolve a broader range of substances, combined with improved safety for human health and the environment has ensured their popularity within the paints and coatings; personal care; and pharmaceuticals sectors. Moreover, in lactates owing to its good solvent properties (high solvency, low vapor pressure, good flash point), lactate esters can sometimes be effective replacements for more traditional solvents.
By End-User Industry
Paints & Coatings held the largest market share around 32 % in 2023. This industry has very high demand for eco-friendly alternatives to conventional solvents. Conventional paint and coatings formulations have been made using petroleum-based solvents that are hazardous to human health and the environment where they result in high levels of volatile organic compounds (VOCs). Nevertheless, this sector has witnessed the gradual transition to green solvents due to increasing environmental concerns, regulatory impetus and consumer preferences for safer, sustainable products. Conventional solvents used in paints and coatings are toxic and present a safety hazard but bio-based esters and lactate esters are increasingly being formulated as green solvents in low-VOC and water-based paints and coatings. Moreover, the EU's REACH (Registration, Evaluation, Authorization, and Restriction of Chemicals) and the U.S. Environmental Protection Agency's VOC regulations have been necessary drivers for the paint and coatings industry to embrace greener solutions.
Green Solvents Market Regional Analysis
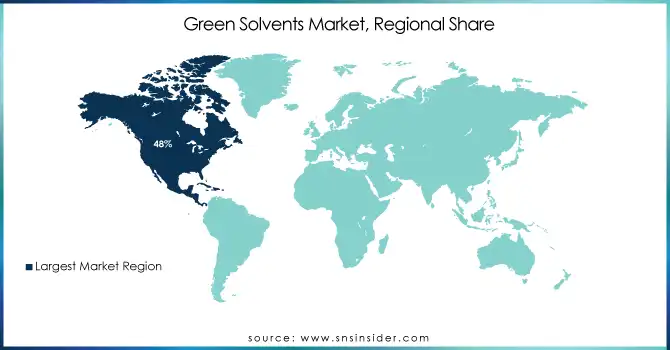
North America held the largest market share around 48% in 2023. The U.S. EPA (Environmental Protection Agency) VOC (volatile organic compound) emissions standards and similar stringent environmental regulations throughout the region have forced many industries to change to safer, environmentally sound alternatives to ordinary solvents. Moreover, consumer awareness and demand for eco-friendly products have forced industries such as paints & coatings, cleaning products, and personal care to implement green solvents. In practice, the U.S. and Canada both have world-leading industrial infrastructure supporting research and development on this topic, and investments have grown in developing and introducing green solvents. In addition, North American companies are increasingly working towards corporate sustainability objectives, resulting in increased adoption of bio-based and low-toxic solvents. North America is the largest market for green solvents accounting for the highest share in the market due to the established regulatory framework of the region coupled with similar sustainability objective among the industry and consumer sector.
Get Customized Report as per Your Business Requirement - Enquiry Now
Key Players
-
BASF SE (Propylene Carbonate, Ethyl Lactate)
-
Dow Chemical (D-limonene, Soy Methyl Ester)
-
Solvay (Dimethyl Sulfoxide, Ethyl Acetate)
-
Cargill (Bio-based Propylene Glycol, Bio-based Polyols)
-
Eastman Chemical Company (Acetic Acid, Methyl Acetate)
-
Akzo Nobel N.V. (Ethylene Glycol, Butyl Acetate)
-
Arkema (Methyl Ethyl Ketone, Bio-Based Acrylics)
-
Huntsman Corporation (Propylene Glycol, Ethylene Carbonate)
-
LyondellBasell (Bio-based Butanediol, Bio-based Polyethylene)
-
Corbion (Lactic Acid, PLA Resin)
-
Evonik Industries (Bio-based Surfactants, Isopropyl Alcohol)
-
Vertec Biosolvents (Ethyl Lactate, Methyl Soyate)
-
NatureWorks LLC (Ingeo Biopolymer, Bio-based Polylactic Acid)
-
GFBiochemicals (Levulinic Acid, Gamma-Valerolactone)
-
Archer Daniels Midland (ADM) (Ethanol, Biobutanol)
-
Genomatica (1,4-Butanediol, Bio-based Acetone)
-
BioAmber (Succinic Acid, 1,4-Butanediol)
-
Mitsubishi Chemical (Bio-based Polymers, Polylactic Acid)
-
Novozymes (Bioethanol, Bio-based Enzymes)
-
PTT Global Chemical (Bio-based Propylene Glycol, Bio-based Polyols
Recent Development:
-
In October 2024, AP Møller Holding announced plans to establish a €1.5 billion factory in Antwerp, Belgium, dedicated to producing plastics without relying on fossil fuels. The facility, operated by the newly formed company Vioneo, will utilize green methanol derived from low-carbon hydrogen or biomass and will be powered by green electricity
-
In 2022, Dow announced a collaboration with leading industry partners to develop and commercialize bio-based solvents aimed at reducing the carbon footprint of solvent applications across multiple sectors.
| Report Attributes | Details |
|---|---|
|
Market Size in 2023 |
USD 1.9 Billion |
|
Market Size by 2032 |
USD 3.9 Billion |
|
CAGR |
CAGR of 8.7% From 2024 to 2032 |
|
Base Year |
2023 |
|
Forecast Period |
2024-2032 |
|
Historical Data |
2020-2022 |
|
Report Scope & Coverage |
Market Size, Segments Analysis, Competitive Landscape, Regional Analysis, DROC & SWOT Analysis, Forecast Outlook |
|
Key Segments |
• By Product Type (Bio-Alcohols, Bio-Glycols, Lactate Esters, D-Limonene, Methyl Soyate, Others) |
|
Regional Analysis/Coverage |
North America (US, Canada, Mexico), Europe (Eastern Europe [Poland, Romania, Hungary, Turkey, Rest of Eastern Europe] Western Europe] Germany, France, UK, Italy, Spain, Netherlands, Switzerland, Austria, Rest of Western Europe]), Asia Pacific (China, India, Japan, South Korea, Vietnam, Singapore, Australia, Rest of Asia Pacific), Middle East & Africa (Middle East [UAE, Egypt, Saudi Arabia, Qatar, Rest of Middle East], Africa [Nigeria, South Africa, Rest of Africa], Latin America (Brazil, Argentina, Colombia, Rest of Latin America) |
|
Company Profiles |
BASF SE, Dow Chemical, Solvay, Cargill, Eastman Chemical Company, Akzo Nobel N.V., Arkema, Huntsman Corporation, LyondellBasell, Corbion, Evonik Industries, Vertec Biosolvents, NatureWorks LLC, GFBiochemicals, Archer Daniels Midland (ADM), Genomatica, BioAmber, Mitsubishi Chemical, Novozymes, PTT Global Chemical. |
|
Key Drivers |
• Technological advancements in green solvent production drives the market growth. |
|
Restraints |
• High production costs may hamper the market growth. |
