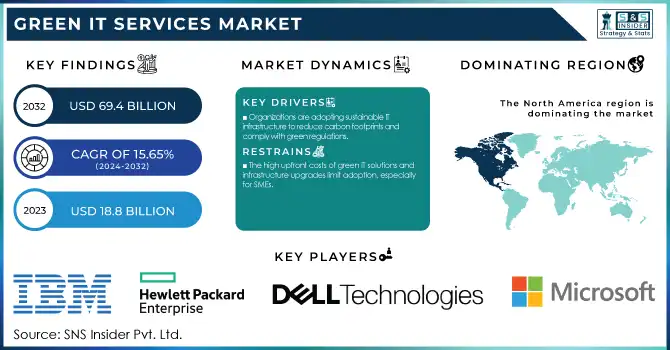
The Green IT Services Market was valued at USD 18.8 Billion in 2023 and is expected to reach USD 69.4 Billion by 2032, growing at a CAGR of 15.65% from 2024-2032. The adoption of emerging technologies in ICT is accelerating with AI, IoT, and edge computing advancements. Network infrastructure expansion, especially in 5G and fiber optics, is enhancing global connectivity, while cybersecurity incidents from 2020-2023 highlight the need for stronger security measures. Additionally, rising cloud service usage is driving demand for hybrid and multi-cloud solutions, with our latest report adding insights on Green IT Services, including energy-efficient data centers and carbon-aware computing.
To get more information on Green IT Services Market - Request Free Sample Report
Drivers
Organizations are adopting sustainable IT infrastructure to reduce carbon footprints and comply with green regulations.
Demand for Sustainable IT Infrastructure, A Key Factor for the Growth of Green IT Services Market. Data centers help organizations across the globe to reduce carbon footprints by implementing energy-efficient designs, virtualization, cloud computing, etc. Further propelling the market growth are the initiatives for green computing on the regulatory front, such as carbon tax policies and emission reduction goals. Also, the increasing focus of enterprises on the environmental impact is pushing them to utilize renewable energy sources in IT to maintain the longer-run sustainability and cost-effective aspect with better corporate social responsibility initiatives.
Restraints
The high upfront costs of green IT solutions and infrastructure upgrades limit adoption, especially for SMEs.
Cost-saving and environmental advantages are long-term, resulting in high initial investment being a key restraining factor for adoption of Green IT Solutions. Investing in energy-efficient hardware, sustainable software solutions, and infrastructure upgrades is expensive and simply not financially viable for Lower-Middle segment businesses or SMEs. Additionally, the adoption of sustainable IT models is a challenge for several organizations, as it includes barriers such as employee training, implementation of green technologies, and adherence to strict environmental regulations.
Opportunities
AI and IoT optimize energy consumption, automate processes, and enable carbon footprint tracking in IT systems.
Integration of AI with IoT is also paving the way for new opportunities in the Green IT Services Market Data centers leverage energy consumption optimization through AI-powered analytics, while IoT sensors across IT infrastructure help you monitor and reduce power usage. With smart automation, predictive maintenance takes place that minimizes hardware failures and energy losses. Additionally, there are also tools powered by AI that help businesses track their carbon emissions and reduce their carbon footprint. A surge in the adoption of AI and IoT in Green IT solutions is projected as enterprises embrace the process of digital transformation, further driving the market growth.
Challenges
The absence of global Green IT standards and limited awareness hinder widespread adoption across industries.
Demand for Green IT is mainly dependent on global standards which are not yet available thus creating hurdles in the market growth. Additional regulations and standards for sustainability are set by diverse regions resulting in companies having difficulty crossing compliance standards. Furthermore, especially, SME businesses are especially unaware of Green IT services and do not consider sustainability in their IT strategy well. We must work with governments and industry organizations to ensure widespread harmonization and adoption of sustainable IT solutions across global marketplaces; tackling this challenge will not happen overnight, but will be achieved through coordinated efforts to raise awareness and accelerate commercialization.
By Type
In 2023, the software segment dominated the market and accounted for a significant revenue share. Corporations are adopting policies that require lower carbon emissions and greater energy efficiency. Software solutions that assist organizations in compliance with the regulations are thus in great demand. In November 2024, ZTE Corporation along with China Mobile Limited, announced their AI-based Green Telco Cloud solution. Instead, this latest premier system uses deep neural network models to enhance energy utilization in telco-cloud entities.
The services segment is expected to have the fastest CAGR. The growth of the services segment can be attributed to several factors, including increasing demand for sustainable practices, growing awareness and education, and regulatory compliance. Sustainable IT is where businesses are trying to control the carbon footprint, so, as a result, the demand for consulting, implementation, and support services on green technology will be increased.
By Deployment
In 2023, The on-premises segment dominated the market and held the largest revenue share of more than 73%. Alike other industries like BFSI, healthcare, and government, the organizations are giving immense priority to Data security and regulatory compliance. On-premises solutions give organizations more control over the way that they manage information and security policies, mitigating the threat of data leaks and unauthorized access to sensitive information. In addition, an on-premises deployment gives the organization the agility to customize its IT infrastructure based on operational requirements.
The cloud segment is expected to grow at the fastest CAGR as compared to other factors. As we all know, Cloud computing is the latest trend in the world of technology and it provides us with easy access to various tools like AI, ML, big data analysis, etc. These technologies enhance operational efficiency and lead to greener IT by minimizing resource utilization.
By End-Use
In 2023, the IT and telecommunications segment dominated the market and accounted for a significant revenue share. Consumers are increasingly seeking eco-friendly and sustainable products and services. In network and IT infrastructure companies, companies are integrating green IT solutions within their operations to fulfill customer requirements and gain a competitive edge in the market.
The healthcare & life sciences segment is expected to grow at the fastest rate during the forecast period. With Green IT services healthcare facilities can optimize their IT infrastructure in turn leads to better energy consumption and costs associated with it. This will give you a very good return on investment that can be redirected to improving patient care and research initiatives by migrating to energy-efficient systems and virtualization technologies.
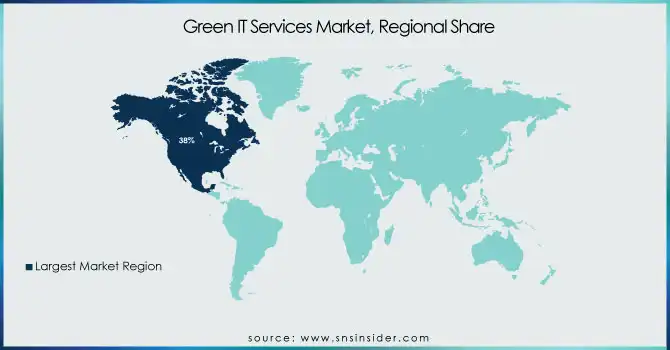
In 2023, North America dominated the market and accounted for 38% of the revenue share, environmentally sustainable infrastructures have been necessitated by the fast-paced growth of cloud computing and the number of data centers in North America. Green IT services reduce energy consumption in these facilities by optimizing cooling systems, using energy-efficient hardware, and integrating renewable energy sources, especially solar and wind energy.
The Asia Pacific green IT services market is expected to witness the fastest CAGR during the forecast period. Countries like China and India saw their cities explode with vendors offering their wares and services, all clamouring for IT infrastructure; The larger trend of big data surprises continues to grow, and there is a stronger focus on sustainable and energy-efficient IT by way of green data centers, virtualization, and cloud computing to help minimize the environmental cost of expanding big data.
Get Customized Report as per Your Business Requirement - Enquiry Now
The major key players along with their products are
IBM Corporation – IBM Green IT Services
Hewlett Packard Enterprise (HPE) – HPE GreenLake
Dell Technologies – Dell EMC PowerEdge Servers
Cisco Systems, Inc. – Cisco Energy Management Suite
Microsoft Corporation – Microsoft Azure Sustainability Calculator
Accenture PLC – Accenture Green Cloud
Schneider Electric SE – EcoStruxure IT
SAP SE – SAP Environment, Health, and Safety Management
Johnson Controls – Metasys Building Automation System
Enablon SA – Enablon Sustainability Management Software
Cority Software Inc. – Cority Environmental Management Software
Dakota Software Corp. – Dakota EHS Management Software
Enviance Inc. – Enviance Environmental Data Management
Green Step Solutions – Green IT Auditing Services
Green IT Consulting – Sustainable IT Infrastructure Solutions
Recent Developments
In December 2024, AirTrunk unveiled a 1-megawatt rooftop solar system at its Malaysian data center in Johor Bahru, marking its inaugural renewable energy initiative in the region.
In December 2024, Dell reported significant revenue growth in its Infrastructure Solutions Group, attributed to its AI-focused efforts and the integration of energy-efficient technologies within its product suite, the Dell AI Factory.
| Report Attributes | Details |
| Market Size in 2023 | USD 18.8 Billion |
| Market Size by 2032 | USD 69.4 Billion |
| CAGR | CAGR of 15.65% From 2024 to 2032 |
| Base Year | 2023 |
| Forecast Period | 2024-2032 |
| Historical Data | 2020-2022 |
| Report Scope & Coverage | Market Size, Segments Analysis, Competitive Landscape, Regional Analysis, DROC & SWOT Analysis, Forecast Outlook |
| Key Segments | • By Type (Software, Services) • BY Deployment (Cloud, On-premises) • By End-Use (IT & Telecommunications, BFSI, Healthcare & Life Sciences, Manufacturing, Retail, Government & Public Sectors, Energy & Utilities, Others) |
| Regional Analysis/Coverage | North America (US, Canada, Mexico), Europe (Eastern Europe [Poland, Romania, Hungary, Turkey, Rest of Eastern Europe] Western Europe] Germany, France, UK, Italy, Spain, Netherlands, Switzerland, Austria, Rest of Western Europe]), Asia Pacific (China, India, Japan, South Korea, Vietnam, Singapore, Australia, Rest of Asia Pacific), Middle East & Africa (Middle East [UAE, Egypt, Saudi Arabia, Qatar, Rest of Middle East], Africa [Nigeria, South Africa, Rest of Africa], Latin America (Brazil, Argentina, Colombia, Rest of Latin America) |
| Company Profiles | IBM Corporation, Hewlett Packard Enterprise (HPE), Dell Technologies, Cisco Systems, Inc., Microsoft Corporation, Accenture PLC, Schneider Electric SE, SAP SE, Johnson Controls, Enablon SA, Cority Software Inc., Dakota Software Corp., Enviance Inc., Green Step Solutions, Green IT Consulting |
Ans - The Green IT Services Market was valued at USD 18.8 Billion in 2023 and is expected to reach USD 69.4 Billion by 2032
Ans- The CAGR of the Green IT Services Market during the forecast period is 15.65% from 2024-2032.
Ans- Asia-Pacific is expected to register the fastest CAGR during the forecast period.
Ans- Stringent global fire safety regulations require industries and commercial spaces to adopt advanced fire detection systems to ensure compliance and safety.
Ans- The absence of global Green IT standards and limited awareness hinder widespread adoption across industries.
Table of Content
1. Introduction
1.1 Market Definition
1.2 Scope (Inclusion and Exclusions)
1.3 Research Assumptions
2. Executive Summary
2.1 Market Overview
2.2 Regional Synopsis
2.3 Competitive Summary
3. Research Methodology
3.1 Top-Down Approach
3.2 Bottom-up Approach
3.3. Data Validation
3.4 Primary Interviews
4. Market Dynamics Impact Analysis
4.1 Market Driving Factors Analysis
4.1.1 Drivers
4.1.2 Restraints
4.1.3 Opportunities
4.1.4 Challenges
4.2 PESTLE Analysis
4.3 Porter’s Five Forces Model
5. Statistical Insights and Trends Reporting
5.1 Adoption Rates of Emerging Technologies
5.2 Network Infrastructure Expansion, by Region
5.3 Cybersecurity Incidents, by Region (2020-2023)
5.4 Cloud Services Usage, by Region
6. Competitive Landscape
6.1 List of Major Companies, By Region
6.2 Market Share Analysis, By Region
6.3 Product Benchmarking
6.3.1 Product specifications and features
6.3.2 Pricing
6.4 Strategic Initiatives
6.4.1 Marketing and promotional activities
6.4.2 Distribution and supply chain strategies
6.4.3 Expansion plans and new product launches
6.4.4 Strategic partnerships and collaborations
6.5 Technological Advancements
6.6 Market Positioning and Branding
7. Green IT Services Market Segmentation, By Type
7.1 Chapter Overview
7.2 Software
7.2.1 Software Market Trends Analysis (2020-2032)
7.2.2 Software Market Size Estimates and Forecasts to 2032 (USD Billion)
7.3 Services
7.3.1 Services Market Trends Analysis (2020-2032)
7.3.2 Services Market Size Estimates and Forecasts to 2032 (USD Billion)
8. Green IT Services Market Segmentation, by Deployment
8.1 Chapter Overview
8.2 Cloud
8.2.1 Cloud Market Trends Analysis (2020-2032)
8.2.2 Cloud Market Size Estimates and Forecasts to 2032 (USD Billion)
8.3 On-premises
8.3.1 On-premises Market Trends Analysis (2020-2032)
8.3.2 On-premises Market Size Estimates and Forecasts to 2032 (USD Billion)
9. Green IT Services Market Segmentation, by End-User
9.1 Chapter Overview
9.2 BFSI
9.2.1 BFSI Market Trends Analysis (2020-2032)
9.2.2 BFSI Market Size Estimates and Forecasts to 2032 (USD Billion)
9.3 IT & Telecommunications
9.3.1 IT & Telecommunications Market Trends Analysis (2020-2032)
9.3.2 IT & Telecommunications Market Size Estimates and Forecasts to 2032 (USD Billion)
9.4 Healthcare & Life Sciences
9.4.1 Healthcare & Life Sciences Market Trends Analysis (2020-2032)
9.4.2 Healthcare & Life Sciences Market Size Estimates and Forecasts to 2032 (USD Billion)
9.5 Manufacturing
9.5.1Manufacturing Market Trends Analysis (2020-2032)
9.5.2Manufacturing Market Size Estimates and Forecasts to 2032 (USD Billion)
9.6 Retail
9.6.1Retail Market Trends Analysis (2020-2032)
9.6.2Retail Market Size Estimates and Forecasts to 2032 (USD Billion)
9.7 Government & Public Sectors
9.7.1Government & Public Sectors Market Trends Analysis (2020-2032)
9.7.2Government & Public Sectors Market Size Estimates and Forecasts to 2032 (USD Billion)
9.8Energy & Utilities
9.8.1Energy & Utilities Market Trends Analysis (2020-2032)
9.8.2Energy & Utilities Market Size Estimates and Forecasts to 2032 (USD Billion)
9.9 Others
9.9.1Others Market Trends Analysis (2020-2032)
9.9.2Others Market Size Estimates and Forecasts to 2032 (USD Billion)
9.10 Others
9.10.1Others Market Trends Analysis (2020-2032)
9.10.2Others Market Size Estimates and Forecasts to 2032 (USD Billion)
10. Regional Analysis
10.1 Chapter Overview
10.2 North America
10.2.1 Trends Analysis
10.2.2 North America Green IT Services Market Estimates and Forecasts, by Country (2020-2032) (USD Billion)
10.2.3 North America Green IT Services Market Estimates and Forecasts, By Type (2020-2032) (USD Billion)
10.2.4 North America Green IT Services Market Estimates and Forecasts, by Deployment (2020-2032) (USD Billion)
10.2.5 North America Green IT Services Market Estimates and Forecasts, by End-User (2020-2032) (USD Billion)
10.2.6 USA
10.2.6.1 USA Green IT Services Market Estimates and Forecasts, By Type (2020-2032) (USD Billion)
10.2.6.2 USA Green IT Services Market Estimates and Forecasts, by Deployment (2020-2032) (USD Billion)
10.2.6.3 USA Green IT Services Market Estimates and Forecasts, by End-User (2020-2032) (USD Billion)
10.2.7 Canada
10.2.7.1 Canada Green IT Services Market Estimates and Forecasts, By Type (2020-2032) (USD Billion)
10.2.7.2 Canada Green IT Services Market Estimates and Forecasts, by Deployment (2020-2032) (USD Billion)
10.2.7.3 Canada Green IT Services Market Estimates and Forecasts, by End-User (2020-2032) (USD Billion)
10.2.8 Mexico
10.2.8.1 Mexico Green IT Services Market Estimates and Forecasts, By Type (2020-2032) (USD Billion)
10.2.8.2 Mexico Green IT Services Market Estimates and Forecasts, by Deployment (2020-2032) (USD Billion)
10.2.8.3 Mexico Green IT Services Market Estimates and Forecasts, by End-User (2020-2032) (USD Billion)
10.3 Europe
10.3.1 Eastern Europe
10.3.1.1 Trends Analysis
10.3.1.2 Eastern Europe Green IT Services Market Estimates and Forecasts, by Country (2020-2032) (USD Billion)
10.3.1.3 Eastern Europe Green IT Services Market Estimates and Forecasts, By Type (2020-2032) (USD Billion)
10.3.1.4 Eastern Europe Green IT Services Market Estimates and Forecasts, by Deployment (2020-2032) (USD Billion)
10.3.1.5 Eastern Europe Green IT Services Market Estimates and Forecasts, by End-User (2020-2032) (USD Billion)
10.3.1.6 Poland
10.3.1.6.1 Poland Green IT Services Market Estimates and Forecasts, By Type (2020-2032) (USD Billion)
10.3.1.6.2 Poland Green IT Services Market Estimates and Forecasts, by Deployment (2020-2032) (USD Billion)
10.3.1.6.3 Poland Green IT Services Market Estimates and Forecasts, by End-User (2020-2032) (USD Billion)
10.3.1.7 Romania
10.3.1.7.1 Romania Green IT Services Market Estimates and Forecasts, By Type (2020-2032) (USD Billion)
10.3.1.7.2 Romania Green IT Services Market Estimates and Forecasts, by Deployment (2020-2032) (USD Billion)
10.3.1.7.3 Romania Green IT Services Market Estimates and Forecasts, by End-User (2020-2032) (USD Billion)
10.3.1.8 Hungary
10.3.1.8.1 Hungary Green IT Services Market Estimates and Forecasts, By Type (2020-2032) (USD Billion)
10.3.1.8.2 Hungary Green IT Services Market Estimates and Forecasts, by Deployment (2020-2032) (USD Billion)
10.3.1.8.3 Hungary Green IT Services Market Estimates and Forecasts, by End-User (2020-2032) (USD Billion)
10.3.1.9 Turkey
10.3.1.9.1 Turkey Green IT Services Market Estimates and Forecasts, By Type (2020-2032) (USD Billion)
10.3.1.9.2 Turkey Green IT Services Market Estimates and Forecasts, by Deployment (2020-2032) (USD Billion)
10.3.1.9.3 Turkey Green IT Services Market Estimates and Forecasts, by End-User (2020-2032) (USD Billion)
10.3.1.10 Rest of Eastern Europe
10.3.1.10.1 Rest of Eastern Europe Green IT Services Market Estimates and Forecasts, By Type (2020-2032) (USD Billion)
10.3.1.10.2 Rest of Eastern Europe Green IT Services Market Estimates and Forecasts, by Deployment (2020-2032) (USD Billion)
10.3.1.10.3 Rest of Eastern Europe Green IT Services Market Estimates and Forecasts, by End-User (2020-2032) (USD Billion)
10.3.2 Western Europe
10.3.2.1 Trends Analysis
10.3.2.2 Western Europe Green IT Services Market Estimates and Forecasts, by Country (2020-2032) (USD Billion)
10.3.2.3 Western Europe Green IT Services Market Estimates and Forecasts, By Type (2020-2032) (USD Billion)
10.3.2.4 Western Europe Green IT Services Market Estimates and Forecasts, by Deployment (2020-2032) (USD Billion)
10.3.2.5 Western Europe Green IT Services Market Estimates and Forecasts, by End-User (2020-2032) (USD Billion)
10.3.2.6 Germany
10.3.2.6.1 Germany Green IT Services Market Estimates and Forecasts, By Type (2020-2032) (USD Billion)
10.3.2.6.2 Germany Green IT Services Market Estimates and Forecasts, by Deployment (2020-2032) (USD Billion)
10.3.2.6.3 Germany Green IT Services Market Estimates and Forecasts, by End-User (2020-2032) (USD Billion)
10.3.2.7 France
10.3.2.7.1 France Green IT Services Market Estimates and Forecasts, By Type (2020-2032) (USD Billion)
10.3.2.7.2 France Green IT Services Market Estimates and Forecasts, by Deployment (2020-2032) (USD Billion)
10.3.2.7.3 France Green IT Services Market Estimates and Forecasts, by End-User (2020-2032) (USD Billion)
10.3.2.8 UK
10.3.2.8.1 UK Green IT Services Market Estimates and Forecasts, By Type (2020-2032) (USD Billion)
10.3.2.8.2 UK Green IT Services Market Estimates and Forecasts, by Deployment (2020-2032) (USD Billion)
10.3.2.8.3 UK Green IT Services Market Estimates and Forecasts, by End-User (2020-2032) (USD Billion)
10.3.2.9 Italy
10.3.2.9.1 Italy Green IT Services Market Estimates and Forecasts, By Type (2020-2032) (USD Billion)
10.3.2.9.2 Italy Green IT Services Market Estimates and Forecasts, by Deployment (2020-2032) (USD Billion)
10.3.2.9.3 Italy Green IT Services Market Estimates and Forecasts, by End-User (2020-2032) (USD Billion)
10.3.2.10 Spain
10.3.2.10.1 Spain Green IT Services Market Estimates and Forecasts, By Type (2020-2032) (USD Billion)
10.3.2.10.2 Spain Green IT Services Market Estimates and Forecasts, by Deployment (2020-2032) (USD Billion)
10.3.2.10.3 Spain Green IT Services Market Estimates and Forecasts, by End-User (2020-2032) (USD Billion)
10.3.2.11 Netherlands
10.3.2.11.1 Netherlands Green IT Services Market Estimates and Forecasts, By Type (2020-2032) (USD Billion)
10.3.2.11.2 Netherlands Green IT Services Market Estimates and Forecasts, by Deployment (2020-2032) (USD Billion)
10.3.2.11.3 Netherlands Green IT Services Market Estimates and Forecasts, by End-User (2020-2032) (USD Billion)
10.3.2.12 Switzerland
10.3.2.12.1 Switzerland Green IT Services Market Estimates and Forecasts, By Type (2020-2032) (USD Billion)
10.3.2.12.2 Switzerland Green IT Services Market Estimates and Forecasts, by Deployment (2020-2032) (USD Billion)
10.3.2.12.3 Switzerland Green IT Services Market Estimates and Forecasts, by End-User (2020-2032) (USD Billion)
10.3.2.13 Austria
10.3.2.13.1 Austria Green IT Services Market Estimates and Forecasts, By Type (2020-2032) (USD Billion)
10.3.2.13.2 Austria Green IT Services Market Estimates and Forecasts, by Deployment (2020-2032) (USD Billion)
10.3.2.13.3 Austria Green IT Services Market Estimates and Forecasts, by End-User (2020-2032) (USD Billion)
10.3.2.14 Rest of Western Europe
10.3.2.14.1 Rest of Western Europe Green IT Services Market Estimates and Forecasts, By Type (2020-2032) (USD Billion)
10.3.2.14.2 Rest of Western Europe Green IT Services Market Estimates and Forecasts, by Deployment (2020-2032) (USD Billion)
10.3.2.14.3 Rest of Western Europe Green IT Services Market Estimates and Forecasts, by End-User (2020-2032) (USD Billion)
10.4 Asia Pacific
10.4.1 Trends Analysis
10.4.2 Asia Pacific Green IT Services Market Estimates and Forecasts, by Country (2020-2032) (USD Billion)
10.4.3 Asia Pacific Green IT Services Market Estimates and Forecasts, By Type (2020-2032) (USD Billion)
10.4.4 Asia Pacific Green IT Services Market Estimates and Forecasts, by Deployment (2020-2032) (USD Billion)
10.4.5 Asia Pacific Green IT Services Market Estimates and Forecasts, by End-User (2020-2032) (USD Billion)
10.4.6 China
10.4.6.1 China Green IT Services Market Estimates and Forecasts, By Type (2020-2032) (USD Billion)
10.4.6.2 China Green IT Services Market Estimates and Forecasts, by Deployment (2020-2032) (USD Billion)
10.4.6.3 China Green IT Services Market Estimates and Forecasts, by End-User (2020-2032) (USD Billion)
10.4.7 India
10.4.7.1 India Green IT Services Market Estimates and Forecasts, By Type (2020-2032) (USD Billion)
10.4.7.2 India Green IT Services Market Estimates and Forecasts, by Deployment (2020-2032) (USD Billion)
10.4.7.3 India Green IT Services Market Estimates and Forecasts, by End-User (2020-2032) (USD Billion)
10.4.8 Japan
10.4.8.1 Japan Green IT Services Market Estimates and Forecasts, By Type (2020-2032) (USD Billion)
10.4.8.2 Japan Green IT Services Market Estimates and Forecasts, by Deployment (2020-2032) (USD Billion)
10.4.8.3 Japan Green IT Services Market Estimates and Forecasts, by End-User (2020-2032) (USD Billion)
10.4.9 South Korea
10.4.9.1 South Korea Green IT Services Market Estimates and Forecasts, By Type (2020-2032) (USD Billion)
10.4.9.2 South Korea Green IT Services Market Estimates and Forecasts, by Deployment (2020-2032) (USD Billion)
10.4.9.3 South Korea Green IT Services Market Estimates and Forecasts, by End-User (2020-2032) (USD Billion)
10.4.10 Vietnam
10.4.10.1 Vietnam Green IT Services Market Estimates and Forecasts, By Type (2020-2032) (USD Billion)
10.4.10.2 Vietnam Green IT Services Market Estimates and Forecasts, by Deployment (2020-2032) (USD Billion)
10.4.10.3 Vietnam Green IT Services Market Estimates and Forecasts, by End-User (2020-2032) (USD Billion)
10.4.11 Singapore
10.4.11.1 Singapore Green IT Services Market Estimates and Forecasts, By Type (2020-2032) (USD Billion)
10.4.11.2 Singapore Green IT Services Market Estimates and Forecasts, by Deployment (2020-2032) (USD Billion)
10.4.11.3 Singapore Green IT Services Market Estimates and Forecasts, by End-User (2020-2032) (USD Billion)
10.4.12 Australia
10.4.12.1 Australia Green IT Services Market Estimates and Forecasts, By Type (2020-2032) (USD Billion)
10.4.12.2 Australia Green IT Services Market Estimates and Forecasts, by Deployment (2020-2032) (USD Billion)
10.4.12.3 Australia Green IT Services Market Estimates and Forecasts, by End-User (2020-2032) (USD Billion)
10.4.13 Rest of Asia Pacific
10.4.13.1 Rest of Asia Pacific Green IT Services Market Estimates and Forecasts, By Type (2020-2032) (USD Billion)
10.4.13.2 Rest of Asia Pacific Green IT Services Market Estimates and Forecasts, by Deployment (2020-2032) (USD Billion)
10.4.13.3 Rest of Asia Pacific Green IT Services Market Estimates and Forecasts, by End-User (2020-2032) (USD Billion)
10.5 Middle East and Africa
10.5.1 Middle East
10.5.1.1 Trends Analysis
10.5.1.2 Middle East Green IT Services Market Estimates and Forecasts, by Country (2020-2032) (USD Billion)
10.5.1.3 Middle East Green IT Services Market Estimates and Forecasts, By Type (2020-2032) (USD Billion)
10.5.1.4 Middle East Green IT Services Market Estimates and Forecasts, by Deployment (2020-2032) (USD Billion)
10.5.1.5 Middle East Green IT Services Market Estimates and Forecasts, by End-User (2020-2032) (USD Billion)
10.5.1.6 UAE
10.5.1.6.1 UAE Green IT Services Market Estimates and Forecasts, By Type (2020-2032) (USD Billion)
10.5.1.6.2 UAE Green IT Services Market Estimates and Forecasts, by Deployment (2020-2032) (USD Billion)
10.5.1.6.3 UAE Green IT Services Market Estimates and Forecasts, by End-User (2020-2032) (USD Billion)
10.5.1.7 Egypt
10.5.1.7.1 Egypt Green IT Services Market Estimates and Forecasts, By Type (2020-2032) (USD Billion)
10.5.1.7.2 Egypt Green IT Services Market Estimates and Forecasts, by Deployment (2020-2032) (USD Billion)
10.5.1.7.3 Egypt Green IT Services Market Estimates and Forecasts, by End-User (2020-2032) (USD Billion)
10.5.1.8 Saudi Arabia
10.5.1.8.1 Saudi Arabia Green IT Services Market Estimates and Forecasts, By Type (2020-2032) (USD Billion)
10.5.1.8.2 Saudi Arabia Green IT Services Market Estimates and Forecasts, by Deployment (2020-2032) (USD Billion)
10.5.1.8.3 Saudi Arabia Green IT Services Market Estimates and Forecasts, by End-User (2020-2032) (USD Billion)
10.5.1.9 Qatar
10.5.1.9.1 Qatar Green IT Services Market Estimates and Forecasts, By Type (2020-2032) (USD Billion)
10.5.1.9.2 Qatar Green IT Services Market Estimates and Forecasts, by Deployment (2020-2032) (USD Billion)
10.5.1.9.3 Qatar Green IT Services Market Estimates and Forecasts, by End-User (2020-2032) (USD Billion)
10.5.1.10 Rest of Middle East
10.5.1.10.1 Rest of Middle East Green IT Services Market Estimates and Forecasts, By Type (2020-2032) (USD Billion)
10.5.1.10.2 Rest of Middle East Green IT Services Market Estimates and Forecasts, by Deployment (2020-2032) (USD Billion)
10.5.1.10.3 Rest of Middle East Green IT Services Market Estimates and Forecasts, by End-User (2020-2032) (USD Billion)
10.5.2 Africa
10.5.2.1 Trends Analysis
10.5.2.2 Africa Green IT Services Market Estimates and Forecasts, by Country (2020-2032) (USD Billion)
10.5.2.3 Africa Green IT Services Market Estimates and Forecasts, By Type (2020-2032) (USD Billion)
10.5.2.4 Africa Green IT Services Market Estimates and Forecasts, by Deployment (2020-2032) (USD Billion)
10.5.2.5 Africa Green IT Services Market Estimates and Forecasts, by End-User (2020-2032) (USD Billion)
10.5.2.6 South Africa
10.5.2.6.1 South Africa Green IT Services Market Estimates and Forecasts, By Type (2020-2032) (USD Billion)
10.5.2.6.2 South Africa Green IT Services Market Estimates and Forecasts, by Deployment (2020-2032) (USD Billion)
10.5.2.6.3 South Africa Green IT Services Market Estimates and Forecasts, by End-User (2020-2032) (USD Billion)
10.5.2.7 Nigeria
10.5.2.7.1 Nigeria Green IT Services Market Estimates and Forecasts, By Type (2020-2032) (USD Billion)
10.5.2.7.2 Nigeria Green IT Services Market Estimates and Forecasts, by Deployment (2020-2032) (USD Billion)
10.5.2.7.3 Nigeria Green IT Services Market Estimates and Forecasts, by End-User (2020-2032) (USD Billion)
10.5.2.8 Rest of Africa
10.5.2.8.1 Rest of Africa Green IT Services Market Estimates and Forecasts, By Type (2020-2032) (USD Billion)
10.5.2.8.2 Rest of Africa Green IT Services Market Estimates and Forecasts, by Deployment (2020-2032) (USD Billion)
10.5.2.8.3 Rest of Africa Green IT Services Market Estimates and Forecasts, by End-User (2020-2032) (USD Billion)
10.6 Latin America
10.6.1 Trends Analysis
10.6.2 Latin America Green IT Services Market Estimates and Forecasts, by Country (2020-2032) (USD Billion)
10.6.3 Latin America Green IT Services Market Estimates and Forecasts, By Type (2020-2032) (USD Billion)
10.6.4 Latin America Green IT Services Market Estimates and Forecasts, by Deployment (2020-2032) (USD Billion)
10.6.5 Latin America Green IT Services Market Estimates and Forecasts, by End-User (2020-2032) (USD Billion)
10.6.6 Brazil
10.6.6.1 Brazil Green IT Services Market Estimates and Forecasts, By Type (2020-2032) (USD Billion)
10.6.6.2 Brazil Green IT Services Market Estimates and Forecasts, by Deployment (2020-2032) (USD Billion)
10.6.6.3 Brazil Green IT Services Market Estimates and Forecasts, by End-User (2020-2032) (USD Billion)
10.6.7 Argentina
10.6.7.1 Argentina Green IT Services Market Estimates and Forecasts, By Type (2020-2032) (USD Billion)
10.6.7.2 Argentina Green IT Services Market Estimates and Forecasts, by Deployment (2020-2032) (USD Billion)
10.6.7.3 Argentina Green IT Services Market Estimates and Forecasts, by End-User (2020-2032) (USD Billion)
10.6.8 Colombia
10.6.8.1 Colombia Green IT Services Market Estimates and Forecasts, By Type (2020-2032) (USD Billion)
10.6.8.2 Colombia Green IT Services Market Estimates and Forecasts, by Deployment (2020-2032) (USD Billion)
10.6.8.3 Colombia Green IT Services Market Estimates and Forecasts, by End-User (2020-2032) (USD Billion)
10.6.9 Rest of Latin America
10.6.9.1 Rest of Latin America Green IT Services Market Estimates and Forecasts, By Type (2020-2032) (USD Billion)
10.6.9.2 Rest of Latin America Green IT Services Market Estimates and Forecasts, by Deployment (2020-2032) (USD Billion)
10.6.9.3 Rest of Latin America Green IT Services Market Estimates and Forecasts, by End-User (2020-2032) (USD Billion)
11. Company Profiles
11.1 IBM Corporation
11.1.1 Company Overview
11.1.2 Financial
11.1.3 Products/ Services Offered
11.1.4 SWOT Analysis
11.2 Hewlett Packard Enterprise (HPE)
11.2.1 Company Overview
11.2.2 Financial
11.2.3 Products/ Services Offered
11.2.4 SWOT Analysis
11.3 Dell Technologies
11.3.1 Company Overview
11.3.2 Financial
11.3.3 Products/ Services Offered
11.3.4 SWOT Analysis
11.4 Cisco Systems, Inc.
11.4.1 Company Overview
11.4.2 Financial
11.4.3 Products/ Services Offered
11.4.4 SWOT Analysis
11.5 Microsoft Corporation
11.5.1 Company Overview
11.5.2 Financial
11.5.3 Products/ Services Offered
11.5.4 SWOT Analysis
11.6 Accenture PLC
11.6.1 Company Overview
11.6.2 Financial
11.6.3 Products/ Services Offered
11.6.4 SWOT Analysis
11.7 Schneider Electric SE
11.7.1 Company Overview
11.7.2 Financial
11.7.3 Products/ Services Offered
11.7.4 SWOT Analysis
11.8 SAP SE
11.8.1 Company Overview
11.8.2 Financial
11.8.3 Products/ Services Offered
11.8.4 SWOT Analysis
11.9 Johnson Controls
11.9.1 Company Overview
11.9.2 Financial
11.9.3 Products/ Services Offered
11.9.4 SWOT Analysis
11.10 Enablon SA
11.10.1 Company Overview
11.10.2 Financial
11.10.3 Products/ Services Offered
11.10.4 SWOT Analysis
12. Use Cases and Best Practices
13. Conclusion
An accurate research report requires proper strategizing as well as implementation. There are multiple factors involved in the completion of good and accurate research report and selecting the best methodology to compete the research is the toughest part. Since the research reports we provide play a crucial role in any company’s decision-making process, therefore we at SNS Insider always believe that we should choose the best method which gives us results closer to reality. This allows us to reach at a stage wherein we can provide our clients best and accurate investment to output ratio.
Each report that we prepare takes a timeframe of 350-400 business hours for production. Starting from the selection of titles through a couple of in-depth brain storming session to the final QC process before uploading our titles on our website we dedicate around 350 working hours. The titles are selected based on their current market cap and the foreseen CAGR and growth.
The 5 steps process:
Step 1: Secondary Research:
Secondary Research or Desk Research is as the name suggests is a research process wherein, we collect data through the readily available information. In this process we use various paid and unpaid databases which our team has access to and gather data through the same. This includes examining of listed companies’ annual reports, Journals, SEC filling etc. Apart from this our team has access to various associations across the globe across different industries. Lastly, we have exchange relationships with various university as well as individual libraries.

Step 2: Primary Research
When we talk about primary research, it is a type of study in which the researchers collect relevant data samples directly, rather than relying on previously collected data. This type of research is focused on gaining content specific facts that can be sued to solve specific problems. Since the collected data is fresh and first hand therefore it makes the study more accurate and genuine.
We at SNS Insider have divided Primary Research into 2 parts.
Part 1 wherein we interview the KOLs of major players as well as the upcoming ones across various geographic regions. This allows us to have their view over the market scenario and acts as an important tool to come closer to the accurate market numbers. As many as 45 paid and unpaid primary interviews are taken from both the demand and supply side of the industry to make sure we land at an accurate judgement and analysis of the market.
This step involves the triangulation of data wherein our team analyses the interview transcripts, online survey responses and observation of on filed participants. The below mentioned chart should give a better understanding of the part 1 of the primary interview.

Part 2: In this part of primary research the data collected via secondary research and the part 1 of the primary research is validated with the interviews from individual consultants and subject matter experts.
Consultants are those set of people who have at least 12 years of experience and expertise within the industry whereas Subject Matter Experts are those with at least 15 years of experience behind their back within the same space. The data with the help of two main processes i.e., FGDs (Focused Group Discussions) and IDs (Individual Discussions). This gives us a 3rd party nonbiased primary view of the market scenario making it a more dependable one while collation of the data pointers.
Step 3: Data Bank Validation
Once all the information is collected via primary and secondary sources, we run that information for data validation. At our intelligence centre our research heads track a lot of information related to the market which includes the quarterly reports, the daily stock prices, and other relevant information. Our data bank server gets updated every fortnight and that is how the information which we collected using our primary and secondary information is revalidated in real time.

Step 4: QA/QC Process
After all the data collection and validation our team does a final level of quality check and quality assurance to get rid of any unwanted or undesired mistakes. This might include but not limited to getting rid of the any typos, duplication of numbers or missing of any important information. The people involved in this process include technical content writers, research heads and graphics people. Once this process is completed the title gets uploader on our platform for our clients to read it.
Step 5: Final QC/QA Process:
This is the last process and comes when the client has ordered the study. In this process a final QA/QC is done before the study is emailed to the client. Since we believe in giving our clients a good experience of our research studies, therefore, to make sure that we do not lack at our end in any way humanly possible we do a final round of quality check and then dispatch the study to the client.
Key Segments:
By Type
Software
Services
BY Deployment
Cloud
On-premises
By End-Use
IT & Telecommunications
BFSI
Healthcare & Life Sciences
Manufacturing
Retail
Government & Public Sectors
Energy & Utilities
Others
Request for Segment Customization as per your Business Requirement: Segment Customization Request
Regional Coverage:
North America
US
Canada
Mexico
Europe
Eastern Europe
Poland
Romania
Hungary
Turkey
Rest of Eastern Europe
Western Europe
Germany
France
UK
Italy
Spain
Netherlands
Switzerland
Austria
Rest of Western Europe
Asia Pacific
China
India
Japan
South Korea
Vietnam
Singapore
Australia
Rest of Asia Pacific
Middle East & Africa
Middle East
UAE
Egypt
Saudi Arabia
Qatar
Rest of Middle East
Africa
Nigeria
South Africa
Rest of Africa
Latin America
Brazil
Argentina
Colombia
Rest of Latin America
Request for Country Level Research Report: Country Level Customization Request
Available Customization
With the given market data, SNS Insider offers customization as per the company’s specific needs. The following customization options are available for the report:
Detailed Volume Analysis
Criss-Cross segment analysis (e.g. Product X Application)
Competitive Product Benchmarking
Geographic Analysis
Additional countries in any of the regions
Customized Data Representation
Detailed analysis and profiling of additional market players
Finance and Accounting Business Process Outsourcing Market size was valued at USD 60.93 Billion in 2023. It is expected to Reach USD 134.65 Billion by 2032 and grow at a CAGR of 9.22% over the forecast period of 2024-2032.
The E-Invoicing Market size was valued at USD 12.7 Billion in 2023. It is expected to Reach USD 63.93 Billion by 2032 and grow at a CAGR of 19.69% over the forecast period of 2024-2032.
AI In Chemicals Market was valued at USD 651.65 million in 2023 and is expected to reach USD 10257.62 million by 2032, growing at a CAGR of 35.89% by 2032
Application Modernization Services Market was valued at USD 17.49 billion in 2023 and will reach USD 67.87 billion by 2032, growing at a CAGR of 16.32% by 2032.
IoT Analytics Market was valued at USD 26.90 billion in 2023 and is expected to reach USD 180.36 billion by 2032, growing at a CAGR of 23.60% by 2032.
The Home Automation Market size was estimated at USD 95.87 Billion in 2023 and will reach USD 249.26 Billion by 2032 at a CAGR of 11.26% by 2024-2032.

Hi! Click one of our member below to chat on Phone
© 2025 All Rights Reserved by SNS Insider Pvt Ltd


