Get More Information on Green Hydrogen Market - Request Sample Report
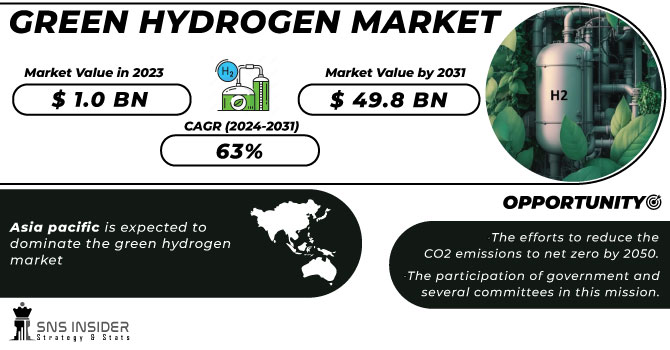
The Green Hydrogen Market was USD 6.6 billion in 2023 and is expected to reach USD 133.50 billion by 2032, growing at a CAGR of 39.6% over the forecast period of 2024-2032.
The increasing demand for mobility and industry is driving the green hydrogen market. Hydrogen fuel cells are emerging in mobility as a clean replacement technology to fossil fuel use, which is of particular relevance for heavy-duty vehicles such as buses, trucks, and trains. Hydrogen outperforms battery-electric solutions in terms of energy density and refueling speed, which are important for these types of vehicles. Germany is already running hydrogen-powered trains, and many governments are working to promote buses based on hydrogen fuel cells to help reduce urban emission levels. Similarly, among industrial applications, green hydrogen is being increasingly used for decarbonizing processes with high energy consumption, such as ammonia, steel, and oil refining. Green hydrogen is, for example, being utilized instead of coal in Direct Reduced Iron (DRI) processes in steelmaking, which represent a key enabler to decarbonize the steelmaking sector and achieve net-zero emissions. Driven by government incentives and technology improvements, this need in both sectors is beginning to drive green hydrogen into the global supply chain.
Governments are promoting the use of green hydrogen to decarbonize hard-to-abate industrial sectors. For example, the U.S. Government Accountability Office (GAO) highlights hydrogen's potential in reducing greenhouse gas emissions in steel manufacturing and power generation.
Decarbonization of energy systems is a key factor driving the adoption of green hydrogen globally. As countries strive to achieve their net-zero emissions targets, green hydrogen offers a sustainable solution to replace fossil fuels in energy-intensive sectors. It serves as a clean energy carrier, enabling the storage and transport of renewable energy from sources like solar and wind. This capability addresses the intermittency challenges of renewables and supports grid stability. Furthermore, green hydrogen is pivotal in reducing carbon emissions in hard-to-abate sectors such as steel, cement, and chemicals, where electrification is less viable. For example, hydrogen can be used in steel manufacturing to replace coking coal in Direct Reduced Iron (DRI) processes, significantly lowering CO2 emissions. Governments worldwide are setting ambitious targets and providing subsidies to promote green hydrogen projects. For instance, the European Union aims to produce 10 million tons of green hydrogen annually by 2030 under its Hydrogen Strategy. Such initiatives, combined with technological advancements and declining costs of renewables, are accelerating the transition to low-carbon energy systems.
Drivers
Rising Demand in hard-to-abate sectors drives market growth.
The rising demand for green hydrogen in hard-to-abate sectors is a major driver of market growth, as these industries face significant challenges in reducing their carbon emissions. Sectors such as steel, cement, and chemicals rely heavily on fossil fuels for energy-intensive processes, making traditional decarbonization methods insufficient. Green hydrogen offers a viable solution by acting as a clean energy source to replace coal, natural gas, and other carbon-heavy inputs. For instance, in steel manufacturing, green hydrogen is increasingly being used in Direct Reduced Iron (DRI) processes to replace coking coal, leading to a significant reduction in CO2 emissions. Similarly, in the chemical industry, green hydrogen is critical for producing ammonia and methanol sustainably. Governments and industries are prioritizing these applications, supported by incentives and funding to scale up adoption. For example, the European Commission has highlighted green hydrogen as essential to decarbonize energy-intensive industries under its "Fit for 55" package. This growing focus on hard-to-abate sectors not only drives innovation but also accelerates the global transition toward net-zero emissions.
The International Energy Agency (IEA) reports that, as of 2023, global hydrogen demand reached 97 million tons, with a significant portion utilized in the chemical sector. This underscores the critical role of hydrogen in chemical processes and the potential impact of green hydrogen adoption.
Restraint
Several energy losses during the process of hydrogen creation which may hamper the market growth.
One of the key challenges hindering the growth of the green hydrogen market is the energy losses that occur during the hydrogen production process, particularly when using renewable energy sources like wind and solar. Hydrogen is typically produced through water electrolysis; a process where electricity splits water molecules into hydrogen and oxygen. However, this process is not 100% efficient; energy is lost at various stages, including during the conversion of electricity into hydrogen. The efficiency of electrolyzers, which can range from 60% to 80%, means that a significant portion of the renewable energy is lost during the process. Additionally, further energy losses can occur when hydrogen is stored, transported, and converted back into usable energy, such as in fuel cells or power plants. These inefficiencies increase the overall cost of green hydrogen production, making it less competitive compared to other energy sources like natural gas or coal. This issue is particularly concerning as the green hydrogen market strives for cost parity with traditional fuels, and continued energy losses could slow down large-scale adoption unless technological advancements in electrolysis efficiency and energy storage systems can overcome these barriers.
Opportunities
The efforts to reduce the CO2 emissions to net zero by 2050.
The participation of government and several committees in this mission.
Market segmentation
By Technology
Electrolyzers held the largest revenue share 68% in 2023. It is owing to an indispensable role in the generation of hydrogen via water electrolysis. Electrolyzers are the main technology for green hydrogen production since they utilize electricity, which is generally from renewable sources, and break the water molecules into hydrogen and oxygen. Electrolyzers have an important role in green hydrogen demand, especially in mobility, industry, and energy storage sectors. Demand for clean hydrogen needed to decarbonize hard-to-abate value chains including steel, cement, and chemicals has increasingly driven the uptake of electrolyzers. In addition, the efficiency of electrolyzers is being improved and the cost is dropping, making it commercially competitive.
By Distribution Channel
Pipeline held a significant revenue share of around 62% in 2023. This is owing to their critical role in efficiently transporting hydrogen across large distances from sources of production to end-users. With the growing demand for green hydrogen, the immediate focus will be on its bulk movement since most of the large-scale industrial applications and fuel-cell vehicles play a crucial role in the development of efficient, safe, and cost-effective hydrogen transportation infrastructure. Hydrogen pipelines are the most trustable and most cost-effective way to transport hydrogen at scale given that they provide a continuous flow of hydrogen and are generally cheaper than alternatives such as trucks or shipping for large amounts. Apart from this, the rising investments in hydrogen infrastructure, such as dedicated hydrogen transportation networks, have also bolstered revenue earned from the pipelines.
By Application
The transport segment held the largest market share around 44% in 2023. It is because of the rising demand for cleaner, sustainable fuel alternatives for the transport sector. Especially in the case of applications like trucks, buses, trains, and ships which belong to the heavy-duty transport segment, hydrogen and fuel cell technology presents highly promising solutions to reduce emissions. For some transport sectors, hydrogen fuel cells can be better than BEVs as hydrogen gives longer driving ranges, shorter refueling times, and the ability to carry heavy loads. Global governments are doing their part as well, offering incentives, subsidies, and investing in infrastructure designed for hydrogen-based transport, including hydrogen fueling stations.
Get Customised Report as per Your Business Requirement - Enquire Now
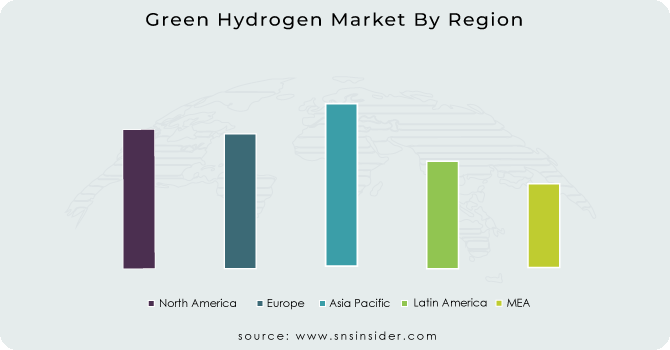
Regional Analysis
Asia Pacific held the largest market share around 44% in 2023. It is one of the leading regions for the highest renewable energy adoption and industry transformation in the region with the largest market share in green hydrogen. China, Japan, and South Korea the world's three largest economies are all looking to green hydrogen as part of their energy transition and are heavily investing, making this a potentially lucrative market within the region. All of these countries have ambitious decarbonization targets and are searching for sustainable solutions toward a reduction in fossil fuel demand. China, the biggest CO2 emitter, sees green hydrogen as a main way to decarbonize sectors including steel and chemicals; Japan and South Korea also are investing heavily in hydrogen as a central plank of their energy futures, with Japan's prime minister having called for a "hydrogen society." The region is also endowed with low-cost renewable energy, including solar and wind, which are key elements of green hydrogen production. The rapid growth of hydrogen infrastructure, large funding, and government-backed initiatives like Japan's hydrogen highway and China's hydrogen development roadmap, contribute to the overwhelming dominance of Asia Pacific in the green hydrogen market. Asia Pacific is well placed to lead and is already leading the global shift towards green hydrogen with a perfect storm of government support, industrial demand, and tech development.
Key Players
Linde plc (Hydrogen Production Plants, Electrolyzers)
Air Liquide (Hydrogen Liquefiers, Hydrogen Refueling Stations)
Siemens Energy AG (Silyzer Electrolyzers, Haru Oni Project)
Air Products and Chemicals, Inc. (Hydrogen Fueling Stations, Hydrogen Liquefaction Plants)
Plug Power Inc. (ProGen Fuel Cell Engines, GenFuel Hydrogen Solutions)
Bloom Energy Corporation (Bloom Energy Server, Electrolyzers)
Cummins Inc. (HyLYZER Electrolyzers, Hydrogen Fuel Cells)
Engie SA (Hydrogen Production Facilities, Hydrogen Storage Solutions)
Nel ASA (Alkaline Electrolyzers, Proton PEM Electrolyzers)
Toshiba Energy Systems & Solutions Corporation (Hydrogen Energy Research, Hydrogen Production Systems)
Uniper SE (Green Hydrogen Projects, Hydrogen Storage Solutions)
Ballard Power Systems Inc. (FCmove Fuel Cell Modules, FCgen Fuel Cell Products)
Iberdrola, S.A. (Green Hydrogen Production Plants, Renewable Energy Integration)
Repsol S.A. (Hydrogen Production Facilities, Renewable Hydrogen Projects)
China Petroleum & Chemical Corporation (Sinopec) (Hydrogen Refueling Stations, Hydrogen Production Plants)
Green Hydrogen Systems A/S (GHS HyProvide Electrolyzers, Hydrogen Generation Units)
McPhy Energy (McLyzer Electrolyzers, McFilling Hydrogen Stations)
ITM Power PLC (HGas Electrolyzers, Hydrogen Refueling Stations)
Reliance Industries Limited (Hydrogen Production Projects, Renewable Energy Integration)
Enapter (AEM Electrolyzers, Hydrogen Generators)
Recent Development:
In April 2023, Sinopec unveiled intentions to build a 400 km green hydrogen pipeline connecting Inner Mongolia with Beijing. The pipeline, with a capacity of 100,000 tonnes per year, aims to transport hydrogen generated from renewable sources, marking a significant step in reducing carbon emissions.
In April 2024, Oman's Hydrom signed an agreement worth USD 11 billion with Electricité de France (EDF Group) to develop two green hydrogen production projects.
In June 2022, Siemens Energy and Air Liquide S.A. announced a joint venture to manufacture industrial-scale renewable hydrogen electrolyzers. This collaboration aims to facilitate the development of a sustainable hydrogen economy in Europe.
| Report Attributes | Details |
| Market Size in 2023 | US$ 6.6 Bn |
| Market Size by 2032 | US$ 133.50 Bn |
| CAGR | CAGR of 39.6% From 2024 to 2032 |
| Base Year | 2023 |
| Forecast Period | 2024-2032 |
| Historical Data | 2020-2022 |
| Report Scope & Coverage | Market Size, Segments Analysis, Competitive Landscape, Regional Analysis, DROC & SWOT Analysis, Forecast Outlook |
| Key Segments |
• By Technology (Alkaline electrolyze, Polymer electrolyte Membrane (PEM Electrolyte), SOEC Electrolyzer) |
| Regional Analysis/Coverage | North America (USA, Canada, Mexico), Europe (Germany, UK, France, Italy, Spain, Netherlands, Rest of Europe), Asia-Pacific (Japan, South Korea, China, India, Australia, Rest of Asia-Pacific), The Middle East & Africa (Israel, UAE, South Africa, Rest of Middle East & Africa), Latin America (Brazil, Argentina, Rest of Latin America) |
| Company Profiles | Linde plc, Air Liquide, Siemens Energy AG, Air Products and Chemicals, Inc., Plug Power Inc. , Bloom Energy Corporation, Cummins Inc. , Engie SA, Nel ASA, Toshiba Energy Systems & Solutions Corporation, Uniper SE, Ballard Power Systems Inc. , Iberdrola, S.A., Repsol S.A., China Petroleum & Chemical Corporation (Sinopec), Green Hydrogen Systems A/S , McPhy Energy, ITM Power PLC, Reliance Industries Limited, Enapter |
| Key Drivers | • Rising Demand in hard-to-abate sectors drives market growth. |
| Market Opportunities | • The efforts to reduce the CO2 emissions to net zero by 2050. • The participation of government and several committees in this mission. |
The CAGR rate is expected to be 39.6% during the forecasted period.
The Green Hydrogen Market was USD 6.6 billion in 2023 and is expected to reach USD 133.50 billion by 2032, growing at a CAGR of 39.6% over the forecast period of 2024-2032.
Covid-19 had a negative impact on the green hydrogen market.
Rise in demand of green hydrogen production due to the decarbonization benefit.
Table of Contents
1. Introduction
1.1 Market Definition
1.2 Scope (Inclusion and Exclusions)
1.3 Research Assumptions
2. Executive Summary
2.1 Market Overview
2.2 Regional Synopsis
2.3 Competitive Summary
3. Research Methodology
3.1 Top-Down Approach
3.2 Bottom-up Approach
3.3. Data Validation
3.4 Primary Interviews
4. Market Dynamics Impact Analysis
4.1 Market Driving Factors Analysis
4.1.1 Drivers
4.1.2 Restraints
4.1.3 Opportunities
4.1.4 Challenges
4.2 PESTLE Analysis
4.3 Porter’s Five Forces Model
5. Statistical Insights and Trends Reporting
5.1 By Production Capacity and Utilization, by Country, By Type, 2023
5.2 Feedstock Prices, by Country, By Type, 2023
5.3 Regulatory Impact, by l Country, By Type, 2023.
5.4 Environmental Metrics: Emissions Data, Waste Management Practices, and Sustainability Initiatives, by Region
5.5 Innovation and R&D, Type, 2023
6. Competitive Landscape
6.1 List of Major Companies, By Region
6.2 Market Share Analysis, By Region
6.3 Product Benchmarking
6.3.1 Product specifications and features
6.3.2 Pricing
6.4 Strategic Initiatives
6.4.1 Marketing and promotional activities
6.4.2 Distribution and Supply Chain Strategies
6.4.3 Expansion plans and new Product launches
6.4.4 Strategic partnerships and collaborations
6.5 Technological Advancements
6.6 Market Positioning and Branding
7. Green Hydrogen Market Segmentation, by Technology
7.1 Chapter Overview
7.2 Alkaline Electrolyzer
7.2.1 Alkaline Electrolyzer Market Trends Analysis (2020-2032)
7.2.2 Alkaline Electrolyzer Market Size Estimates and Forecasts to 2032 (USD Billion)
7.3 Polymer Electrolyte Membrane (PEM) Electrolyzer
7.3.1 Polymer Electrolyte Membrane (PEM) Electrolyzer Market Trends Analysis (2020-2032)
7.3.2 Polymer Electrolyte Membrane (PEM) Electrolyzer Market Size Estimates and Forecasts to 2032 (USD Billion)
7.4 SOEC Electrolyzer
7.4.1 SOEC Electrolyzer Market Trends Analysis (2020-2032)
7.4.2 SOEC Electrolyzer Market Size Estimates and Forecasts to 2032 (USD Billion)
8. Green Hydrogen Market Segmentation, by Distribution Channel
8.1 Chapter Overview
8.2 Pipeline
8.2.1 Pipeline Market Trends Analysis (2020-2032)
8.2.2 Pipeline Market Size Estimates and Forecasts to 2032 (USD Billion)
8.3 Cargo
8.3.1 Cargo Market Trends Analysis (2020-2032)
8.3.2 Cargo Market Size Estimates and Forecasts to 2032 (USD Billion)
9. Green Hydrogen Market Segmentation, by Application
9.1 Chapter Overview
9.2 Power Generation
9.2.1 Power Generation Market Trends Analysis (2020-2032)
9.2.2 Power Generation Market Size Estimates and Forecasts to 2032 (USD Billion)
9.3 Transport
9.3.1 Transport Market Trends Analysis (2020-2032)
9.3.2 Transport Market Size Estimates and Forecasts to 2032 (USD Billion)
9.4 Others
9.4.1 Others Market Trends Analysis (2020-2032)
9.4.2 Others Market Size Estimates and Forecasts to 2032 (USD Billion)
10. Regional Analysis
10.1 Chapter Overview
10.2 North America
10.2.1 Trends Analysis
10.2.2 North America Green Hydrogen Market Estimates and Forecasts, by Country (2020-2032) (USD Billion)
10.2.3 North America Green Hydrogen Market Estimates and Forecasts, by Technology (2020-2032) (USD Billion)
10.2.4 North America Green Hydrogen Market Estimates and Forecasts, by Distribution Channel (2020-2032) (USD Billion)
10.2.5 North America Green Hydrogen Market Estimates and Forecasts, by Application (2020-2032) (USD Billion)
10.2.6 USA
10.2.6.1 USA Green Hydrogen Market Estimates and Forecasts, by Technology (2020-2032) (USD Billion)
10.2.6.2 USA Green Hydrogen Market Estimates and Forecasts, by Distribution Channel (2020-2032) (USD Billion)
10.2.6.3 USA Green Hydrogen Market Estimates and Forecasts, by Application (2020-2032) (USD Billion)
10.2.7 Canada
10.2.7.1 Canada Green Hydrogen Market Estimates and Forecasts, by Technology (2020-2032) (USD Billion)
10.2.7.2 Canada Green Hydrogen Market Estimates and Forecasts, by Distribution Channel (2020-2032) (USD Billion)
10.2.7.3 Canada Green Hydrogen Market Estimates and Forecasts, by Application (2020-2032) (USD Billion)
10.2.8 Mexico
10.2.8.1 Mexico Green Hydrogen Market Estimates and Forecasts, by Technology (2020-2032) (USD Billion)
10.2.8.2 Mexico Green Hydrogen Market Estimates and Forecasts, by Distribution Channel (2020-2032) (USD Billion)
10.2.8.3 Mexico Green Hydrogen Market Estimates and Forecasts, by Application (2020-2032) (USD Billion)
10.3 Europe
10.3.1 Eastern Europe
10.3.1.1 Trends Analysis
10.3.1.2 Eastern Europe Green Hydrogen Market Estimates and Forecasts, by Country (2020-2032) (USD Billion)
10.3.1.3 Eastern Europe Green Hydrogen Market Estimates and Forecasts, by Technology (2020-2032) (USD Billion)
10.3.1.4 Eastern Europe Green Hydrogen Market Estimates and Forecasts, by Distribution Channel (2020-2032) (USD Billion)
10.3.1.5 Eastern Europe Green Hydrogen Market Estimates and Forecasts, by Application (2020-2032) (USD Billion)
10.3.1.6 Poland
10.3.1.6.1 Poland Green Hydrogen Market Estimates and Forecasts, by Technology (2020-2032) (USD Billion)
10.3.1.6.2 Poland Green Hydrogen Market Estimates and Forecasts, by Distribution Channel (2020-2032) (USD Billion)
10.3.1.6.3 Poland Green Hydrogen Market Estimates and Forecasts, by Application (2020-2032) (USD Billion)
10.3.1.7 Romania
10.3.1.7.1 Romania Green Hydrogen Market Estimates and Forecasts, by Technology (2020-2032) (USD Billion)
10.3.1.7.2 Romania Green Hydrogen Market Estimates and Forecasts, by Distribution Channel (2020-2032) (USD Billion)
10.3.1.7.3 Romania Green Hydrogen Market Estimates and Forecasts, by Application (2020-2032) (USD Billion)
10.3.1.8 Hungary
10.3.1.8.1 Hungary Green Hydrogen Market Estimates and Forecasts, by Technology (2020-2032) (USD Billion)
10.3.1.8.2 Hungary Green Hydrogen Market Estimates and Forecasts, by Distribution Channel (2020-2032) (USD Billion)
10.3.1.8.3 Hungary Green Hydrogen Market Estimates and Forecasts, by Application (2020-2032) (USD Billion)
10.3.1.9 Turkey
10.3.1.9.1 Turkey Green Hydrogen Market Estimates and Forecasts, by Technology (2020-2032) (USD Billion)
10.3.1.9.2 Turkey Green Hydrogen Market Estimates and Forecasts, by Distribution Channel (2020-2032) (USD Billion)
10.3.1.9.3 Turkey Green Hydrogen Market Estimates and Forecasts, by Application (2020-2032) (USD Billion)
10.3.1.10 Rest of Eastern Europe
10.3.1.10.1 Rest of Eastern Europe Green Hydrogen Market Estimates and Forecasts, by Technology (2020-2032) (USD Billion)
10.3.1.10.2 Rest of Eastern Europe Green Hydrogen Market Estimates and Forecasts, by Distribution Channel (2020-2032) (USD Billion)
10.3.1.10.3 Rest of Eastern Europe Green Hydrogen Market Estimates and Forecasts, by Application (2020-2032) (USD Billion)
10.3.2 Western Europe
10.3.2.1 Trends Analysis
10.3.2.2 Western Europe Green Hydrogen Market Estimates and Forecasts, by Country (2020-2032) (USD Billion)
10.3.2.3 Western Europe Green Hydrogen Market Estimates and Forecasts, by Technology (2020-2032) (USD Billion)
10.3.2.4 Western Europe Green Hydrogen Market Estimates and Forecasts, by Distribution Channel (2020-2032) (USD Billion)
10.3.2.5 Western Europe Green Hydrogen Market Estimates and Forecasts, by Application (2020-2032) (USD Billion)
10.3.2.6 Germany
10.3.2.6.1 Germany Green Hydrogen Market Estimates and Forecasts, by Technology (2020-2032) (USD Billion)
10.3.2.6.2 Germany Green Hydrogen Market Estimates and Forecasts, by Distribution Channel (2020-2032) (USD Billion)
10.3.2.6.3 Germany Green Hydrogen Market Estimates and Forecasts, by Application (2020-2032) (USD Billion)
10.3.2.7 France
10.3.2.7.1 France Green Hydrogen Market Estimates and Forecasts, by Technology (2020-2032) (USD Billion)
10.3.2.7.2 France Green Hydrogen Market Estimates and Forecasts, by Distribution Channel (2020-2032) (USD Billion)
10.3.2.7.3 France Green Hydrogen Market Estimates and Forecasts, by Application (2020-2032) (USD Billion)
10.3.2.8 UK
10.3.2.8.1 UK Green Hydrogen Market Estimates and Forecasts, by Technology (2020-2032) (USD Billion)
10.3.2.8.2 UK Green Hydrogen Market Estimates and Forecasts, by Distribution Channel (2020-2032) (USD Billion)
10.3.2.8.3 UK Green Hydrogen Market Estimates and Forecasts, by Application (2020-2032) (USD Billion)
10.3.2.9 Italy
10.3.2.9.1 Italy Green Hydrogen Market Estimates and Forecasts, by Technology (2020-2032) (USD Billion)
10.3.2.9.2 Italy Green Hydrogen Market Estimates and Forecasts, by Distribution Channel (2020-2032) (USD Billion)
10.3.2.9.3 Italy Green Hydrogen Market Estimates and Forecasts, by Application (2020-2032) (USD Billion)
10.3.2.10 Spain
10.3.2.10.1 Spain Green Hydrogen Market Estimates and Forecasts, by Technology (2020-2032) (USD Billion)
10.3.2.10.2 Spain Green Hydrogen Market Estimates and Forecasts, by Distribution Channel (2020-2032) (USD Billion)
10.3.2.10.3 Spain Green Hydrogen Market Estimates and Forecasts, by Application (2020-2032) (USD Billion)
10.3.2.11 Netherlands
10.3.2.11.1 Netherlands Green Hydrogen Market Estimates and Forecasts, by Technology (2020-2032) (USD Billion)
10.3.2.11.2 Netherlands Green Hydrogen Market Estimates and Forecasts, by Distribution Channel (2020-2032) (USD Billion)
10.3.2.11.3 Netherlands Green Hydrogen Market Estimates and Forecasts, by Application (2020-2032) (USD Billion)
10.3.2.12 Switzerland
10.3.2.12.1 Switzerland Green Hydrogen Market Estimates and Forecasts, by Technology (2020-2032) (USD Billion)
10.3.2.12.2 Switzerland Green Hydrogen Market Estimates and Forecasts, by Distribution Channel (2020-2032) (USD Billion)
10.3.2.12.3 Switzerland Green Hydrogen Market Estimates and Forecasts, by Application (2020-2032) (USD Billion)
10.3.2.13 Austria
10.3.2.13.1 Austria Green Hydrogen Market Estimates and Forecasts, by Technology (2020-2032) (USD Billion)
10.3.2.13.2 Austria Green Hydrogen Market Estimates and Forecasts, by Distribution Channel (2020-2032) (USD Billion)
10.3.2.13.3 Austria Green Hydrogen Market Estimates and Forecasts, by Application (2020-2032) (USD Billion)
10.3.2.14 Rest of Western Europe
10.3.2.14.1 Rest of Western Europe Green Hydrogen Market Estimates and Forecasts, by Technology (2020-2032) (USD Billion)
10.3.2.14.2 Rest of Western Europe Green Hydrogen Market Estimates and Forecasts, by Distribution Channel (2020-2032) (USD Billion)
10.3.2.14.3 Rest of Western Europe Green Hydrogen Market Estimates and Forecasts, by Application (2020-2032) (USD Billion)
10.4 Asia Pacific
10.4.1 Trends Analysis
10.4.2 Asia Pacific Green Hydrogen Market Estimates and Forecasts, by Country (2020-2032) (USD Billion)
10.4.3 Asia Pacific Green Hydrogen Market Estimates and Forecasts, by Technology (2020-2032) (USD Billion)
10.4.4 Asia Pacific Green Hydrogen Market Estimates and Forecasts, by Distribution Channel (2020-2032) (USD Billion)
10.4.5 Asia Pacific Green Hydrogen Market Estimates and Forecasts, by Application (2020-2032) (USD Billion)
10.4.6 China
10.4.6.1 China Green Hydrogen Market Estimates and Forecasts, by Technology (2020-2032) (USD Billion)
10.4.6.2 China Green Hydrogen Market Estimates and Forecasts, by Distribution Channel (2020-2032) (USD Billion)
10.4.6.3 China Green Hydrogen Market Estimates and Forecasts, by Application (2020-2032) (USD Billion)
10.4.7 India
10.4.7.1 India Green Hydrogen Market Estimates and Forecasts, by Technology (2020-2032) (USD Billion)
10.4.7.2 India Green Hydrogen Market Estimates and Forecasts, by Distribution Channel (2020-2032) (USD Billion)
10.4.7.3 India Green Hydrogen Market Estimates and Forecasts, by Application (2020-2032) (USD Billion)
10.4.8 Japan
10.4.8.1 Japan Green Hydrogen Market Estimates and Forecasts, by Technology (2020-2032) (USD Billion)
10.4.8.2 Japan Green Hydrogen Market Estimates and Forecasts, by Distribution Channel (2020-2032) (USD Billion)
10.4.8.3 Japan Green Hydrogen Market Estimates and Forecasts, by Application (2020-2032) (USD Billion)
10.4.9 South Korea
10.4.9.1 South Korea Green Hydrogen Market Estimates and Forecasts, by Technology (2020-2032) (USD Billion)
10.4.9.2 South Korea Green Hydrogen Market Estimates and Forecasts, by Distribution Channel (2020-2032) (USD Billion)
10.4.9.3 South Korea Green Hydrogen Market Estimates and Forecasts, by Application (2020-2032) (USD Billion)
10.4.10 Vietnam
10.4.10.1 Vietnam Green Hydrogen Market Estimates and Forecasts, by Technology (2020-2032) (USD Billion)
10.4.10.2 Vietnam Green Hydrogen Market Estimates and Forecasts, by Distribution Channel (2020-2032) (USD Billion)
10.4.10.3 Vietnam Green Hydrogen Market Estimates and Forecasts, by Application (2020-2032) (USD Billion)
10.4.11 Singapore
10.4.11.1 Singapore Green Hydrogen Market Estimates and Forecasts, by Technology (2020-2032) (USD Billion)
10.4.11.2 Singapore Green Hydrogen Market Estimates and Forecasts, by Distribution Channel (2020-2032) (USD Billion)
10.4.11.3 Singapore Green Hydrogen Market Estimates and Forecasts, by Application (2020-2032) (USD Billion)
10.4.12 Australia
10.4.12.1 Australia Green Hydrogen Market Estimates and Forecasts, by Technology (2020-2032) (USD Billion)
10.4.12.2 Australia Green Hydrogen Market Estimates and Forecasts, by Distribution Channel (2020-2032) (USD Billion)
10.4.12.3 Australia Green Hydrogen Market Estimates and Forecasts, by Application (2020-2032) (USD Billion)
10.4.13 Rest of Asia Pacific
10.4.13.1 Rest of Asia Pacific Green Hydrogen Market Estimates and Forecasts, by Technology (2020-2032) (USD Billion)
10.4.13.2 Rest of Asia Pacific Green Hydrogen Market Estimates and Forecasts, by Distribution Channel (2020-2032) (USD Billion)
10.4.13.3 Rest of Asia Pacific Green Hydrogen Market Estimates and Forecasts, by Application (2020-2032) (USD Billion)
10.5 Middle East and Africa
10.5.1 Middle East
10.5.1.1 Trends Analysis
10.5.1.2 Middle East Green Hydrogen Market Estimates and Forecasts, by Country (2020-2032) (USD Billion)
10.5.1.3 Middle East Green Hydrogen Market Estimates and Forecasts, by Technology (2020-2032) (USD Billion)
10.5.1.4 Middle East Green Hydrogen Market Estimates and Forecasts, by Distribution Channel (2020-2032) (USD Billion)
10.5.1.5 Middle East Green Hydrogen Market Estimates and Forecasts, by Application (2020-2032) (USD Billion)
10.5.1.6 UAE
10.5.1.6.1 UAE Green Hydrogen Market Estimates and Forecasts, by Technology (2020-2032) (USD Billion)
10.5.1.6.2 UAE Green Hydrogen Market Estimates and Forecasts, by Distribution Channel (2020-2032) (USD Billion)
10.5.1.6.3 UAE Green Hydrogen Market Estimates and Forecasts, by Application (2020-2032) (USD Billion)
10.5.1.7 Egypt
10.5.1.7.1 Egypt Green Hydrogen Market Estimates and Forecasts, by Technology (2020-2032) (USD Billion)
10.5.1.7.2 Egypt Green Hydrogen Market Estimates and Forecasts, by Distribution Channel (2020-2032) (USD Billion)
10.5.1.7.3 Egypt Green Hydrogen Market Estimates and Forecasts, by Application (2020-2032) (USD Billion)
10.5.1.8 Saudi Arabia
10.5.1.8.1 Saudi Arabia Green Hydrogen Market Estimates and Forecasts, by Technology (2020-2032) (USD Billion)
10.5.1.8.2 Saudi Arabia Green Hydrogen Market Estimates and Forecasts, by Distribution Channel (2020-2032) (USD Billion)
10.5.1.8.3 Saudi Arabia Green Hydrogen Market Estimates and Forecasts, by Application (2020-2032) (USD Billion)
10.5.1.9 Qatar
10.5.1.9.1 Qatar Green Hydrogen Market Estimates and Forecasts, by Technology (2020-2032) (USD Billion)
10.5.1.9.2 Qatar Green Hydrogen Market Estimates and Forecasts, by Distribution Channel (2020-2032) (USD Billion)
10.5.1.9.3 Qatar Green Hydrogen Market Estimates and Forecasts, by Application (2020-2032) (USD Billion)
10.5.1.10 Rest of Middle East
10.5.1.10.1 Rest of Middle East Green Hydrogen Market Estimates and Forecasts, by Technology (2020-2032) (USD Billion)
10.5.1.10.2 Rest of Middle East Green Hydrogen Market Estimates and Forecasts, by Distribution Channel (2020-2032) (USD Billion)
10.5.1.10.3 Rest of Middle East Green Hydrogen Market Estimates and Forecasts, by Application (2020-2032) (USD Billion)
10.5.2 Africa
10.5.2.1 Trends Analysis
10.5.2.2 Africa Green Hydrogen Market Estimates and Forecasts, by Country (2020-2032) (USD Billion)
10.5.2.3 Africa Green Hydrogen Market Estimates and Forecasts, by Technology (2020-2032) (USD Billion)
10.5.2.4 Africa Green Hydrogen Market Estimates and Forecasts, by Distribution Channel (2020-2032) (USD Billion)
10.5.2.5 Africa Green Hydrogen Market Estimates and Forecasts, by Application (2020-2032) (USD Billion)
10.5.2.6 South Africa
10.5.2.6.1 South Africa Green Hydrogen Market Estimates and Forecasts, by Technology (2020-2032) (USD Billion)
10.5.2.6.2 South Africa Green Hydrogen Market Estimates and Forecasts, by Distribution Channel (2020-2032) (USD Billion)
10.5.2.6.3 South Africa Green Hydrogen Market Estimates and Forecasts, by Application (2020-2032) (USD Billion)
10.5.2.7 Nigeria
10.5.2.7.1 Nigeria Green Hydrogen Market Estimates and Forecasts, by Technology (2020-2032) (USD Billion)
10.5.2.7.2 Nigeria Green Hydrogen Market Estimates and Forecasts, by Distribution Channel (2020-2032) (USD Billion)
10.5.2.7.3 Nigeria Green Hydrogen Market Estimates and Forecasts, by Application (2020-2032) (USD Billion)
10.5.2.8 Rest of Africa
10.5.2.8.1 Rest of Africa Green Hydrogen Market Estimates and Forecasts, by Technology (2020-2032) (USD Billion)
10.5.2.8.2 Rest of Africa Green Hydrogen Market Estimates and Forecasts, by Distribution Channel (2020-2032) (USD Billion)
10.5.2.8.3 Rest of Africa Green Hydrogen Market Estimates and Forecasts, by Application (2020-2032) (USD Billion)
10.6 Latin America
10.6.1 Trends Analysis
10.6.2 Latin America Green Hydrogen Market Estimates and Forecasts, by Country (2020-2032) (USD Billion)
10.6.3 Latin America Green Hydrogen Market Estimates and Forecasts, by Technology (2020-2032) (USD Billion)
10.6.4 Latin America Green Hydrogen Market Estimates and Forecasts, by Distribution Channel (2020-2032) (USD Billion)
10.6.5 Latin America Green Hydrogen Market Estimates and Forecasts, by Application (2020-2032) (USD Billion)
10.6.6 Brazil
10.6.6.1 Brazil Green Hydrogen Market Estimates and Forecasts, by Technology (2020-2032) (USD Billion)
10.6.6.2 Brazil Green Hydrogen Market Estimates and Forecasts, by Distribution Channel (2020-2032) (USD Billion)
10.6.6.3 Brazil Green Hydrogen Market Estimates and Forecasts, by Application (2020-2032) (USD Billion)
10.6.7 Argentina
10.6.7.1 Argentina Green Hydrogen Market Estimates and Forecasts, by Technology (2020-2032) (USD Billion)
10.6.7.2 Argentina Green Hydrogen Market Estimates and Forecasts, by Distribution Channel (2020-2032) (USD Billion)
10.6.7.3 Argentina Green Hydrogen Market Estimates and Forecasts, by Application (2020-2032) (USD Billion)
10.6.8 Colombia
10.6.8.1 Colombia Green Hydrogen Market Estimates and Forecasts, by Technology (2020-2032) (USD Billion)
10.6.8.2 Colombia Green Hydrogen Market Estimates and Forecasts, by Distribution Channel (2020-2032) (USD Billion)
10.6.8.3 Colombia Green Hydrogen Market Estimates and Forecasts, by Application (2020-2032) (USD Billion)
10.6.9 Rest of Latin America
10.6.9.1 Rest of Latin America Green Hydrogen Market Estimates and Forecasts, by Technology (2020-2032) (USD Billion)
10.6.9.2 Rest of Latin America Green Hydrogen Market Estimates and Forecasts, by Distribution Channel (2020-2032) (USD Billion)
10.6.9.3 Rest of Latin America Green Hydrogen Market Estimates and Forecasts, by Application (2020-2032) (USD Billion)
11. Company Profiles
11.1 linde plc
11.1.1 Company Overview
11.1.2 Financial
11.1.3 Product/ Services Offered
11.1.4 SWOT Analysis
11.2 Engie SA
11.2.1 Company Overview
11.2.2 Financial
11.2.3 Product/ Services Offered
11.2.4 SWOT Analysis
11.3 Plug Power Inc.
11.3.1 Company Overview
11.3.2 Financial
11.3.3 Product/ Services Offered
11.3.4 SWOT Analysis
11.4 Bloom Energy Corporation
11.4.1 Company Overview
11.4.2 Financial
11.4.3 Product/ Services Offered
11.4.4 SWOT Analysis
11.5 Cummins Inc.
11.5.1 Company Overview
11.5.2 Financial
11.5.3 Product/ Services Offered
11.5.4 SWOT Analysis
11.6 Air Products Inc.
11.6.1 Company Overview
11.6.2 Financial
11.6.3 Product/ Services Offered
11.6.4 SWOT Analysis
11.7 Toshiba Energy Systems & Solutions Corporation
11.7.1 Company Overview
11.7.2 Financial
11.7.3 Product/ Services Offered
11.7.4 SWOT Analysis
11.8 Siemens Energy AG
11.8.1 Company Overview
11.8.2 Financial
11.8.3 Product/ Services Offered
11.8.4 SWOT Analysis
11.9 Air Products and Chemicals, Inc
11.9.1 Company Overview
11.9.2 Financial
11.9.3 Product/ Services Offered
11.9.4 SWOT Analysis
11.10 Nel ASA
11.10.1 Company Overview
11.10.2 Financial
11.10.3 Product/ Services Offered
11.10.4 SWOT Analysis
12. Use Cases and Best Practices
13. Conclusion
An accurate research report requires proper strategizing as well as implementation. There are multiple factors involved in the completion of good and accurate research report and selecting the best methodology to compete the research is the toughest part. Since the research reports we provide play a crucial role in any company’s decision-making process, therefore we at SNS Insider always believe that we should choose the best method which gives us results closer to reality. This allows us to reach at a stage wherein we can provide our clients best and accurate investment to output ratio.
Each report that we prepare takes a timeframe of 350-400 business hours for production. Starting from the selection of titles through a couple of in-depth brain storming session to the final QC process before uploading our titles on our website we dedicate around 350 working hours. The titles are selected based on their current market cap and the foreseen CAGR and growth.
The 5 steps process:
Step 1: Secondary Research:
Secondary Research or Desk Research is as the name suggests is a research process wherein, we collect data through the readily available information. In this process we use various paid and unpaid databases which our team has access to and gather data through the same. This includes examining of listed companies’ annual reports, Journals, SEC filling etc. Apart from this our team has access to various associations across the globe across different industries. Lastly, we have exchange relationships with various university as well as individual libraries.

Step 2: Primary Research
When we talk about primary research, it is a type of study in which the researchers collect relevant data samples directly, rather than relying on previously collected data. This type of research is focused on gaining content specific facts that can be sued to solve specific problems. Since the collected data is fresh and first hand therefore it makes the study more accurate and genuine.
We at SNS Insider have divided Primary Research into 2 parts.
Part 1 wherein we interview the KOLs of major players as well as the upcoming ones across various geographic regions. This allows us to have their view over the market scenario and acts as an important tool to come closer to the accurate market numbers. As many as 45 paid and unpaid primary interviews are taken from both the demand and supply side of the industry to make sure we land at an accurate judgement and analysis of the market.
This step involves the triangulation of data wherein our team analyses the interview transcripts, online survey responses and observation of on filed participants. The below mentioned chart should give a better understanding of the part 1 of the primary interview.

Part 2: In this part of primary research the data collected via secondary research and the part 1 of the primary research is validated with the interviews from individual consultants and subject matter experts.
Consultants are those set of people who have at least 12 years of experience and expertise within the industry whereas Subject Matter Experts are those with at least 15 years of experience behind their back within the same space. The data with the help of two main processes i.e., FGDs (Focused Group Discussions) and IDs (Individual Discussions). This gives us a 3rd party nonbiased primary view of the market scenario making it a more dependable one while collation of the data pointers.
Step 3: Data Bank Validation
Once all the information is collected via primary and secondary sources, we run that information for data validation. At our intelligence centre our research heads track a lot of information related to the market which includes the quarterly reports, the daily stock prices, and other relevant information. Our data bank server gets updated every fortnight and that is how the information which we collected using our primary and secondary information is revalidated in real time.

Step 4: QA/QC Process
After all the data collection and validation our team does a final level of quality check and quality assurance to get rid of any unwanted or undesired mistakes. This might include but not limited to getting rid of the any typos, duplication of numbers or missing of any important information. The people involved in this process include technical content writers, research heads and graphics people. Once this process is completed the title gets uploader on our platform for our clients to read it.
Step 5: Final QC/QA Process:
This is the last process and comes when the client has ordered the study. In this process a final QA/QC is done before the study is emailed to the client. Since we believe in giving our clients a good experience of our research studies, therefore, to make sure that we do not lack at our end in any way humanly possible we do a final round of quality check and then dispatch the study to the client.
Key Segments:
By Technology
Alkaline Electrolyzer
Polymer Electrolyte Membrane (PEM) Electrolyzer
SOEC Electrolyzer
By Distribution Channel
Pipeline
Cargo
By Application
Power Generation
Transport
Others
Request for Segment Customization as per your Business Requirement: Segment Customization Request
Regional Coverage:
North America
US
Canada
Mexico
Europe
Eastern Europe
Poland
Romania
Hungary
Turkey
Rest of Eastern Europe
Western Europe
Germany
France
UK
Italy
Spain
Netherlands
Switzerland
Austria
Rest of Western Europe
Asia Pacific
China
India
Japan
South Korea
Vietnam
Singapore
Australia
Rest of Asia Pacific
Middle East & Africa
Middle East
UAE
Egypt
Saudi Arabia
Qatar
Rest of Middle East
Africa
Nigeria
South Africa
Rest of Africa
Latin America
Brazil
Argentina
Colombia
Rest of Latin America
Request for Country Level Research Report: Country Level Customization Request
Available Customization
With the given market data, SNS Insider offers customization as per the company’s specific needs. The following customization options are available for the report:
Product Analysis
Criss-Cross segment analysis (e.g. Product X Application)
Product Matrix which gives a detailed comparison of the product portfolio of each company
Geographic Analysis
Additional countries in any of the regions
Company Information
Detailed analysis and profiling of additional market players (Up to five)
The Heavy Metal Testing Market size was valued at USD 4.01 billion in 2023 and is expected to grow to USD 7.89 billion by 2032 and grow at a CAGR of 7.8% over the forecast period of 2024-2032.
The Carbon Credit Trading Platform Market size was valued at USD 130.0 million in 2022 and is expected to reach USD 774.8 million by 2031 with a growing CAGR of 25% over the forecast period of 2024-2031.
The Solid-State Transformer Market size was valued at USD 85.3 million in 2023 and is expected to grow to USD 279.6 million by 2031 and grow at a CAGR of 16% over the forecast period of 2024-2031.
The Floating Solar Panels Market size was valued at USD 44.08 billion in 2023 and is expected to grow to USD 227.91 billion by 2031 and grow at a CAGR of 22.8% over the forecast period of 2024-2031.
The Energy Harvesting System Market size was valued at USD 638.86 million in 2023 and is expected to grow to USD 1442.32 million by 2032 and grow at a CAGR of 9.47% over the forecast period of 2024-2032.
The Solar Air-Conditioner Market size was valued at USD 2.22 billion in 2022 and is expected to grow to USD 6.15 billion by 2030 and grow at a CAGR of 13.6 % over the forecast period of 2023-2030.

Hi! Click one of our member below to chat on Phone
© 2025 All Rights Reserved by SNS Insider Pvt Ltd


