Get More Information on Geen Fertilizer Market - Request Sample Report
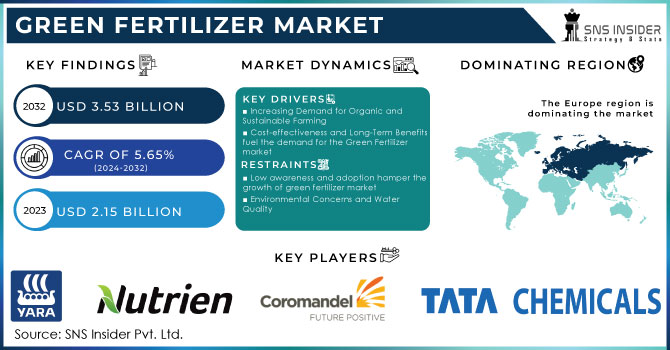
The Geen Fertilizer Market Size was valued at USD 2.15 billion in 2023, and is expected to reach USD 3.53 billion by 2032, and grow at a CAGR of 5.65% over the forecast period 2024-2032.
The green fertilizer market is moving towards a significant revolution, impelled by enhanced concern for the environment and the quest for greener ways of producing agricultural outputs. Concerns regarding traditional chemical fertilizers, which degrade soils, pollute water, and emit GHG, raise rapidly developing interest in greener alternatives. Another outstanding alternative to them is organic fertilizers, derived from natural sources like compost and manure, with reduced environmental impacts but without compromising on plant safety. This trend is triggered by the realization of adverse effects from synthetic fertilizers, like nutrient runoff that results in water pollution and damages the ecosystem. In August 2023, it was reported that in Germany, a ‘green’ fertilizer with up to 90% lower CO2 emissions than traditional options were introduced. Contract farmers of Bindewald & Gutting Milling Group utilized this fertilizer for wheat cultivation, which was then processed into flour for Harry-Brot bakery products.
It is the view of regulatory policies and incentives that may determine green fertilizer prospects. Governments all over the world are constantly putting control on chemical fertilizers and providing incentives for organic ones. For instance, the European Union's Common Agricultural Policy envisions sustainable practices, while the US Environmental Protection Agency is doing its share by fostering reductions in nutrient pollution. These policy contexts are promoting growth in the green fertilizer market through the creation of a conducive environment for sustainable agriculture.
Moreover, changing consumer preferences with an increase in techno-developmental activities acts as a driver in this market. Biofertilizer technologies, like microbial inoculants and mycorrhizal fungi, constantly evolve to increase the fertility of soils and plants. Running parallel is the consumers' choice for organically and sustainably produced food, which is rapidly propelling farmers to use green fertilizers. Regional dynamics also play a role in the fact that, with rapid industrialization, Asia-Pacific is focused on sustainable practices, while North America and Europe have established markets backed by strong regulations and a high degree of consumer awareness. Overall, the Green Fertilizer Market has been growing in tandem with global trends toward environmentally sustainable and healthier agricultural practices.
Market Dynamics:
Drivers:
Increasing Demand for Organic and Sustainable Farming
One major driver of the green fertilizer market is the growing demand for organic and sustainable farming. This slight movement of people's mindset toward greener agriculture practices happens because of increased awareness in the minds of consumers about the impact caused to the environment by conventional farming, with greater preference given to organic products. Much emphasis on organic farming goes into natural inputs and methods that help maintain the healthiness of the soil, which has less of an effect on the environment. Consumers have become more health- and eco-aware; therefore, foodstuffs grown without synthetic chemicals grow in significance to them. The result is a rise in organic farming practices. This, in turn, raises the demand for green fertilizers, reputedly more environmentally friendly than the standard chemical ones. In the United States, the organic food market has been increasing; consumers prefer to buy without artificial additives and pesticides. Meanwhile, the emerging standard for organic farming insists on the use of natural fertilizers and other amendments to the soil, providing additional impetus to green fertilizers. The EU's Common Agricultural Policy has also been promoting green fertilizers in farming practices in Europe, with an eye on its ecological goals and better soil fertility. In the case of India, adoption of organic farming methods is increasing due to rising consumer demand and government support. Schemes such as the Paramparagat Krishi Vikas Yojana are aiming to motivate farmers to use organic inputs and green fertilizers; therefore, further impetus is being given to market growth. In general, the demand for green fertilizers grows with increasing emphasis on organic and sustainable farming as a part of the initiative to lessen environmental impact and raise the bar for healthier agricultural systems.
Cost-effectiveness and Long-Term Benefits fuel the demand for the Green Fertilizer market
Cost-effectiveness and accruing benefits in itself would be a major driver that would fuel demand for green fertilizers. The initial cost may be on the higher side compared to the traditional system of chemical fertilization, but in most cases, the long-term benefits override the inputs made initially. Green fertilizers sourced from an organic, biological, or bio-based source help in improving soil health and fertility, leading to better crop yields, and reducing the necessity of other additional inputs. Therefore, this improved soil quality may set the conditions in which the long-term costs of applying fertilizers are reduced. For instance, while it is more expensive initially, composted green manures and bio-fertilizers improve the structure and favor microbial activities in the soil. This makes nutrients more available to plants and makes for better water retention, all of which lower the use of chemical fertilizers and pesticides. Farmers in the United States who invest in green fertilizers report that there has been an improvement in their soil and a decrease in input costs in the long run. In countries like India, for instance, where sustainable agriculture is on the increase, green fertilizers become a low-cost weapon for rising soil fertility while causing less environmental degradation. Natural growth in government subsidy and pro-farmer policies for the increasing promotion and popularization of organic farming practices have further elevated the acceptability of green fertilizers. This evolutionary step toward green fertilizers is introduced as a gesture toward environmental care, but it is also introduced in the way by which an economically workable practical solution of sustainable agriculture is available, and hence it drives their growing demand in the market.
Restraints:
Low awareness and adoption hamper the growth of green fertilizer market
Low awareness and adoption among most farmers and agricultural stakeholders reduce the growth rate in the market for green fertilizers significantly. Many farmers and agricultural stakeholders remain primarily unaware of the benefits and usage of green fertilizers as eco-friendly alternatives for improved soil health and minimized environmental impact. Although aware of the benefits of green fertilizers, such as improved soil health and lessened environmental impact, their use is slowed by the lack of education and understanding regarding both their effectiveness and cost benefits. For instance, in most developing regions, such as sub-Saharan Africa, traditional farming practices are deeply rooted, and farmers within the region might have poor access to information or resources regarding the emergence of green fertilizers. This is likely to incite resistance among farmers toward change and, thus, stick to their traditional ways of using conventional chemical fertilizers that are better known and easily within reach. As well, in regions of Eastern Europe, which are also traditional for farming, the use of green fertilizers is adopted slowly because they perceive them as being costlier and are not sure if they will work well. This results in a low level of adoption, which means lower growth on the market and the limitation of great realization of green fertilizers thus there is a need for even more awareness and sensitization to overcome these constraints.
Environmental Concerns and Water Quality
Opportunity:
Development of organic farming
Increased consumer demand for sustainably produced foodstuffs
Green fertilizer technology development
By Technology
The Proton Exchange Membrane technology segment accounted for 32.3% in the Green Fertilizer market in 2023. The reason why the PEM technology segment dominates the market is that it is the most effective and efficient process for the production of green hydrogen, which is used in many formulations in green fertilizers. PEM electrolysis provides high-purity hydrogen and operates at lower temperatures, making it very suitable for dynamic and time-variable energy sources like renewable energies directly from wind and solar power. For example, in Germany, the PEM technology is involved in complex green hydrogen production projects. These are delivering hydrogen for the manufacturing of sustainable ammonia—a chief component of green fertilizers. This technology can provide conditions under which high-quality and stable hydrogen can be delivered, thus supporting the growing demand for green fertilizers that will definitely go hand in hand with sustainable agriculture.
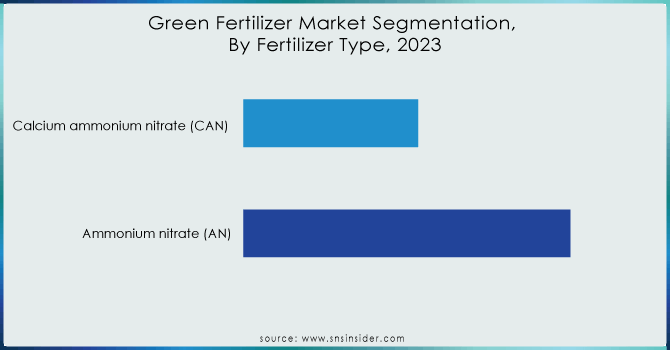
By Fertilizer Type
In 2023, ammonium nitrate dominated the green fertilizer market with a market share of 58.5% due to its high nitrogen content and its efficiency in increasing crop yields. AN is one of the most common nitrogenous fertilizers, famous for allowing plants to grow fast. This places it highly in demand with farmers looking to increase crop production drastically and as quickly as possible. For example, AN has always been in fashion as part of traditional farming in nations in the North American continent and in some parts of Europe, as it easily makes plants avail nitrogen, one of the most vital elements for crops to bloom. Much like all the other non-organic options, it is not very environmentally friendly but since it enjoyed a high level of availability and prices that were reasonable enough it secured a niche for itself. Notice, however, that while AN has been very popular, there is a growing shift towards the adoption of greener alternatives with growing sustainability concerns.
Need any customization research on Green Fertilizer Market - Enquiry Now
By Form
In 2023, granule and pellet forms under solid green fertilizers dominated the green fertilizer market with a market share of around 60%. It is due to its ease of application time and its long-term release into the soil as a nutrient that is in line with sustainable farming. The granules or pellets can have controlled releases, which work well for betterment in soil structure and provide better growth of the crops with reduced nutrient leachings. For example, granulated green fertilizers have been reported to be greatly consumed in large-scale farmlands, especially in countries like India and Brazil, due to the convenience and effectiveness of such solid forms. More reasons given for the preference of these solid forms include their easy application with all kinds of agricultural equipment and, above all, the ability of these fertilizers to supply nutrients uniformly over time, thus wide in usage under the green fertilizer category.
Regional Analysis
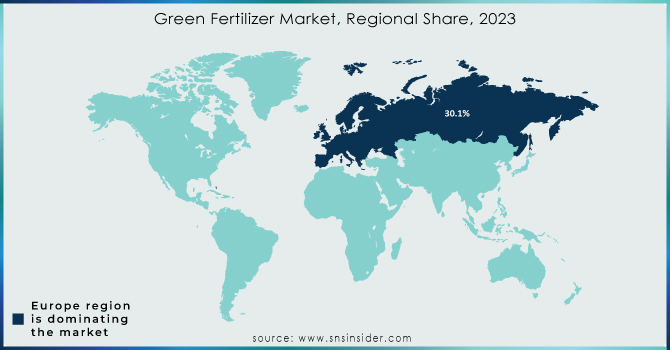
In 2023, Europe dominated the Green Fertilizer market with a revenue share of 30.1%, supported by the strong regulatory framework and dedication to sustainability in agriculture. European countries have been trendsetters in adopting green farming practices that are propelled by stringent EU regulations and incentives for green agriculture. For example, green fertilizers have found great impetus in countries like Germany, France, and the Netherlands through initiatives aiming to minimize environmental impact and improve soil health. Advanced agricultural policies in Germany and support from France toward organic farming, coupled with path-breaking initiatives in sustainable agriculture in the Netherlands, have hugely contributed to the dominance of the market in Europe. Next was the leadership in the marketplace; its comprehensive approach to sustainability in the region sealed it, while the robust infrastructure for green fertilizer production and distribution weighed in its favor.
In 2023, the Asia-Pacific region contributed to the highest growth rate of 6.03% in the Green Fertilizer market. Growth in the region is attributed to rising agricultural activities, increasing awareness about sustainable farming practices, and supportive government policies related to eco-friendly agriculture. For instance, countries such as China and India have attached green fertilizer technologies to their overall plans aimed at developing soil health and reducing environmental impact. Government of India schemes, like the Paramparagat Krishi Vikas Yojana, have also emphasized organic farming and green fertilizers; this has greatly increased its adoption. Similarly, the drive towards modernization of agriculture and the protection of the environment in China encourages the adoption of green fertilizers.
Some of the major players in the Green Fertilizer Market are Yara International, Nutrien Ltd., Coromandel International Ltd., Tata Chemicals, Ishihara Sangyo Kaisha Ltd., BioWorks, Inc., The Mosaic Company, K+S AG, Loveland Products, Inc., Haifa Group, and other players.
RECENT DEVELOPMENTS
May 2024: U.S. Department of Agriculture Secretary Tom Vilsack said that the USDA had provided funds for domestic fertilizer projects to boost competition for the benefit of U.S. farmers, ranchers, and agricultural producers.
March 2024: Argus released provisional pricing assessments for low- and zero-carbon calcium ammonium nitrate, reflecting the values of production processes associated with blue ammonia—produced with carbon-capture and carbon-storage—or green ammonia, made with renewable power.
October 2023: Macquarie Asset Management invested $325 million in Atlas Agro, a Swiss green nitrogen fertilizer player, to enhance its growth and sustainability ambitions by replacing energy-intensive fossil fuel-based fertilizers blamed for some 2 percent of global greenhouse gas emissions.
| Report Attributes | Details |
|---|---|
| Market Size in 2023 | US$ 2.15 Billion |
| Market Size by 2032 | US$ 3.53 Billion |
| CAGR | CAGR of 5.65% From 2024 to 2032 |
| Base Year | 2023 |
| Forecast Period | 2024-2032 |
| Historical Data | 2020-2022 |
| Report Scope & Coverage | Market Size, Segments Analysis, Competitive Landscape, Regional Analysis, DROC & SWOT Analysis, Forecast Outlook |
| Key Segments | •By Technology (Alkaline water electrolysis, Proton Exchange Membrane, Solid Oxide Electrolysis) •By Fertilizer Type (Ammonium nitrate (AN) and Calcium ammonium nitrate (CAN)) •By Form (Solid [Granules, Pellets, Powder], Liquid [Concentrates, Solutions] |
| Regional Analysis/Coverage | North America (US, Canada, Mexico), Europe (Eastern Europe [Poland, Romania, Hungary, Turkey, Rest of Eastern Europe] Western Europe] Germany, France, UK, Italy, Spain, Netherlands, Switzerland, Austria, Rest of Western Europe]), Asia Pacific (China, India, Japan, South Korea, Vietnam, Singapore, Australia, Rest of Asia Pacific), Middle East & Africa (Middle East [UAE, Egypt, Saudi Arabia, Qatar, Rest of Middle East], Africa [Nigeria, South Africa, Rest of Africa], Latin America (Brazil, Argentina, Colombia, Rest of Latin America) |
| Company Profiles | Yara International, Nutrien Ltd., Coromandel International Ltd., Tata Chemicals, Ishihara Sangyo Kaisha Ltd., BioWorks, Inc., The Mosaic Company, K+S AG, Loveland Products, Inc., Haifa Group |
| Key Drivers | •Growing demand for organic and sustainable farming •Cost-effectiveness and long-term benefits |
| RESTRAINTS | •Low awareness and adoption •Environmental concerns and water quality |
Ans: The European region dominated the Green Fertilizer Market holding the largest market share of about 30.1% during the forecast period.
Ans: Low awareness and adoption and environmental concerns and water quality hamper the growth of green fertilizer market
Ans: Growing demand for organic and sustainable farming and cost-effectiveness and long-term benefits are the driving factors that fuel the demand for the green fertilizer market
Ans: Green Fertilizer Market size was USD 2.15 million in 2023 and is expected to reach USD 3.53 million by 2032.
Ans: The Green Fertilizer Market is expected to grow at a CAGR of 5.65%.
TABLE OF CONTENTS
1. Introduction
1.1 Market Definition
1.2 Scope
1.3 Research Assumptions
2. Industry Flowchart
3. Research Methodology
4. Market Dynamics
4.1 Drivers
4.2 Restraints
4.3 Opportunities
4.4 Challenges
5. Porter’s 5 Forces Model
6. Pest Analysis
7. Green Fertilizer Market Segmentation, by Technology
7.1 Introduction
7.2 Alkaline water electrolysis
7.3 Proton Exchange Membrane
7.4 Solid Oxide Electrolysis
8. Green Fertilizer Market Segmentation, by Fertilizer Type
8.1 Introduction
8.2 Ammonium nitrate (AN)
8.3 Calcium ammonium nitrate (CAN)
9. Green Fertilizer Market Segmentation, by Form
9.1 Introduction
9.2 Solid
9.2.1 Granules
9.2.2 Pellets
9.2.3 Powder
9.3 Liquid
9.3.1 Concentrates
9.3.2 Solutions
10. Regional Analysis
10.1 Introduction
10.2 North America
10.2.1 Trend Analysis
10.2.2 North America Green Fertilizer Market by Country
10.2.3 North America Green Fertilizer Market by Technology
10.2.4 North America Green Fertilizer Market by Fertilizer Type
10.2.5 North America Green Fertilizer Market by Form
10.2.6 USA
10.2.6.1 USA Green Fertilizer Market by Technology
10.2.6.2 USA Green Fertilizer Market by Fertilizer Type
10.2.6.3 USA Green Fertilizer Market by Form
10.2.7 Canada
10.2.7.1 Canada Green Fertilizer Market by Technology
10.2.7.2 Canada Green Fertilizer Market by Fertilizer Type
10.2.7.3 Canada Green Fertilizer Market by Form
10.2.8 Mexico
10.2.8.1 Mexico Green Fertilizer Market by Technology
10.2.8.2 Mexico Green Fertilizer Market by Fertilizer Type
10.2.8.3 Mexico Green Fertilizer Market by Form
10.3 Europe
10.3.1 Trend Analysis
10.3.2 Eastern Europe
10.3.2.1 Eastern Europe Green Fertilizer Market by Country
10.3.2.2 Eastern Europe Green Fertilizer Market by Technology
10.3.2.3 Eastern Europe Green Fertilizer Market by Fertilizer Type
10.3.2.4 Eastern Europe Green Fertilizer Market by Form
10.3.2.5 Poland
10.3.2.5.1 Poland Green Fertilizer Market by Technology
10.3.2.5.2 Poland Green Fertilizer Market by Fertilizer Type
10.3.2.5.3 Poland Green Fertilizer Market by Form
10.3.2.6 Romania
10.3.2.6.1 Romania Green Fertilizer Market by Technology
10.3.2.6.2 Romania Green Fertilizer Market by Fertilizer Type
10.3.2.6.4 Romania Green Fertilizer Market by Form
10.3.2.7 Hungary
10.3.2.7.1 Hungary Green Fertilizer Market by Technology
10.3.2.7.2 Hungary Green Fertilizer Market by Fertilizer Type
10.3.2.7.3 Hungary Green Fertilizer Market by Form
10.3.2.8 Turkey
10.3.2.8.1 Turkey Green Fertilizer Market by Technology
10.3.2.8.2 Turkey Green Fertilizer Market by Fertilizer Type
10.3.2.8.3 Turkey Green Fertilizer Market by Form
10.3.2.9 Rest of Eastern Europe
10.3.2.9.1 Rest of Eastern Europe Green Fertilizer Market by Technology
10.3.2.9.2 Rest of Eastern Europe Green Fertilizer Market by Fertilizer Type
10.3.2.9.3 Rest of Eastern Europe Green Fertilizer Market by Form
10.3.3 Western Europe
10.3.3.1 Western Europe Green Fertilizer Market by Country
10.3.3.2 Western Europe Green Fertilizer Market by Technology
10.3.3.3 Western Europe Green Fertilizer Market by Fertilizer Type
10.3.3.4 Western Europe Green Fertilizer Market by Form
10.3.3.5 Germany
10.3.3.5.1 Germany Green Fertilizer Market by Technology
10.3.3.5.2 Germany Green Fertilizer Market by Fertilizer Type
10.3.3.5.3 Germany Green Fertilizer Market by Form
10.3.3.6 France
10.3.3.6.1 France Green Fertilizer Market by Technology
10.3.3.6.2 France Green Fertilizer Market by Fertilizer Type
10.3.3.6.3 France Green Fertilizer Market by Form
10.3.3.7 UK
10.3.3.7.1 UK Green Fertilizer Market by Technology
10.3.3.7.2 UK Green Fertilizer Market by Fertilizer Type
10.3.3.7.3 UK Green Fertilizer Market by Form
10.3.3.8 Italy
10.3.3.8.1 Italy Green Fertilizer Market by Technology
10.3.3.8.2 Italy Green Fertilizer Market by Fertilizer Type
10.3.3.8.3 Italy Green Fertilizer Market by Form
10.3.3.9 Spain
10.3.3.9.1 Spain Green Fertilizer Market by Technology
10.3.3.9.2 Spain Green Fertilizer Market by Fertilizer Type
10.3.3.9.3 Spain Green Fertilizer Market by Form
10.3.3.10 Netherlands
10.3.3.10.1 Netherlands Green Fertilizer Market by Technology
10.3.3.10.2 Netherlands Green Fertilizer Market by Fertilizer Type
10.3.3.10.3 Netherlands Green Fertilizer Market by Form
10.3.3.11 Switzerland
10.3.3.11.1 Switzerland Green Fertilizer Market by Technology
10.3.3.11.2 Switzerland Green Fertilizer Market by Fertilizer Type
10.3.3.11.3 Switzerland Green Fertilizer Market by Form
10.3.3.12 Austria
10.3.3.12.1 Austria Green Fertilizer Market by Technology
10.3.3.12.2 Austria Green Fertilizer Market by Fertilizer Type
10.3.3.12.3 Austria Green Fertilizer Market by Form
10.3.3.13 Rest of Western Europe
10.3.3.13.1 Rest of Western Europe Green Fertilizer Market by Technology
10.3.3.13.2 Rest of Western Europe Green Fertilizer Market by Fertilizer Type
10.3.3.13.3 Rest of Western Europe Green Fertilizer Market by Form
10.4 Asia-Pacific
10.4.1 Trend Analysis
10.4.2 Asia-Pacific Green Fertilizer Market by Country
10.4.3 Asia-Pacific Green Fertilizer Market by Technology
10.4.4 Asia-Pacific Green Fertilizer Market by Fertilizer Type
10.4.5 Asia-Pacific Green Fertilizer Market by Form
10.4.6 China
10.4.6.1 China Green Fertilizer Market by Technology
10.4.6.2 China Green Fertilizer Market by Fertilizer Type
10.4.6.3 China Green Fertilizer Market by Form
10.4.7 India
10.4.7.1 India Green Fertilizer Market by Technology
10.4.7.2 India Green Fertilizer Market by Fertilizer Type
10.4.7.3 India Green Fertilizer Market by Form
10.4.8 Japan
10.4.8.1 Japan Green Fertilizer Market by Technology
10.4.8.2 Japan Green Fertilizer Market by Fertilizer Type
10.4.8.3 Japan Green Fertilizer Market by Form
10.4.9 South Korea
10.4.9.1 South Korea Green Fertilizer Market by Technology
10.4.9.2 South Korea Green Fertilizer Market by Fertilizer Type
10.4.9.3 South Korea Green Fertilizer Market by Form
10.4.10 Vietnam
10.4.10.1 Vietnam Green Fertilizer Market by Technology
10.4.10.2 Vietnam Green Fertilizer Market by Fertilizer Type
10.4.10.3 Vietnam Green Fertilizer Market by Form
10.4.11 Singapore
10.4.11.1 Singapore Green Fertilizer Market by Technology
10.4.11.2 Singapore Green Fertilizer Market by Fertilizer Type
10.4.11.3 Singapore Green Fertilizer Market by Form
10.4.12 Australia
10.4.12.1 Australia Green Fertilizer Market by Technology
10.4.12.2 Australia Green Fertilizer Market by Fertilizer Type
10.4.12.3 Australia Green Fertilizer Market by Form
10.4.13 Rest of Asia-Pacific
10.4.13.1 Rest of Asia-Pacific Green Fertilizer Market by Technology
10.4.13.2 Rest of Asia-Pacific Green Fertilizer Market by Fertilizer Type
10.4.13.3 Rest of Asia-Pacific Green Fertilizer Market by Form
10.5 Middle East & Africa
10.5.1 Trend Analysis
10.5.2 Middle East
10.5.2.1 Middle East Green Fertilizer Market by Country
10.5.2.2 Middle East Green Fertilizer Market by Technology
10.5.2.3 Middle East Green Fertilizer Market by Fertilizer Type
10.5.2.4 Middle East Green Fertilizer Market by Form
10.5.2.5 UAE
10.5.2.5.1 UAE Green Fertilizer Market by Technology
10.5.2.5.2 UAE Green Fertilizer Market by Fertilizer Type
10.5.2.5.3 UAE Green Fertilizer Market by Form
10.5.2.6 Egypt
10.5.2.6.1 Egypt Green Fertilizer Market by Technology
10.5.2.6.2 Egypt Green Fertilizer Market by Fertilizer Type
10.5.2.6.3 Egypt Green Fertilizer Market by Form
10.5.2.7 Saudi Arabia
10.5.2.7.1 Saudi Arabia Green Fertilizer Market by Technology
10.5.2.7.2 Saudi Arabia Green Fertilizer Market by Fertilizer Type
10.5.2.7.3 Saudi Arabia Green Fertilizer Market by Form
10.5.2.8 Qatar
10.5.2.8.1 Qatar Green Fertilizer Market by Technology
10.5.2.8.2 Qatar Green Fertilizer Market by Fertilizer Type
10.5.2.8.3 Qatar Green Fertilizer Market by Form
10.5.2.9 Rest of Middle East
10.5.2.9.1 Rest of Middle East Green Fertilizer Market by Technology
10.5.2.9.2 Rest of Middle East Green Fertilizer Market by Fertilizer Type
10.5.2.9.3 Rest of Middle East Green Fertilizer Market by Form
10.5.3 Africa
10.5.3.1 Africa Green Fertilizer Market by Country
10.5.3.2 Africa Green Fertilizer Market by Technology
10.5.3.3 Africa Green Fertilizer Market by Fertilizer Type
10.5.3.4 Africa Green Fertilizer Market by Form
10.5.3.5 Nigeria
10.5.3.5.1 Nigeria Green Fertilizer Market by Technology
10.5.3.5.2 Nigeria Green Fertilizer Market by Fertilizer Type
10.5.3.5.3 Nigeria Green Fertilizer Market by Form
10.5.3.6 South Africa
10.5.3.6.1 South Africa Green Fertilizer Market by Technology
10.5.3.6.2 South Africa Green Fertilizer Market by Fertilizer Type
10.5.3.6.3 South Africa Green Fertilizer Market by Form
10.5.3.7 Rest of Africa
10.5.3.7.1 Rest of Africa Green Fertilizer Market by Technology
10.5.3.7.2 Rest of Africa Green Fertilizer Market by Fertilizer Type
10.5.3.7.3 Rest of Africa Green Fertilizer Market by Form
10.6 Latin America
10.6.1 Trend Analysis
10.6.2 Latin America Green Fertilizer Market by country
10.6.3 Latin America Green Fertilizer Market by Technology
10.6.4 Latin America Green Fertilizer Market by Fertilizer Type
10.6.5 Latin America Green Fertilizer Market by Form
10.6.6 Brazil
10.6.6.1 Brazil Green Fertilizer Market by Technology
10.6.6.2 Brazil Green Fertilizer Market by Fertilizer Type
10.6.6.3 Brazil Green Fertilizer Market by Form
10.6.7 Argentina
10.6.7.1 Argentina Green Fertilizer Market by Technology
10.6.7.2 Argentina Green Fertilizer Market by Fertilizer Type
10.6.7.3 Argentina Green Fertilizer Market by Form
10.6.8 Colombia
10.6.8.1 Colombia Green Fertilizer Market by Technology
10.6.8.2 Colombia Green Fertilizer Market by Fertilizer Type
10.6.8.3 Colombia Green Fertilizer Market by Form
10.6.9 Rest of Latin America
10.6.9.1 Rest of Latin America Green Fertilizer Market by Technology
10.6.9.2 Rest of Latin America Green Fertilizer Market by Fertilizer Type
10.6.9.3 Rest of Latin America Green Fertilizer Market by Form
11. Company Profiles
11.1 Yara International
11.1.1 Company Overview
11.1.2 Financial
11.1.3 Products/ Services Offered
11.1.4 The SNS View
11.2 Nutrien Ltd.
11.2.1 Company Overview
11.2.2 Financial
11.2.3 Products/ Services Offered
11.2.4 The SNS View
11.3 Coromandel International Ltd.
11.3.1 Company Overview
11.3.2 Financial
11.3.3 Products/ Services Offered
11.3.4 The SNS View
11.4 Tata Chemicals
11.4.1 Company Overview
11.4.2 Financial
11.4.3 Products/ Services Offered
11.4.4 The SNS View
11.5 Ishihara Sangyo Kaisha Ltd.
11.5.1 Company Overview
11.5.2 Financial
11.5.3 Products/ Services Offered
11.5.4 The SNS View
11.6 BioWorks, Inc.
11.6.1 Company Overview
11.6.2 Financial
11.6.3 Products/ Services Offered
11.6.4 The SNS View
11.7 The Mosaic Company
11.7.1 Company Overview
11.7.2 Financial
11.7.3 Products/ Services Offered
11.7.4 The SNS View
11.8 K+S AG
11.8.1 Company Overview
11.8.2 Financial
11.8.3 Products/ Services Offered
11.8.4 The SNS View
11.9 Loveland Products, Inc.
11.9.1 Company Overview
11.9.2 Financial
11.9.3 Products/ Services Offered
11.9.4 The SNS View
11.10 Haifa Group
11.10.1 Company Overview
11.10.2 Financial
11.10.3 Products/ Services Offered
11.10.4 The SNS View
12. Competitive Landscape
12.1 Competitive Benchmarking
12.2 Market Share Analysis
12.3 Recent Developments
12.3.1 Industry News
12.3.2 Company News
12.3.3 Mergers & Acquisitions
13. Use Case and Best Practices
14. Conclusion
An accurate research report requires proper strategizing as well as implementation. There are multiple factors involved in the completion of good and accurate research report and selecting the best methodology to compete the research is the toughest part. Since the research reports we provide play a crucial role in any company’s decision-making process, therefore we at SNS Insider always believe that we should choose the best method which gives us results closer to reality. This allows us to reach at a stage wherein we can provide our clients best and accurate investment to output ratio.
Each report that we prepare takes a timeframe of 350-400 business hours for production. Starting from the selection of titles through a couple of in-depth brain storming session to the final QC process before uploading our titles on our website we dedicate around 350 working hours. The titles are selected based on their current market cap and the foreseen CAGR and growth.
The 5 steps process:
Step 1: Secondary Research:
Secondary Research or Desk Research is as the name suggests is a research process wherein, we collect data through the readily available information. In this process we use various paid and unpaid databases which our team has access to and gather data through the same. This includes examining of listed companies’ annual reports, Journals, SEC filling etc. Apart from this our team has access to various associations across the globe across different industries. Lastly, we have exchange relationships with various university as well as individual libraries.

Step 2: Primary Research
When we talk about primary research, it is a type of study in which the researchers collect relevant data samples directly, rather than relying on previously collected data. This type of research is focused on gaining content specific facts that can be sued to solve specific problems. Since the collected data is fresh and first hand therefore it makes the study more accurate and genuine.
We at SNS Insider have divided Primary Research into 2 parts.
Part 1 wherein we interview the KOLs of major players as well as the upcoming ones across various geographic regions. This allows us to have their view over the market scenario and acts as an important tool to come closer to the accurate market numbers. As many as 45 paid and unpaid primary interviews are taken from both the demand and supply side of the industry to make sure we land at an accurate judgement and analysis of the market.
This step involves the triangulation of data wherein our team analyses the interview transcripts, online survey responses and observation of on filed participants. The below mentioned chart should give a better understanding of the part 1 of the primary interview.

Part 2: In this part of primary research the data collected via secondary research and the part 1 of the primary research is validated with the interviews from individual consultants and subject matter experts.
Consultants are those set of people who have at least 12 years of experience and expertise within the industry whereas Subject Matter Experts are those with at least 15 years of experience behind their back within the same space. The data with the help of two main processes i.e., FGDs (Focused Group Discussions) and IDs (Individual Discussions). This gives us a 3rd party nonbiased primary view of the market scenario making it a more dependable one while collation of the data pointers.
Step 3: Data Bank Validation
Once all the information is collected via primary and secondary sources, we run that information for data validation. At our intelligence centre our research heads track a lot of information related to the market which includes the quarterly reports, the daily stock prices, and other relevant information. Our data bank server gets updated every fortnight and that is how the information which we collected using our primary and secondary information is revalidated in real time.

Step 4: QA/QC Process
After all the data collection and validation our team does a final level of quality check and quality assurance to get rid of any unwanted or undesired mistakes. This might include but not limited to getting rid of the any typos, duplication of numbers or missing of any important information. The people involved in this process include technical content writers, research heads and graphics people. Once this process is completed the title gets uploader on our platform for our clients to read it.
Step 5: Final QC/QA Process:
This is the last process and comes when the client has ordered the study. In this process a final QA/QC is done before the study is emailed to the client. Since we believe in giving our clients a good experience of our research studies, therefore, to make sure that we do not lack at our end in any way humanly possible we do a final round of quality check and then dispatch the study to the client.
Key Segments:
By Technology
Alkaline water electrolysis
Proton Exchange Membrane
Solid Oxide Electrolysis
By Fertilizer Type
Ammonium nitrate (AN)
Calcium ammonium nitrate (CAN)
By Form
Solid
Granules
Pellets
Powder
Liquid
Concentrates
Solutions
Request for Segment Customization as per your Business Requirement: Segment Customization Request
Regional Coverage:
Regional Coverage
North America
US
Canada
Mexico
Europe
Eastern Europe
Poland
Romania
Hungary
Turkey
Rest of Eastern Europe
Western Europe
Germany
France
UK
Italy
Spain
Netherlands
Switzerland
Austria
Rest of Western Europe
Asia Pacific
China
India
Japan
South Korea
Vietnam
Singapore
Australia
Rest of Asia Pacific
Middle East & Africa
Middle East
UAE
Egypt
Saudi Arabia
Qatar
Rest of Middle East
Africa
Nigeria
South Africa
Rest of Africa
Latin America
Brazil
Argentina
Colombia
Rest of Latin America
Request for Country Level Research Report: Country Level Customization Request
Available Customization
With the given market data, SNS Insider offers customization as per the company’s specific needs. The following customization options are available for the report:
Product Analysis
Criss-Cross segment analysis (e.g. Product X Application)
Product Matrix which gives a detailed comparison of product portfolio of each company
Geographic Analysis
Additional countries in any of the regions
Company Information
Detailed analysis and profiling of additional market players (Up to five)
Explore the Argan Oil Market, focusing on its use in cosmetics, personal care, and food industries. Learn about key trends, rising demand for natural ingredients, and how argan oil's skin, hair, and health benefits are driving its growth in the global mar
Propylene Carbonate Market size was USD 396.40 Million in 2023 and is expected to reach USD 672.63 Million by 2032, growing at a CAGR of 6.05% from 2024-2032.
The Mulching Materials Market size was valued at USD 3.5 Billion in 2023 & will grow to USD 6.8 Billion by 2032 and grow at a CAGR of 7.7% by 2024-2032.
The Fireproofing Materials Market Size was valued at USD 1.1 billion in 2023 and is expected to reach USD 2.5 billion by 2032 and grow at a CAGR of 9.9% over the forecast period 2024-2032.
The Greases Market Size was valued at USD 6.06 Billion in 2023 and is expected to reach USD 8.70 Billion by 2032, growing at a CAGR of 4.10% from 2024-2032.
The Micro Flute Paper Market size was USD 74.91 billion in 2023 and is expected to Reach USD 120.99 billion by 2032 and grow at a CAGR of 5.47% over the forecast period of 2024-2032.

Hi! Click one of our member below to chat on Phone
© 2025 All Rights Reserved by SNS Insider Pvt Ltd


