Graphene Electronics Market Size & Trends:
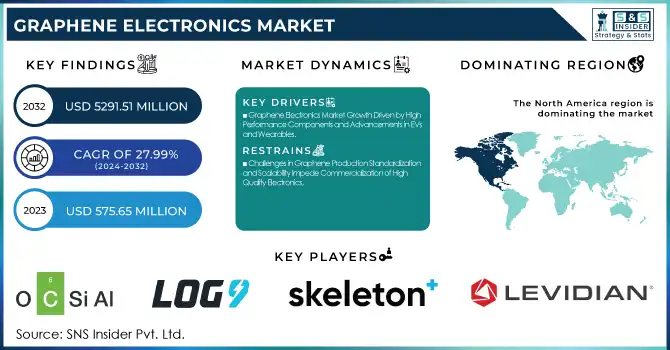
The Graphene Electronics Market Size was valued at USD 575.65 million in 2023 and is expected to reach USD 5291.51 million by 2032, growing at a CAGR of 27.99% over the forecast period 2024-2032. The Graphene Electronics Industry is swiftly continuing to expand due to the soaring demand for high-speed, energy-efficient, and flexible electronic components. Graphene's greater conductivity, thermal management, and mechanical strength are driving increasing adoption in consumer electronics, automotive, and energy storage. Progress in transistor scale, battery consumption, and sensor detection. Moreover, graphene-based products show exceptional durability, heat resistance, and long-lasting service life for the next generation of semiconductors, flexible displays, and big-capacity energy storage.
To get more information on Graphene Electronics Market - Request Free Sample Report
Graphene Electronics Market Dynamics
Key Drivers:
-
Graphene Electronics Market Growth Driven by High-Performance Components and Advancements in EVs and Wearables
A key factor driving the graphene electronics market is the growing requirement for high-performance, lightweight, and flexible electronic components in various fields. Graphene, with its unrivaled electrical conductivity, thermal stability, and mechanical strength, serves as the basis of many promising next-generation transistors, sensors, batteries, and supercapacitors. Novel advances in the manufacturing of EVs and storage solutions have led to a rapid increase in demand for graphene-based batteries and supercapacitors, as these solutions allow faster charging times and higher energy density, matching the needs of the emerging electric vehicle (EVs) and renewable energy storage markets. Soaring utilization of graphene in flexible and wearable electronics including smartwatches, foldable displays, and next-generation sensors is also expected to drive market growth.
Restrain:
-
Challenges in Graphene Production Standardization and Scalability Impede Commercialization of High-Quality Electronics
The absence of standardized large-scale production techniques represents one of the most important challenges. Present manufacturing methods such as CVD and exfoliation methods result in graphene with non-uniform quality, contamination, and layer thickness impairing the electronic and mechanical properties of the material. This variability hinders the incorporation of graphene into high-volume, high-performance electronics. Moreover, scalability issues in the synthesis of high-quality graphene still have a profound impact on its complete commercialization or industrialization, where the synthesis of defect-free monolayers is a challenge.
Opportunity:
-
Graphene Offers Vast Opportunities in Biomedical Aerospace and Sustainable Energy Driving Next-Gen High-Tech Applications
Huge opportunities are present in biomedical applications, aerospace, and sustainable energy offers. There is increasing interest in the use of graphene as biosensors for early detection of diseases and in the pharmaceutical industry as a drug transport system in the healthcare sector. Graphene coatings and coatings based on it are being considered for use in light, hard structures in aerospace. Graphene has the potential to enable a new era of high-efficiency solar panels, energy-efficient transistors, and next-gen hydrogen storage; trends that play well in the increasingly crowded space of sustainability and green energy solutions. As new breakthroughs emerge and industrial cooperation increases, graphene electronics will be rapidly implemented into various high-tech applications.
Challenges:
-
Graphene's Integration Challenges in Semiconductor Manufacturing and Bandgap Engineering Hindering Electronics Advancements
One of the major hurdles here is that graphene does not fit well with current semiconductor manufacturing processes. The silicon-based fabrication technology is only partially suitable for graphene, requiring significant changes, new infrastructure, and associated costs. Furthermore, the absence of an inherent bandgap in graphene limits its potential to realize transistors that can turn on and off properly, which is an essential operation in digital electronics. Bandgap engineering has been considered but is not always practically applicable (namely, achieved in practice). Moreover, the uncertainties around regulations and the safety issues about its possible adverse environmental and biological effects also challenge its introduction for general use. If the industry is to realize the true potential of graphene in electronics, these challenges need to be addressed.
Graphene Electronics Market Segmentation Overview
By Application
Conductive inks accounted for 37.7% of the graphene electronics market in 2023 on account of their applications in printed electronics, flexible circuits, RFID tags, and touch sensors. Low-cost graphene-based conductive inks provide much better conductivity, flexibility, and durability compared to conductive inks, and have great promise for printing or coating next-generation electronic devices. The demand for these has been majorly driven due to their application in wearable sensors, smart packaging, and automotive displays. Moreover, the rise of Internet of Things (IoT) devices has also expanded their applications in low-power, lightweight circuits.
Batteries are expected to have the fastest CAGR from 2024 to 2032 due to high-performance storage devices used in high-energy-density electric vehicles (EVs), renewable energy storage systems, and consumer electronics. They are faster, last longer than lithium-ion, and can have a higher energy density. If anything, battery innovation is now just beginning with graphene-carbide batteries.
By Material Type
Graphene oxide accounted for 42.8% of the graphene electronics market share in 2023 owing to its wide availability, simple production, and compatibility with potential applications. Graphene oxide is hydrophilic and can be readily dispersed in a solvent, which makes it ideally suited for coatings, sensors, flexible electronics, and biomedical applications in contrast to pristine graphene. The dimensional layered metal oxide is extensively utilized in e.g. transparent conductive films, printed electronics, and energy storage devices because of its versatile tunable electrical and mechanical properties. More importantly, its production mechanism of chemical oxidation of graphite is relatively cheap and scalable, rendering it the most available graphene form on a commercial basis.
The graphene nanoplatelets (GNPs) segment is anticipated to register the fastest CAGR between 2024 and 2032. GNPs are becoming popular for high-performance batteries, supercapacitors, and composites for automotive and aerospace fields. Given their promise to improve the mechanical strength and conductivity of polymer composite materials, they are suitable for the development of lightweight, long-living, and also energy-efficient materials. GNPs can find a fast adoption due to high-performance graphene-enhanced material solutions for energy storage, structural reinforcement, and thermal management(-based), which industries are actively looking after, growing the market of GNP limited only by supply.
By Market Form
Coatings led the graphene electronics industry with a share of 35.8% in 2023, attributed to its widespread use in protective, conductive, and anti-corrosion applications. Due to their highest volatility, mechanical strength, and thermal stability, graphene-based coatings are an excellent choice in the electronics, automotive, aerospace, and energy storage industries. High demand for printed circuit boards (PCBs), flexible displays, and electromagnetic interference shielding is driven by the ability of these materials to improve durability, eliminate oxidation, and enhance heat dissipation.
Powder is projected to register the highest CAGR throughout 2024 – 2032 and the growth can be attributed to versatility and ease of integration into several advanced applications. This high demand for graphene powder applies to use in batteries, supercapacitors, polymer composites, and thermal management systems, which in turn drives demand in the electric vehicle (EV), renewable energy as well as aerospace markets. It improves the performance of batteries, energy efficiency, and lightweight composite materials thanks to its higher surface area, conductivity, and mechanical properties.
By End Use Industry
Consumer electronics accounted for the largest share of 35.2% of the graphene electronics market in 2023 owing to the increasing usage of graphene-based components in smartphones, wearables, tablets, and flexible displays. Graphene is ideal for touchscreens, low-power sensors, and next-generation transistors due to its special conductivity, flexibility, and heat dissipation properties. The need for lightweight, ultra-thin, and durable electronic devices has driven the adoption of graphene in printed electronics, Transparent conductive Film, EMI shielding, etc.
The energy sector is anticipated to drive the fastest car from 2024 to 2032 owing to the significant role of graphene in future energy storage and conversion technologies Compared to conventional lithium-ion batteries, graphene batteries, supercapacitors, and fuel cells offer a wider range of energy density, shorter charge time, and longer life span. As the world turns towards cleaner forms of energy, including the widespread adoption of electric vehicles (EVs) and improvements in the storage of renewable energy, one material, graphene, is coming to the forefront as a leading material in improving battery performance and grid-scale storage capabilities.
Graphene Electronics Market Regional Outlook
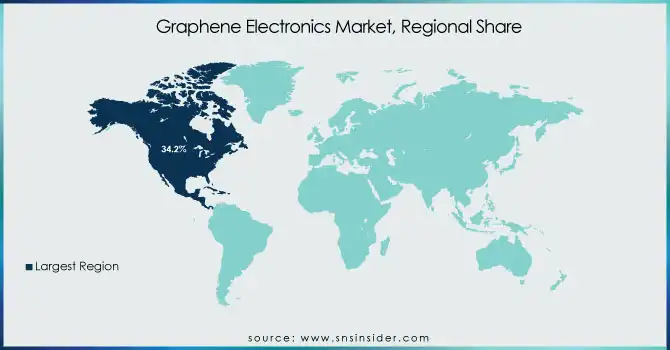
In 2023, North America dominated the market and accounted for 34.2% of the total share graphene electronics market owing to the robust R&D at the global level, government support along the high uptake of advanced technologies. Interestingly umbrella organizations like IBM, General Electric, and Tesla are investing efforts in increasing technology in graphene transistors, and batteries sensors. Graphene only is overwhelming in the U.S. and in Canada and graphene semiconductors for energy storage applications may have been a major institutional breakthrough by (mostly) MIT and Manchester (UK partnered with some North American firms). Companies such as NanoXplore (Canada) and Graphene Frontiers (U.S.) are making significant investments in this market, ensuring North America will continue to lead in commercial graphene R&D as more graphene-based coatings, flexible electronics, and supercapacitors are constructed.
Asia-Pacific is estimated to register the fastest CAGR between 2024 and 2032 owing to notable demand for consumer electronics, electric vehicles (EVs), and renewable energy applications. Meanwhile, nations such as China, Japan, and South Korea are focused on heavy investment in graphene R&D, with the likes of Samsung (S. Korea) investigating the use of graphene-based batteries for smartphones and EVs. Besides, The Sixth Element Materials and Beijing Graphene Institute are all companies with breakthrough developments in graphene-based batteries and composite materials, respectively, from China. The blossoming market for electric vehicles (EV), driven by fast-zooming players like BYD and CATL, coupled with a robust interest in nanotechnology and clean energy government levels is propelling the development of graphene electronics in the region.
Get Customized Report as per Your Business Requirement - Enquiry Now
Key Players
Some of the major players in the Graphene Electronics Market are:
-
OCSiAl (TUBALL single-wall carbon nanotubes, TUBALL BATT nanotube dispersion)
-
Log9 Materials (Aluminium–air battery, Rapid Charging EVs)
-
Skeleton Technologies (SkelCap SCA series supercapacitor cells, SkelMod modules)
-
Levidian Nanosystems (LOOP technology for methane conversion, high-quality graphene production)
-
Graphene Square (Graphene-based transparent cooker, large-area graphene films)
-
GraphEnergyTech (Conductive graphene ink electrodes for solar panels, graphene-based battery components)
-
InBrain Neuroelectronics (Graphene-based brain implants, neural interfaces for neurological treatments)
-
First Graphene Ltd (PureGRAPH graphene powders, FireStop graphene-enhanced fire retardant)
-
Haydale Graphene Industries (Graphene-enhanced composites, functionalized graphene inks)
-
Versarien plc (Graphene-based thermal interface materials, graphene-enhanced polymers)
-
Applied Graphene Materials (Graphene nanoplatelet dispersions, graphene-based coatings)
-
Directa Plus (G+ graphene for textiles, Grafysorber oil adsorption material)
-
Talga Resources (Talphene graphene products, graphene silicon anode for batteries)
-
XG Sciences (xGnP graphene nanoplatelets, graphene-based energy storage materials)
-
Graphenea (CVD graphene films, graphene oxide products)
Recent Trends
-
In October 2024, OCSiAl opened its first European graphene nanotube production facility in Serbia, with an annual capacity of 60 tonnes, aiming to expand the supply of electronics, energy storage, and composites.
-
In April 2024, Zeta Energy and Log9 Materials partnered to develop next-generation lithium-sulfur battery systems, aiming to enhance performance and sustainability for EVs and energy storage.
| Report Attributes | Details |
|---|---|
| Market Size in 2023 | USD 575.65 Million |
| Market Size by 2032 | USD 5291.51 Million |
| CAGR | CAGR of 27.99% From 2024 to 2032 |
| Base Year | 2023 |
| Forecast Period | 2024-2032 |
| Historical Data | 2020-2022 |
| Report Scope & Coverage | Market Size, Segments Analysis, Competitive Landscape, Regional Analysis, DROC & SWOT Analysis, Forecast Outlook |
| Key Segments | • By Application (Conductive Inks, Sensors, Transistors, Supercapacitors, Batteries) • By Material Type (Graphene Oxide, Reduced Graphene Oxide, Graphene Nanoplatelets) • By Market Form (Coatings, Films, Powder, Composite Materials) • By End Use Industry (Consumer Electronics, Automotive, Aerospace, Healthcare, Energy) |
| Regional Analysis/Coverage | North America (US, Canada, Mexico), Europe (Eastern Europe [Poland, Romania, Hungary, Turkey, Rest of Eastern Europe] Western Europe] Germany, France, UK, Italy, Spain, Netherlands, Switzerland, Austria, Rest of Western Europe]), Asia Pacific (China, India, Japan, South Korea, Vietnam, Singapore, Australia, Rest of Asia Pacific), Middle East & Africa (Middle East [UAE, Egypt, Saudi Arabia, Qatar, Rest of Middle East], Africa [Nigeria, South Africa, Rest of Africa], Latin America (Brazil, Argentina, Colombia, Rest of Latin America) |
| Company Profiles | OCSiAl, Log9 Materials, Skeleton Technologies, Levidian Nanosystems, Graphene Square, GraphEnergyTech, InBrain Neuroelectronics, First Graphene Ltd, Haydale Graphene Industries, Versarien plc, Applied Graphene Materials, Directa Plus, Talga Resources, XG Sciences, Graphenea. |
